
January 18, 2021
The header image we use on this blog site emphasizes the need for “beacons of critical thinking.” The currently widespread buy-in to absurd conspiracy theories devoid of any factual basis – which we have decried and debunked here, here, here, here, here and here – provides unfortunate evidence that tribalism, cultism and social media are undermining critical thinking in today’s western societies. The dangers posed by this trend were revealed graphically by the January 6, 2020 insurrection attempt on the U.S. Congress by rioters who chose to believe baseless voting fraud lies promulgated by a delusional President and his media and Congressional apologists.
A renewed educational focus on sharpening critical thinking faculties is essential to the future health of our societies. We have previously posted an extensive set of tips to Tune Your Bullshit Detector. As a further small contribution toward the same educational end, we have collected in this post a range of questions from a wide variety of internet sites that test various aspects of critical thinking. No specialized knowledge is required to address any of these questions; they only require common sense, a few basic mathematical and pattern recognition skills, and an ability to analyze both usual and unusual situations, evidence, and problems clearly. All of the examples chosen for this post are non-trivial, and some are pretty challenging. The questions for you to test your own critical thinking skills are organized and presented in this post, while answers will be subsequently posted in Part II. If you are amused by the examples here, we urge you to go to some of the websites we link to, in order to see a wider set of critical thinking problems.
I. Questioning Assumptions
The following three questions require you to analyze and judge the validity of either explicit or implicit assumptions made by an author or a character or by most people in assessing the presented situations.
1) [Reproduced from https://sharpbrains.com/blog/2006/10/20/brain-puzzle-for-the-whole-brain-the-blind-beggar/]
A blind beggar had a brother who died. What relation was the blind beggar to the brother who died? “Brother” is not the answer.
2) [Adapted from 50 Activities for Developing Critical Thinking Skills, by Dr. Marlene Caroselli]
A middle-aged man called his doctor in the middle of the night. He described the pains his wife was having, diagnosed them as appendicitis (which he himself had experienced), and told the doctor he was bringing the woman into emergency.
The doctor, however, was much less concerned. He diagnosed the problem as stomach cramps, advised the man to give her ginger ale, and suggested that an appointment be made in the morning for an office visit. The man, fortunately, persisted.
Not used to having his medical judgment questioned, the doctor spoke authoritatively: “It cannot be her appendix,” he declared. “I distinctly remember removing your wife’s appendix eight years ago. And I have never heard of a woman having a second appendix!” What assumptions were being made by the husband? By the doctor? Why was the husband well justified in taking his wife to the hospital?
3) [Adapted from www.callingbullshit.org]
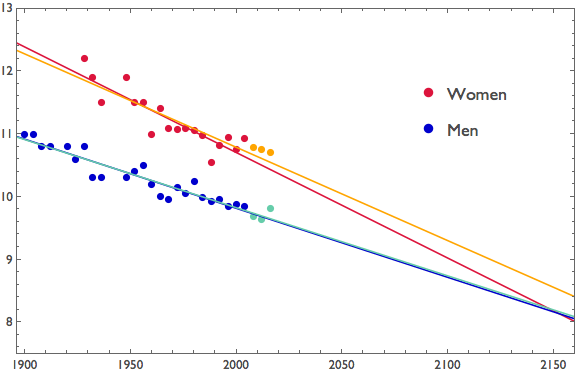
In 2004, the journal Nature published a short paper by Tatem and colleagues, in which the authors analyzed Olympic gold medal times in the 100-meter dash for men and women over time. By fitting the trends with the straight lines shown as dark blue and red lines in Fig. 1, the authors predicted that women runners would beat men in the 100 m dash for the first time by the year 2156. How much credence do you place in this prediction, and why?
II. Creative problem solving
The following three situations require you to use a bit of creativity to find optimal solutions to mundane problems.
4) [Adapted from https://www.schrockguide.net/uploads/3/9/2/2/392267/critical-thinking-workbook.pdf)
You drive past a bus stop in a car that can only seat a single passenger in addition to the driver. You see three people waiting for the bus: an old lady needing to get to a hospital urgently; an old friend who once saved your life; and your perfect partner. What is your optimal course of action, and why?
5) [Adapted from 50 Activities for Developing Critical Thinking Skills, by Dr. Marlene Caroselli]
In a creative engineering class at M.I.T, the instructor placed two ordinary ping-pong balls at the bottom of a tall metal cylinder. The cylinder was about seven inches wide and about five feet high. At the bottom end, the cylinder was welded to a solid metal flange that was bolted to the floor of the science lab. At the top end, the cylinder was open. The students were given one full hour to remove the ping-pong balls from the cylinder. They could work together, but they were not allowed to leave the room. They were free to use anything in the room. How would you solve this problem, using anything you can see in the photo in Fig. 2 of a typical teaching laboratory?

6) [Adapted from https://www.schrockguide.net/uploads/3/9/2/2/392267/critical-thinking-workbook.pdf]
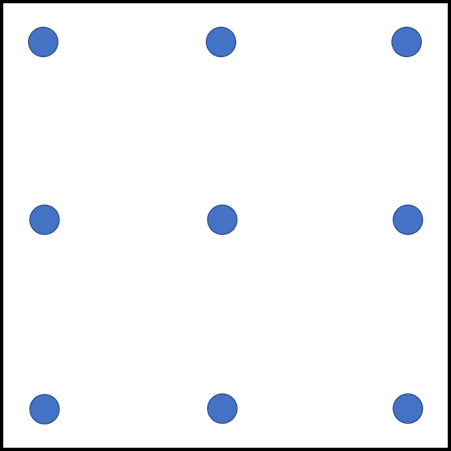
Connect the 9 dots in Fig. 3 using only 4 straight line segments, without lifting your pencil from the paper. Think outside the box.
III. Judging the validity of conclusions
The following examples present brief written descriptions of certain facts. You may assume that all the facts stated are accurate. You are then asked in each case to judge the validity of some conclusions that may or may not be drawn from those facts.
7) [Adapted from https://www.aptitude-test.com/free-aptitude-test/critical-thinking/]
Which of the four possible conclusions below can legitimately be drawn from the following information? There may be more than one correct answer.
Information: Michael is a dentist and he treats an average of ten patients per day. He is the most popular dentist in the city of Greenfield, perhaps because he is the dentist who has been around the longest. Last week he had ten cancellations and was unable to fill up the schedule completely, but he doesn’t mind the extra spare time. Next year he will retire and leave the practice to his son, who currently works in another city.
Possible conclusions:
a) Some days Michael receives less than ten patients.
b) Michael lives in Greenfield.
c) Michael has only one son.
d) There are more than three dentists who work in the city of Greenfield.
8) [Reproduced from https://www.assessmentday.co.uk/verbal/Free/Verbal-Reasoning-Test1-Questions.pdf]
Read the following description of China’s one-child policy, and then decide for each of the possible conclusions listed after the paragraph whether the stated conclusion is definitely true from the information in the paragraph, definitely false, or validity cannot be determined from the provided information.
Instituted in 1979 as a temporary measure to limit population growth, China’s one child policy remains in force today and is likely to continue for another decade. China’s population control policy has attracted criticism because of the manner in which it is enforced, and also because of its social repercussions. Supporters of the Chinese government’s policy consider it a necessary measure to curb extreme overpopulation, which has resulted in a reduction of an estimated 300 million people in its first twenty years. Not only is a reduced population environmentally beneficial, it also increases China’s per capita gross domestic product. The one-child policy has led to a disparate ratio of males to females – with abortion, abandonment and infanticide of female infants resulting from a cultural preference for sons. Furthermore, Draconian measures such as forced sterilization are strongly opposed by critics as a violation of human reproduction rights. The one-child policy is enforced strictly in urban areas, whereas in provincial regions fines are imposed on families with more than one child. There are also exceptions to the rules – for example, ethnic minorities. A rule also allows couples without siblings to have two children – a provision which applies to millions of sibling-free adults now of childbearing age.
Conclusion 1: China’s one-child policy increases the country’s wealth.
True False Cannot Say
Conclusion 2: The passage suggests that two-child families will dramatically increase, as sibling-free adults reach child-bearing age.
True False Cannot Say
Conclusion 3: The main criticism of China’s one-child policy is that it violates human rights.
True False Cannot Say
Conclusion 4: Families with more than one child are more common in China’s rural areas.
True False Cannot Say
Conclusion 5: The general preference among Chinese parents is for male babies.
True False Cannot Say
9) [Reproduced from https://www.assessmentday.co.uk/free/watson-glaser/freetest1/InterpretingInformation/Free-Critical-Thinking-Test-Interpreting-Information-Questions.pdf]
Assume that all the information provided in the following statement is accurate. Then judge for each of the potential conclusions following the statement whether that conclusion follows (i.e.. logically flows beyond a reasonable doubt) from the provided information or does not follow.
Statement: People with a master’s degree in business administration (MBA) earn an income on average 70% higher than people with just an undergraduate degree. MBA students from top business schools earn an income on average 50% higher than the average income of people with MBAs.
Conclusion 1: If a person obtains an MBA their income will increase.
Conclusion follows Conclusion does not follow
Conclusion 2: If a person obtains an MBA from a top business school, their income will be higher than that of the average MBA graduate.
Conclusion follows Conclusion does not follow
Conclusion 3: The average income of an MBA from a top business school is more than double that of the average income of a person holding only an undergraduate degree.
Conclusion follows Conclusion does not follow
IV. Interpreting visual information
The following questions present some data in visual or graphical form, from which you are asked either to draw quantitative conclusions or request additional data needed to inform any possible conclusions to be drawn.
10) [Reproduced from https://sharpbrains.com/blog/2007/06/15/brain-teaser-for-the-frontal-lobes-tipping-the-scales/]
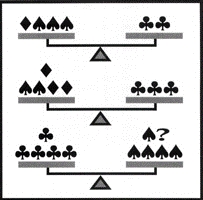
The top two scales in Fig. 4 are in perfect balance. How many diamonds will be needed to balance the bottom set?
11) [Adapted from http://www.econoclass.com/misleadingstats.html]
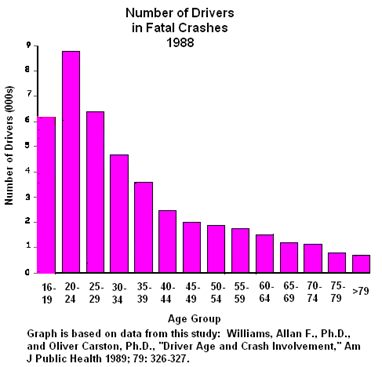
The graph in Fig. 5 appears to indicate that drivers in the 16-19 age group are significantly safer than drivers in their early 20s, and that driver safety increases steadily with increasing age above the 20s, all the way up to octogenarians. What additional information would you like to see to evaluate if that conclusion is merited based on the data?
12) [Based on data from a Forbes article]
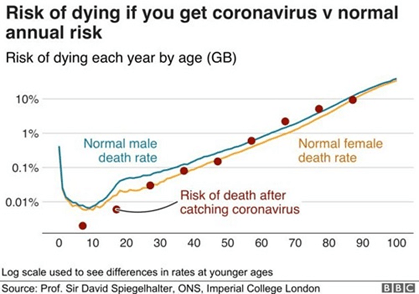
The graph in Fig. 6 appeared in a recent Forbes magazine article on mortality rates with COVID-19. The graph appears to suggest that the probability of dying from a COVID-19 infection is no worse than the chances of dying from any cause at a given age, at least in Great Britain, where the data were recorded. What questions might be raised about this interpretation?
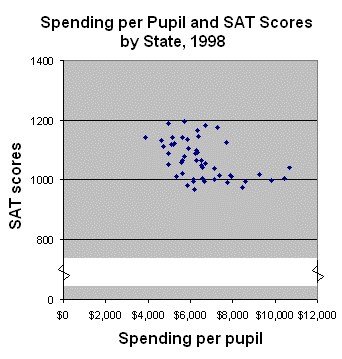
13) In a 1993 column in the Washington Post, George Will argued that high-school student SAT scores among different U.S. states were inversely correlated with the average spending per pupil on education, a conclusion that appears to be supported by data such as that shown (for 1998, rather than 1993) in Fig. 7. What additional information would you like to see to evaluate if that conclusion is merited based on the data?
14) [Based on a Business Insider article]
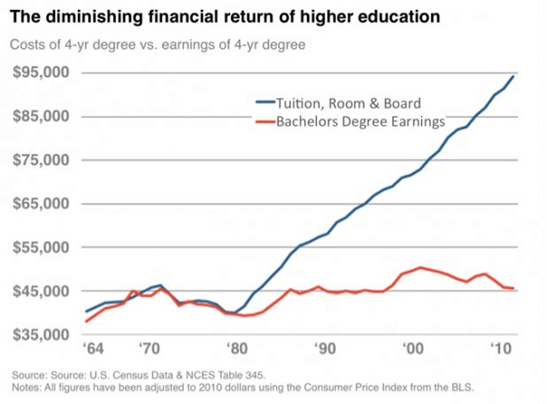
The graph in Fig. 8 was used in a Business Insider article to prove that “a college education just isn’t worth the money anymore.” The graph shows that costs of tuition, room and board have increased steadily since 1990, while average initial annual earnings of people with a bachelor’s degree have not. Both costs and earnings have been corrected for inflation in the figure. What questions would you raise to evaluate whether the author’s conclusion is justified?
V. Evaluating correlations
Similar trends in data for two distinct quantities may or may not be indicative of a causal relationship between the two quantities. The following questions ask you to consider what additional information you would want to see in order to evaluate whether the correlations shown are more than accidental.
15) [Adapted from http://www.tylervigen.com/spurious-correlations]
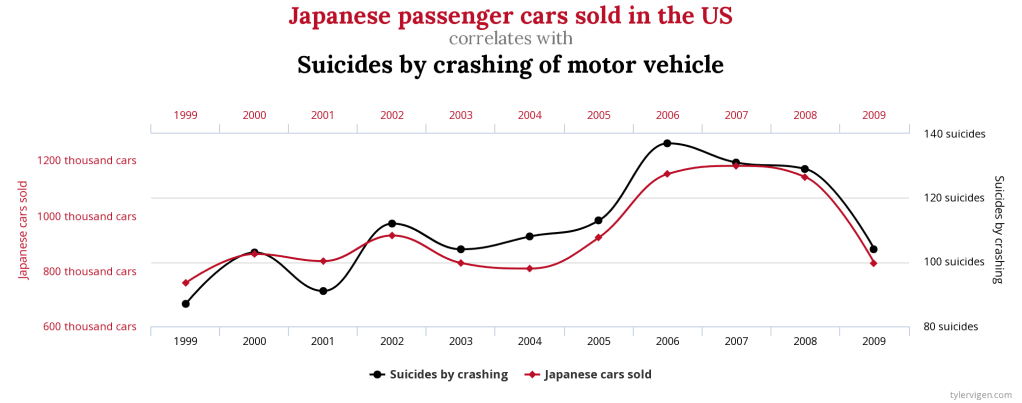
Tyler Vigen collects “spurious correlations” between measures of phenomena that don’t seem at all related. But in the example in Fig. 9, it is at least conceivable that a causal relationship might exist between Japanese car sales in the U.S. (statistics from U.S. Bureau of Transportation Statistics) and deaths reported by the CDC as U.S. suicides by crashing motor vehicles. For example, prior to about 2009, many new Japanese passenger car models had problematic airbags that might have contributed to single-passenger deaths via crashes. What additional data would you want to examine in order to evaluate whether the correlation in the graph is merely coincidental, or indicative of a causal relationship, or attributable to a third phenomenon that caused both trends?
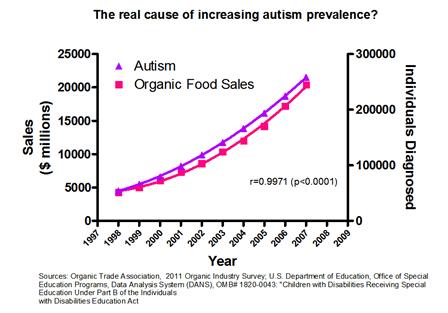
16) [Based on https://imgur.com/1WZ6h.]
The same basic question as in problem #15: What additional data would you want to examine in order to evaluate whether the apparent correlation in Fig. 10 between organic food sales and autism incidence is merely coincidental, or indicative of a causal relationship, or attributable to a third phenomenon that caused both trends?
VI. pattern recognition and inductive reasoning
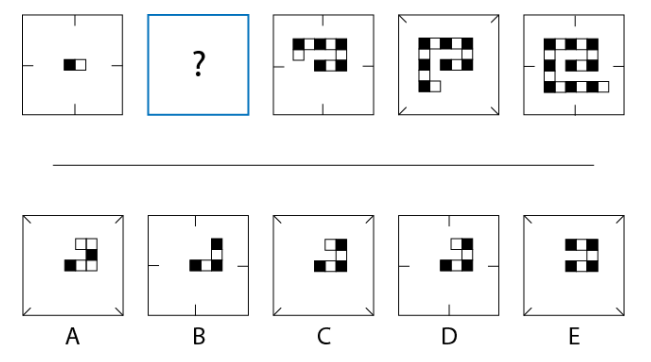
17) [Reproduced from https://www.assessmentday.co.uk/inductive/Free/InductiveTest2/Inductive-Reasoning-Test2-Questions.pdf]
Which one of the answers A-E should replace the question mark in the sequence of patterns shown in Fig. 11?
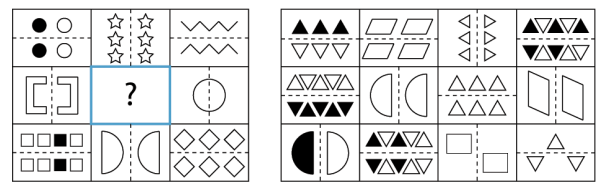
18) [Reproduced from https://www.assessmentday.co.uk/logic/free/LogicalReasoningTest2/LogicalReasoningTest2-Questions.pdf]
Which of the 12 arrangements of shapes in the right-hand grid of Fig. 12 fits logically in place of the question mark in the left-hand grid?
19) [Reproduced from https://sharpbrains.com/blog/2007/06/22/pattern-recognition-brain-teaser-the-empty-triangle/]
Which single-digit number should be placed inside the empty triangle in Fig. 13?
VII. algebraic reasoning
20) [Reproduced from https://www.jcu.edu.au/__data/assets/pdf_file/0019/390142/The-Golden-Apples.pdf]
A prince picked a basketful of golden apples in the enchanted orchard.
On his way home, he was stopped by a troll who guarded the orchard. The troll demanded payment of one-half of the apples, plus two more. The prince gave him the apples and set off again.
A little further on, a second troll guard stopped the prince and demanded payment of one-half of the apples the prince now had, plus two more. The prince paid the troll and set off again.
Just before leaving the enchanted orchard, a third troll stopped the prince and demanded one-half of his remaining apples plus two more. The prince paid him and returned home. He had only two golden apples left.
How many apples did the prince originally pick?
21) [Reproduced from https://sharpbrains.com/blog/2007/05/17/the-really-really-really-big-number/]
When you divide 12 by 5, the remainder is 2; it’s what’s left over after you have removed all the 5s from the 12. When you raise 4 to the fifth power (that is, 45), you multiply four by itself five times: 4x4x4x4x4, which equals 1,024.
What is the remainder when you divide 100100 by 11?
VIII. Order of magnitude estimation
The ability to make rough order-of-magnitude estimates for a wide variety of quantities, by breaking questions down into component aspects for which you have some everyday knowledge or analogies, is extremely helpful in judging whether quantitative claims are qualitatively plausible. In the world of physicists, problems requiring such rough estimation are known as Fermi questions. Here are some Fermi questions
22) [Adapted from https://sharpbrains.com/blog/2006/09/29/brain-exercise-games-frontal-and-parietal-lobes/]
Make rough estimates to address the following questions, without looking up relevant data:
a) How many golf balls can fit in a school bus?
b) What is the weight of a large (e.g., Boeing 767) commercial airplane?
c) How much heavier (i.e., by what factor) is a full-grown elephant than a full-grown mouse?
23) [Adapted from www.callingbullshit.org]
On Dec. 27, 2016 Fox News ran a story claiming that food stamp fraud in the U.S. was so large that the food stamp (SNAP) program should be ended. Their story had the following excerpt:
“Food stamp fraud is at an all-time high, with cases this year including a state lawmaker and even a millionaire. According to the USDA, $70 million of taxpayer money was wasted in 2016 due to food stamp fraud.”
Estimate what fraction that allegedly wasted amount represents of the total annual expenditure of the U.S. government on food stamps. Use your estimate to judge the strength of the argument for ending the SNAP program.
IX. identifying flawed probability arguments
A good deal of disinformation is based on flawed probability arguments. The following three questions ask you to identify the flaws in simple probability estimates. In both cases, the actual probabilities can be calculated quantitatively assuming randomness of the various possibilities.
24) In a gathering of 366 unrelated strangers, there is 100% probability that two or more of them share the same birthday (month and day of the month). What is wrong with the following flawed conclusion?: Therefore, in a gathering of 37 unrelated strangers, or 10% of the previous total, the probability that two or more of them share the same birthday is about 10%.
25) [Adapted from https://www.lexjansen.com/phuse/2012/sp/SP02.pdf]
Deal or No Deal? You are on a game show, and you are given the choice of three closed doors: Behind one door is a car; behind the others, goats.
You pick a door, say No. 1 [but the door is not opened], and the host, who knows what is behind every door, opens another door, say No. 3, which has a goat. He then asks you, “Do you want to switch your choice from door No. 1 to No. 2?”
What is wrong with the following flawed conclusion?: You now have a 50% probability of having guessed right in the first place, so switching your selection would not improve your odds of winning the car. [Hint: think about the host’s options for the various possible locations of the car.]
26) [Adapted from https://en.wikipedia.org/wiki/Prosecutor%27s_fallacy]
A crime-scene DNA sample is compared against a database of 20,000 men. One match is found, and the corresponding man is accused of the crime. At his trial, an expert witness on DNA profiling tells the jury that the probability of a false positive match by chance is only one in 10,000.
What is wrong with the following flawed conclusion?: The prosecutor then tells the jury in his summation that they must convict the man, despite the absence of other incriminating evidence, because the probability that the defendant is innocent of the crime is only one in 10,000, which is beyond a reasonable doubt.
X. distinguishing random from non-random patterns
Belief in false and fraudulent conspiracy theories is often triggered by a tendency to imagine patterns among random facts and data, i.e., to connect random dots. The following questions ask you to select the one among various patterns that has the highest probability of being based on a non-random algorithm. Distinguishing actual non-randomness is aided by an ability to evaluate or estimate probabilities of apparent aggregate patterns in the data.
27) Which one of the following sequences of 54 successive coin flip results (H=heads, T=tails) is non-random, and why? The random tosses are generated from the website www.random.org/coins.
a) HTTTTHHTTTTTTTTHHHHHTTTTTTTHTTTTHHTTTTTTTTHHHHHTTTTTTT
b) HHHTHHTHTHHTHHTTHTTHTHTHTTHHTTTHHTTHTTHHHTHTHTTTHHHHT
c) TTHHTTTHTHHHHTHTHHTTTTTTHHHHTHHHHTHHTHHHTTHHTHTTHTHHHT
d) TTHHTHTTTTTHHTTTHHTHHHTTTHHHHHHTHHHTHTHHTTHTTHHTHTTTTH
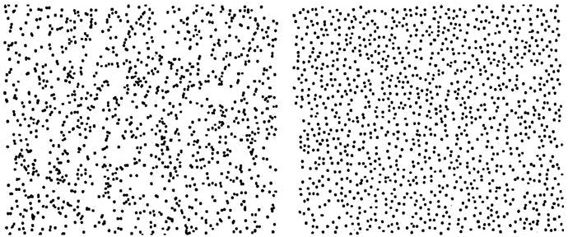
28) Which one of the two “star maps” in Fig. 14 (taken from Steven Pinker’s The Better Angels of our Nature) is random, and why? The non-random map is based on a naturally occurring phenomenon.
29) [Adapted from https://understandinguncertainty.org/node/1066]
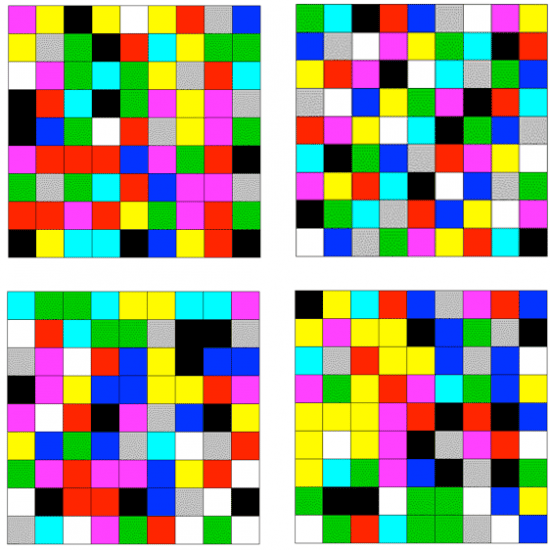
Figure 15 shows four 9×9 grids of colored squares, in which the color of each square is chosen from among 9 possibilities. In three of the four grids, the choice of colors for each square is chosen by a random number generator, while the fourth grid uses a non-random algorithm to choose the colors. Which of the four grids has the non-random color choices, and why?
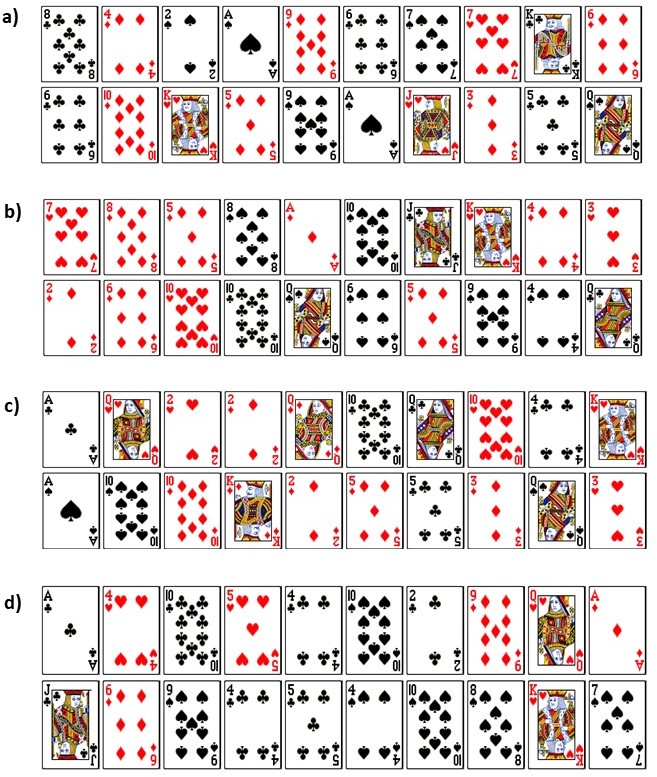
30) Figure 16 displays four distinct sequences of 20 playing cards apiece, drawn from two shuffled 52-card decks (with no jokers included). In three of the four cases, the draw was done randomly with the aid of www.random.org. Which of the four sequences is non-random, and why?
— Answers in Part II —
