
April 28, 2023
I. introduction
Our blog Debunking Denial debuted in June 2017. At the time, it was motivated by several developments that demonstrated the actions and motives of those who were involved in science denial. One of the most alarming developments was the election of Donald Trump and the strongly anti-science views of several of his Cabinet appointees. A second significant development was the mailing of the Heartland Institute’s booklet Why Scientists Disagree About Global Warming. That booklet was mailed in 2017 to every K-12 science teacher in the U.S. It was a ‘textbook example’ of science denial tactics, and we published a critique of that booklet in an August, 2017 post on our blog. That booklet “aimed to indoctrinate a generation of young students in the elements of denialism concerning any scientific research used to support government regulation threatening their extreme free-market political philosophy.”
The Heartland Institute is one of several organizations that have been established and funded by a relatively small number of corporations and wealthy individuals. They are known as “astroturf” institutes, since they masquerade as independent scientific research organizations falsely representing grassroots, but their real mission is to cast doubt on the scientific consensus on various issues. Such organizations were initially created in the 1950s to sow doubt about the harmful effects of cigarette smoking. They have since attempted to create doubt on threats posed by acid rain and ozone depletion, criticized the Endangered Species Act, and lobbied against an increased federal role in health care. An excellent study of these groups and their tactics was the 2011 book Merchants of Doubt by Naomi Oreskes and Erik Conway.
An interesting case is that of the role of chlorofluorocarbons (CFCs), used in aerosols, coolants, and other products, in depleting the ozone layer. In 1974, researchers Sherill Rowland and Mario Molina suggested that CFCs had the potential to seriously deplete and perhaps to destroy the ozone layer in the stratosphere. The ozone layer prevented harmful UV-B sunlight from reaching the Earth; if the ozone layer was weakened, the number of skin cancers to humans and animals would increase drastically, and UV-B rays would also harm the environment. At the time Rowland and Molina made their argument, it was very difficult to measure the effect of CFCs on the ozone layer. Corporations involved in creating CFCs argued that the science was too uncertain to justify banning these chemicals. The Heartland Institute was particularly outspoken in criticizing the state of knowledge regarding CFCs and the ozone layer. Furthermore, they claimed that a ban on CFCs would devastate major industries, and that any alternative products would be incredibly expensive and would be unable to produce the same results as CFCs.
However, research on CFCs soon showed that these chemicals indeed destroyed ozone in the stratosphere. Rowland and Molina won the Nobel Prize in chemistry for their research. In 1987 the Montreal Protocol, an international treaty designed to protect the ozone layer by ceasing production of substances that cause ozone depletion, was signed. This Protocol has been adopted by every nation on the planet, and was strongly supported by DuPont, the major manufacturer of CFCs. NASA now maintains an Ozone Watch Website, where one can view the exquisite precision with which the ozone layer can be measured. And, contrary to the claims of the ozone-depletion-denial lobby, new chemicals have been discovered that can produce very similar industrial effects as the CFCs with far less impact on the ozone layer. It is now universally agreed that CFCs were harming the ozone layer, and that continued production of these chemicals would have had devastating consequences for human health and the environment. Ozone concentrations in the stratosphere are on a path to return to levels last seen in the middle of the 20th century.
However, the Heartland Institute still maintains that CFCs were not harming the ozone layer. They criticize the scientific research that demonstrated the harm to the ozone layer; and they claim that the Montreal Protocol was the result of a hysterical over-reaction by the scientific community. They even continue to repeat claims that replacement of CFCs would be incredibly expensive and that replacement chemicals would not work as well as the CFCs; these arguments have long since been shown to be false. The Heartland Institute appears to be “protecting” an industry that moved on decades ago.
The Heartland Institute is up to their old tricks. In fall 2022 they issued a new publication, Climate at a Glance (see Fig. I.1). It contains what it advertises as “Facts on 30 Prominent Climate Topics,” and is authored by Anthony Watts and James Taylor. They state that their aim is to provide teachers with “the data to show the Earth is not experiencing a climate crisis.” While their 2017 booklet Why Scientists Disagree on Global Warming was mailed to over 200,000 teachers across the U.S., the 2022 booklet was mailed to only 8,000 middle and high school teachers.
The Heartland Institute’s science-denial activities have been widely panned by legitimate climate scientists. Glenn Branch, the deputy director of the Center for Science Education, stated that a number of teachers had used the Heartland Institute materials in their classrooms to inform their students about propaganda techniques. Branch believes that the fact that the 2022 booklet was scaled back from the 2017 mailing reveals that even Heartland realizes that they are pursuing a failing strategy. Robert Brulle, a visiting professor of sociology at Brown University, called the booklet “A misleading interpretation of scientific facts and questionable inferences drawn from cherry picked data from unreliable sources. It almost seems quaint that they’re still running with this. It’s like ‘The 1990s called. They want their scientific misinformation back.’” And Illinois science teacher Jeffrey Grant stated “It is very sad, to say the least. I am hoping to use some of their graphs to show my students how not to put together data in support of your scientific explanation.”
Agence France-Presse (AFP) is a non-partisan organization that fact-checks various claims. This February, they fact-checked the Heartland Institute’s 2022 booklet. They checked statements made about topics such as global crop yields, climate and snow-pack levels, the health of coral reefs, rising sea levels, the frequency and severity of hurricanes, heatwaves and drought in the U.S., and the frequency and severity of wildfires. They interviewed climate scientists, staff at the UN Food and Agriculture Organization, and reports from the Intergovernmental Panel on Climate Change (IPCC). AFP criticized many of the claims from the Climate at a Glance booklet.
The IPCC regularly issues reports on the status of global climate change. They also publish summary reports for policymakers; the 2022 summary report can be found here. These reports provide extensively detailed summaries of the current dimensions of global climate change. They are a result of contributions from 2,000 climate scientists from around the world. The IPCC reports summarize the observed impacts from climate change and risks in the near, mid and long-term. They also summarize efforts to mitigate the effects of climate change, and they discuss progress in developing climate resilience. The IPCC reports provide updates on all of these aspects of climate change; in addition, they provide a confidence level for each of their statements regarding climate change.
A summary of IPCC projections is shown in Figure I.2; it is from the 2022 IPCC Summary Report for Policymakers. As can be seen, part (a) of this figure summarizes a number of the threats from global climate change; it assigns a level of confidence for each threat; and it divides climate impacts into three groups – adverse impacts; adverse and positive impacts; and climate-driven impacts observed, no global assessment of impact direction. The widespread impacts are broken down to four general categories – water availability and food production; health and well-being; cities, settlements and infrastructure; and biodiversity and ecosystems.
Part (b) of this figure summarizes the impacts that are driven by changes in multiple physical climate conditions. These are divided into categories depending on the degree to which the attribution of these changes can be assigned to human influences. The categories include “medium confidence,” “likely,” “very likely,” and “virtually certain.” And part (c) of this summary figure shows how choices made now and in the near future will determine the degree to which current generations will experience a hotter and different world.

The IPCC reports represent the ‘gold standard’ for global climate issues. They represent the work of roughly 2,000 climate scientists, and for each climate condition the IPCC issues an updated report every four years. The confidence attached to each condition is regularly updated, and each IPCC report is based on hundreds of peer-reviewed research papers. In addition, the IPCC oversees the research done by a number of groups that use climate models to simulate the oceans and the atmosphere, and the interactions between them. Climate models are also expanded on a regular basis, and groups compare their results both to climate data and to each other. The IPCC reports show that global climate change is an existential issue for our planet, and they also demonstrate that physical conditions (increasing temperatures, drought, flooding, wildfires, infectious diseases, climate refugees, etc.) are strongly influenced by human actions.
While modeling is needed to project the future and to treat the various impacts of global warming, it is important to stress that the attribution of global warming to human activities – an issue to which the new Heartland booklet pays little attention — is essentially independent of complicated climate models. As we have stressed previously in our review of Steven Koonin’s book Unsettled?, a compelling case for the human role was highlighted by the demonstration in Fig. I.3 from the Berkeley Earth project, showing that the increases over the past two centuries in global mean temperatures very closely track the independently measured increases in atmospheric concentrations of carbon dioxide (CO2) and other greenhouse gases, which trap infrared radiation emitted by the Earth. And those greenhouse gas increases follow the increased emissions from human burning of fossil fuels. While different climate models predict different rates of future global temperature increases, Berkeley Earth’s simple extrapolation (Fig. I.4) of the correlation between CO2 concentrations and global temperature suggests that continuing on the current fossil fuel path will likely lead to a temperature increase of more than 2°C over preindustrial levels by the middle of this century.


In marked contrast to the work of the IPCC and the Berkeley Earth project, the Heartland Institute’s work is not science and is worthless as a resource for global climate. It is, however, an excellent case study of techniques in science denial. Examples of science denial that appear in the Heartland Institute’s booklets include: cherry-picking of data, regions and time periods to obscure global effects; the use of discredited data or outlier data sets; misinterpretation of results; ‘plotsmanship’ tricks to obscure scientific facts; omission of references to earlier, compelling debunking of their claims; and the use of ‘strawmen’ to mislead the reader. In the remaining sections of our post, we will provide detailed examples of these techniques, while we provide more accurate summaries of a number of the issues raised in the booklet Climate at a Glance.
In marked contrast to the work of the IPCC and the Berkeley Earth project, the Heartland Institute’s work is not science and is worthless as a resource for global climate. It is, however, an excellent case study of techniques in science denial.
II. global warming in the U.S. and across the planet
The authors of Climate at a Glance seem to acknowledge that there has been some warming of the planet and that “humans are causing some degree” of that warming. But their booklet is intended to convince some teachers and students that there really is no cause at all for concern. They do this by using standard techniques of science denial we mentioned in Sect. I. We illustrate these techniques in addressing, and correcting, a number of their specific claims in the following subsections. One technique we won’t even bother addressing here is the skewering of strawmen, exemplified by the following of their statements (with our addition of boldface): “Objective data show global warming has not caused an increase in the frequency or severity of cold weather events.” Well, duh!
A. Are Weather Stations Overestimating the Degree of Warming?
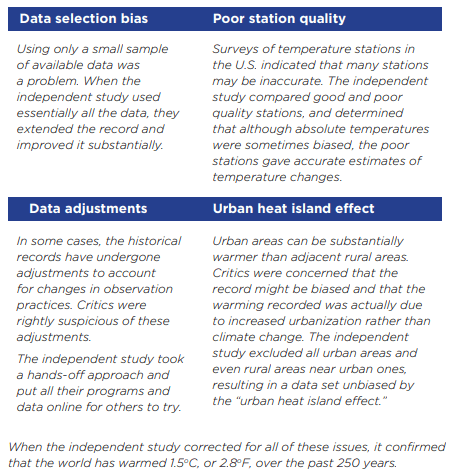
The Heartland authors attempt to discredit U.S. temperature records by claiming: “corrupted temperature stations compose a majority of the stations used to report official U.S. temperature data.” Specifically, they claim that “temperature stations that have not been corrupted by the urban heat island effect report significantly less warming than temperature stations corrupted by urban heat island impacts.” Both of these claims have been extensively studied for the entire globe by the Berkeley Earth project, to which the Heartland booklet does not even bother to refer.
The Berkeley Earth study began in 2010 as a collaboration between University of California, Berkeley physicist Richard Muller and his daughter Elizabeth Muller. Richard Muller himself began the project with significant skepticism about the robustness of land temperature recordings. He and his daughter decided to reanalyze the Earth’s surface temperature record with more inclusive data, sophisticated statistical methods, and simplified analysis procedures. According to their website: “Berkeley Earth systematically addressed the five major concerns that global warming skeptics [including Heartland author Anthony Watts] had identified, and did so in a systematic and objective manner. The first four were potential biases from data selection, data adjustment, poor station quality, and the urban heat island effect…The fifth concern related to the over reliance on large and complex global climate models by the Intergovernmental Panel on Climate Change (IPCC) in the attribution of the recent temperature increase to anthropogenic forcings.”
Berkeley Earth’s methods allowed them to extract meaningful measurements from many more temperature stations and over longer time periods than previous analyses, and this in turn allowed them to analyze temperature trends when certain temperature stations were systematically omitted from the samples. Their results addressing the first four of the concerns listed above are described in Fig. II.1. Their conclusion regarding the fifth concern about model-dependence was already addressed in the model-independent Fig. I.3. Their resulting global temperature trend, plotting the global temperature anomaly, relative to the average value from 1981 – 2010, in oC, from 1850 to 2018 is shown in Fig. II.2. The Berkeley Earth results in Fig. II.2 are shown as the thick black line, with a shaded band representing the 95% confidence level of their results. Their results are compared in the figure to the results of five different analyses of the global temperature anomaly. The results from different analyses indeed track each other very closely, with deviations (especially during the 19th century) typically on the order of only a tenth of a degree Celsius.
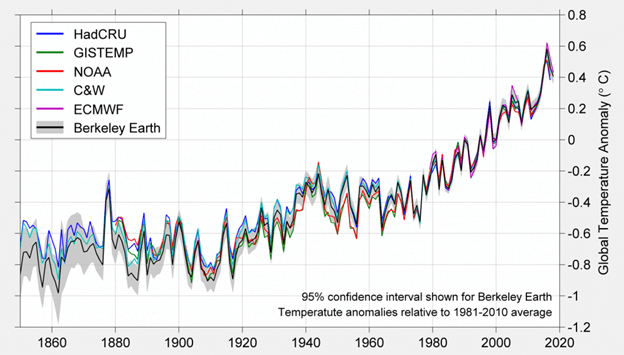
Earlier estimates by the Berkeley Earth collaboration included only results from land-based stations. In more recent years, the Berkeley Earth analyses included reinterpolated results from the HADSST4 ocean temperature field. The Berkeley Earth measurements essentially reproduced the results from earlier analyses. They showed a rapid increase in the global temperature anomaly that began in about 1970, and that has continued up to the present.
As part of their investigation, the Berkeley Earth group reviewed the effect of two specific phenomena highlighted in the new Heartland booklet. First, NOAA has developed a ranking system for land temperature record sites used to measure temperatures in the United States. The system, called the Climate Reference Network (CRN) classification, ranks all sensors on a scale of 1 to 5. The CRN classification rates temperature stations depending upon physical attributes of the station and the location of the sensors. For example, stations given the CRN1 classification must satisfy a number of criteria. They must have sensors located at least 100 meters from artificial heating or reflecting surfaces; in addition, the sensors must be located far from large bodies of water, and then located at least 100 meters away. By comparison, a station rated CRN4 will have artificial heating sources within 10 meters, and CRN5 stations will have a temperature sensor located next to or above an artificial heating source, such as a building, roof top, parking lot, or concrete surface.
Heartland author Anthony Watts and collaborators previously pointed out that some 70% of the USHCN (U.S. Historical Climatology Network) temperature stations were rated CRN4 or CRN5. Since the CRN4 stations were expected to have an estimated error of ≥ 2 oC and the CRN5 stations had an estimated error of ≥ 5 oC, Watts claimed that use of the poor-quality temperature stations had likely resulted in a seriously overestimated temperature increase in the contiguous U.S.
The Berkeley Earth group undertook a more rigorous statistical analysis of the temperature reconstruction, and they obtained the following result. “The Berkeley Earth analysis method indicates that the difference in temperature change rate between Poor (CRN quality groups 4, 5) and OK (quality groups 1, 2, 3) stations is not statistically significant at the 95% confidence level.” The Berkeley Earth group concluded: “Our conclusions agree with earlier work, in that we do not observe a significant bias in average temperature trends arising from station quality in the contiguous United States.” Note their emphasis on temperature changes; some weather stations may report higher or lower absolute temperatures than others, but there is broad agreement on the temperature anomalies over the years.
The Heartland Institute booklet does not mention that the Berkeley Earth group refuted their claim that the use of poor-quality measuring stations predicted much higher temperature changes than were actually occurring. The Berkeley Earth results were published in 2013, nine years before the publication of the Heartland Institute booklet making these claims. And the Berkeley Earth study was carried out in part to test the claims made by Anthony Watts, the co-author of the Heartland Institute booklet, in 2009. This is classic scientific denial – Heartland, and Watts in particular, continue to make the same old claims even after compelling new evidence refutes those claims.
The second issue is the degree to which “urban heat islands” are skewing the results for temperature changes in the U.S. The Heartland Institute booklet claims that “When only non-urban temperature stations are used, warming trends are still present in the data, depending on the period examined, but they are minimal and not at all alarming.” The Berkeley Earth group also studied the effect of “urban heat islands” on the extraction of temperature changes in the U.S. They reported the following results. “Time series of the Earth’s average land temperature are estimated using the Berkeley Earth methodology applied to the full dataset and the rural subset; the difference of these is consistent with no urban heating effect over the period 1950 to 2010, with a slope of -0.10 ± 0.24/100 yr (95% confidence).” Regarding the claim that urban heat islands cause an overestimate of temperature increases in the contiguous U.S., Berkeley Earth concluded “We observe the opposite of an urban heating effect over the period 1950 to 2010, with a slope of -0.10 ± 0.24°C/100yr (2σ error) in the Berkeley Earth global land temperature average. The confidence interval is consistent with a zero urban heating effect, and at most a small urban heating effect (less than 0.14°C/100yr, with 95% confidence) on the scale of the observed warming (1.9 ± 0.1°C/100 yr since 1950 in the land average).”
Once again, the Heartland Institute makes no mention of the Berkeley Earth study that subjected the claim of urban heat island effects to a rigorous statistical analysis. The Berkeley Earth results completely contradict the Heartland Institute claims that urban heat islands have resulted in a significant overestimate of temperature increases in the U.S.
B. Temperature Trends in the U.S. and Globally
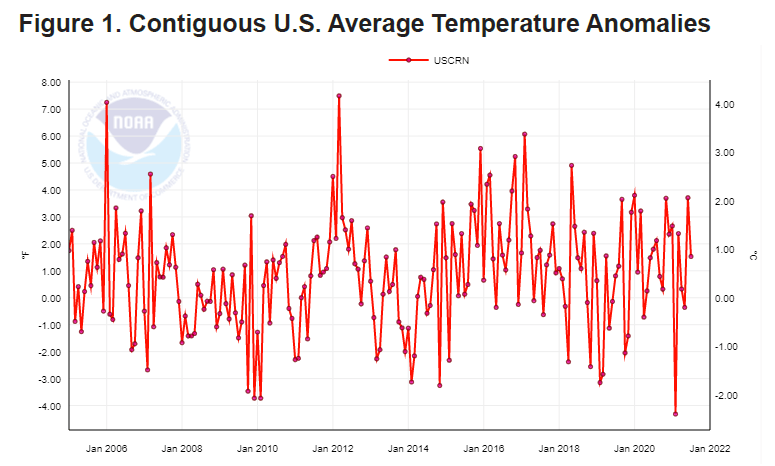
Another claim in the Heartland booklet is that “The United States has experienced no significant warming since 2005.” To support that claim the authors refer to Fig. II.3 below, showing NOAA temperature anomalies in the contiguous 48 states by month from 2005 through 2021. When you are shown a graph like this for a specific region and a specific set of years, there is a good chance someone is trying to pull the wool over your eyes. Global warming is a global problem; it is unique over the past two millennia in what authors have characterized as its “torrid global synchrony” – all parts of the globe are warming simultaneously. To see the effect clearly, it is helpful to minimize the impact of year-by-year and month-by-month temperature fluctuations around an overall trend. The current extent of global warming is an increase in the global mean surface temperature by about 0.2°C per decade. In the global annual mean temperature records (see Fig. I.3), we typically see roughly ±0.2°C annual fluctuations, arising from el niño and la niña shifts in ocean circulation currents and temporary weather pattern changes. When you focus on a single country, the fluctuations are larger, and they grow larger still when you consider fluctuations on a monthly basis. The month-by-month fluctuations seen in Fig. II.3 exceed ±1°C. They are large enough to obscure any overall trend.
For comparison, consider the same NOAA database, but now plotted in Fig. II.4 for the mean annual temperature anomalies in the 48 contiguous states over a much longer time period. In that plot, the warming over the past five decades is seen much more clearly. The year-to-year temperature fluctuations are still sizable, but not so large as to obscure the warming trend. Figure II.5 shows analogous NOAA data for the global annual mean surface temperature anomalies. Those data show the same basic warming trend as seen for the U.S. in Fig. II.4, but now with substantially smaller year-to-year fluctuations. The U.S. trend is basically the same, within fluctuations, as the global trend, in contrast to Heartland’s claim.


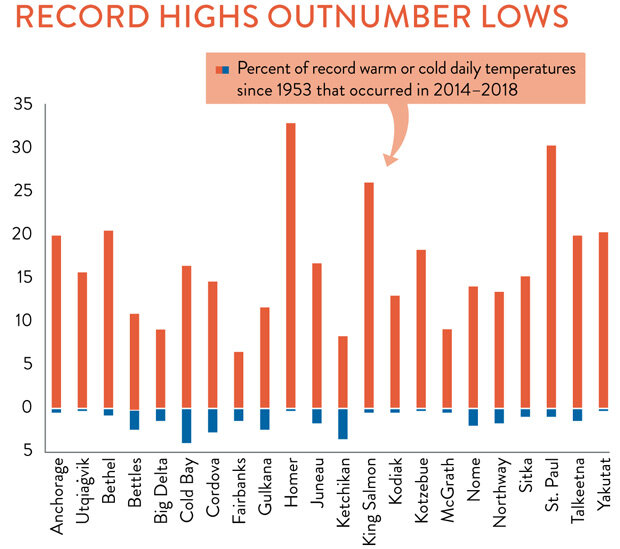
Furthermore, the 48 contiguous states hardly constitute the entire U.S. Mean temperatures have been rising significantly more rapidly at higher latitudes. So, if Alaska were included, the U.S. trend would be even clearer. Figure II.6 shows the percentage of all daily record high and record low temperatures across the state of Alaska since 1953 that occurred within the years 2014-2018. Averaged across the state, some 15-20% of daily highs occurred during the most recent 6% of the total time span, while only about 2% of the daily lows occurred during that same period. This clearly shows a strong warming trend in Alaska.
Our conclusion: Heartland cherry-picks data, region, and time period, and uses plotsmanship to obscure a very clear global warming trend that affects the U.S. as well as the rest of the globe. The global trend is compared to that for Europe in Fig. II.7 (data from the European Environment Agency), showing that Europe is experiencing somewhat faster warming than the global average. Again, note that Europe is, on average, at higher latitude than the contiguous U.S. states.

C. Climate Disaster Frequency
After their claim that the US has seen no significant warming, the Heartland authors use that alleged, though incorrect, fact to assert the following: “Thus, when climate activists have claimed in recent years that warming has caused various U.S. environmental problems, it’s not possible their assessments are accurate, unless it can be shown the U.S. Climate Reference Network data is wrong…”. Even if their claim that U.S. land surfaces hadn’t warmed recently were correct, the latter excerpt displays a (possibly willful) lack of understanding of the impact of global climate on water and air temperatures and flow around the globe. In particular, warming ocean temperatures significantly impact the severity of storms that form and follow paths over the oceans.
We will deal in Sect. III.B with the specific warming trends observed in the mid-Atlantic Ocean and the Gulf of Mexico, and with their impacts on hurricane severity in the U.S. and elsewhere. More generally, the new Heartland booklet claims, in contrast to most analyses, that “…the number of climate-related disasters, as well as the number of victims from those disasters, has been declining over the past hundred years…”. To support that claim they use Fig. II.8 from a report of the United Nations Office for Disaster Risk Reduction. The data in Fig. II.8 come from the U.N. emergency database (EM-DAT).
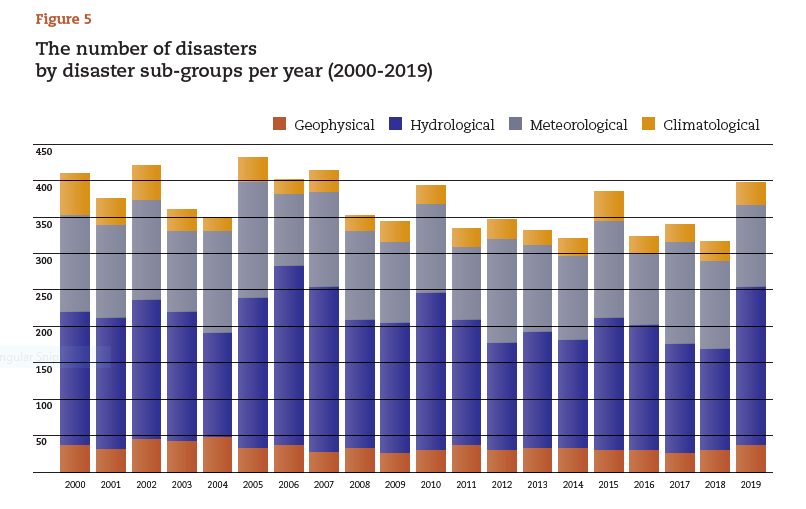
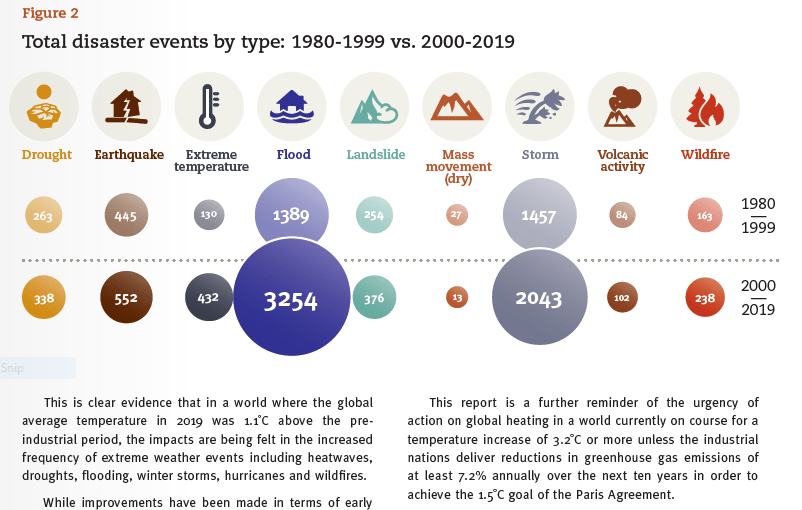
First, note that this Fig. II.8 covers only 20 years, not a hundred years, as claimed in the text. More importantly, the Heartland authors cherry-pick which data from that same U.N. report to include as supporting evidence for their claim. They fail to acknowledge that report’s data shown in Fig. II.9. Note the text we’ve included from the U.N. report at the bottom of Fig. II.9: “This is clear evidence that in a world where the global average temperature in 2019 was 1.1°C above the pre-industrial period, the impacts are being felt in the increased frequency of extreme weather events including heatwaves, droughts, flooding, winter storms, hurricanes, and wild fires.” The data in Fig. II.9 show that from the 20 years preceding the turn of this century to the 20 years just after: flood disasters increased by a factor of 2.3; extreme temperature events by a factor of 3.3; and storm disasters by a factor of 1.4. Obviously, none of that supports the Heartland claim that climate disasters have declined in frequency over the past hundred years.
It would be nice to understand why Fig. II.8 looks so different from the disaster frequency chart in Fig. II.10, which we have used in our own previous blog posts. The data in Fig. II.10 are obtained from the natural catastrophe service of the world’s largest reinsurance company Munich RE. Figure II.10 clearly shows a rapid increase from 1980 to 2018 in climate-related disasters. Over the common annual range from 2000 to 2018, the Munich RE plot includes significantly more worldwide disasters than the EM-DAT plot in Fig. II.8. This difference can be traced to differences in criteria for including events. Munich RE includes all events that caused: “…at least one fatality and/or produced normalized losses of US$100K, $300K, $1m, or $3m (depending on the assigned World Bank income group of the affected country).” So, they consider one or more fatalities or substantial financial damages. It makes sense that a reinsurance company would be interested in financial damages as well as the loss of life.

EM-DAT uses the following criteria for including disasters: 10 or more deaths, and/or 100 or more people affected/injured/homeless, and/or declaration of a state of emergency and/or appeal for international assistance. So, there is no financial damage consideration and the impact on people has to be significantly greater than that considered by Munich RE. For example, a fire that destroys 30 houses, with an average of three inhabitants per house, and worth an average of $400,000 apiece, would not qualify as a disaster for EM-DAT if fewer than ten people lose their lives, but certainly would for Munich RE. As early warnings and evacuation protocols for storms, floods, and fires have improved over the years, severe events are less frequently causing large numbers of dead or injured, but they are still causing significant financial damages. Thus, if one compares the total number of disasters per year in Fig. II.8 vs. Fig. II.10, the discrepancy between the two sets of criteria grows steadily as time goes on, reaching a factor Munich RE/EM-DAT greater than 2.5 by 2018.
But no matter which database and inclusion criteria one uses, Figs. II.9 and II.10 demonstrate that there is no support for the Heartland claim that “…the number of climate-related disasters, as well as the number of victims from those disasters, has been declining over the past hundred years…”. The Heartland authors cherry-pick data even from their preferred source and further misrepresent the implications of the data to make their misleading claim.
D. Regional Precipitation and Drought Anomalies
Even inland droughts and floods are sensitive to the changing conditions of oceans and the atmosphere. But in these cases, potential impacts are typically localized in time and in space. Regional impacts across the globe are illustrated in Fig. II.11, a NASA visualization of a 2021 snapshot of the amount of water stored in soils, aquifers, lakes, rivers, snow cover, and ice, as determined from precise satellite measurements of Earth’s gravity field and related to conditions during the period 1948-2012. The dark brown areas in the map are suffering severe droughts, while the dark blue areas are seeing unusually high water levels.

The regional nature of these changes reduces the usefulness of such Heartland claims as the following two, seemingly self-contradictory, statements: “The United States has benefited from additional precipitation and a reduction in drought conditions as the climate has modestly warmed;” and “it is just as likely that climate change is making floods less frequent and less severe as it is more frequent and more severe.” And as for making floods less frequent and less severe, look again at Fig. II.9, which the Heartland booklet omits.
As NASA explains: “Current climate models indicate that rising temperatures will intensify the Earth’s water cycle, increasing evaporation. Increased evaporation [from warmer oceans] will result in more frequent and intense storms, but will also contribute to drying over some land areas. As a result, storm-affected areas are likely to experience increases in precipitation and increased risk of flooding, while areas located far away from storm tracks are likely to experience less precipitation and increased risk of drought.”
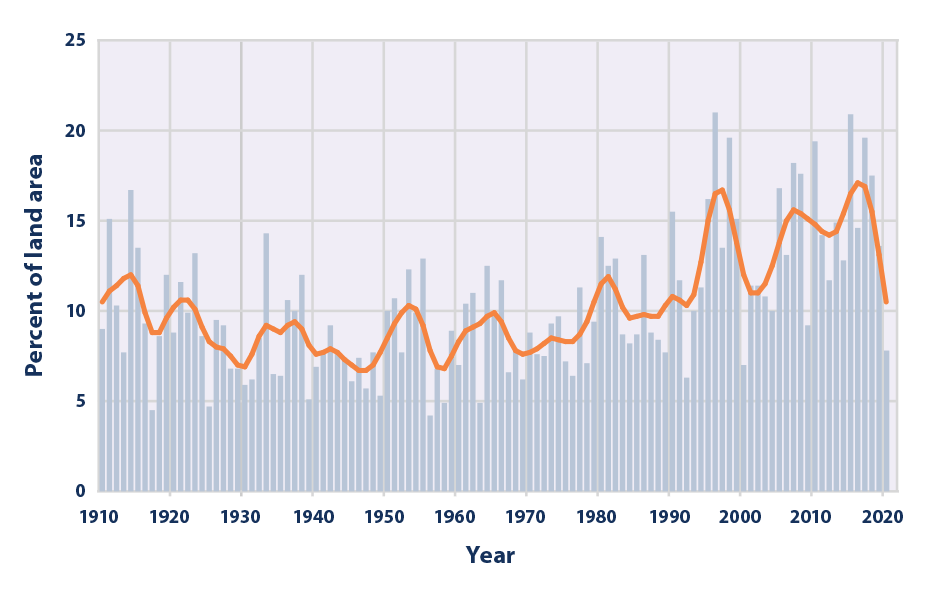
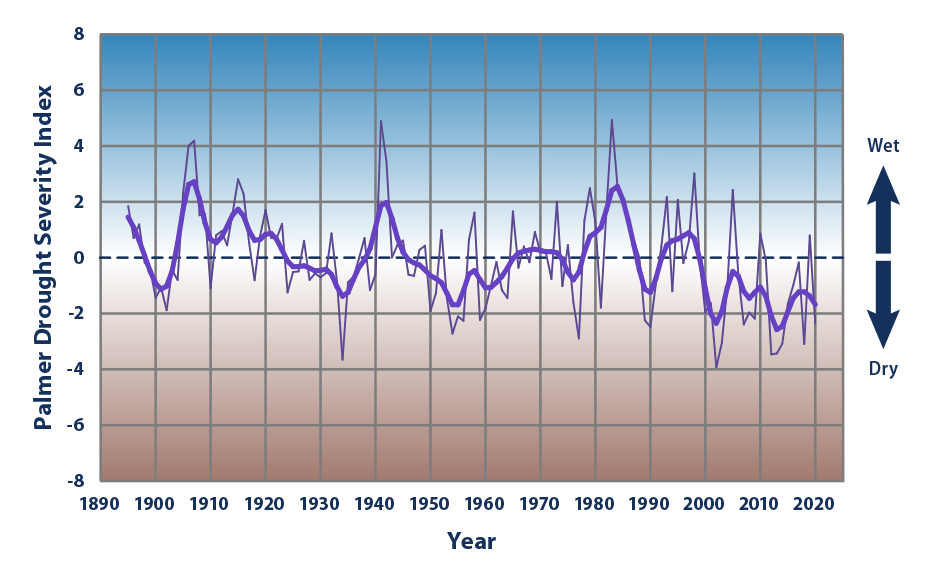
Indeed, NOAA data in Fig. II.12 from the 48 contiguous U.S. states show that global warming has been accompanied by a gradual increase in the percent of land area experiencing extreme single-day precipitation events, the type of events that lead to inland flooding. At the same time, the American Southwest has experienced more severe than normal drought conditions during this century (Fig. II.13), as inhabitants of the southwest would certainly attest. In both cases, there are significant year-to-year fluctuations and the data to date only hint at the possibility of growing trends. But it would be a mistake to conclude that there is no cause for concern from climate-change-induced inland floods and droughts.
E. U.S. Wildfire Trends
Increased regional drought conditions in forested areas enhance the likelihood of wildfires, of the type seen in recent severe events in California and Australia. But the issue of wildfires leads to one of the Heartland booklet’s most egregious claims, namely, that the U.S. government has been hiding data from the early 20th century on wildfires. To support this claim, they use Fig. II.14, showing on the right the official data on wildfire acres burned in the U.S. since 1983 from the National Interagency Fire Center (NIFC), and on the left what Heartland claims is the “real” pre-1983 data omitted by the NIFC to delude the public. But the Heartland writing team know well that the reason the data before 1983 were omitted is because they were unreliable, as we have added in an annotation on the figure.

As has already been pointed out by PolitiFact in 2021, “Most of the area burned during this [earlier] period was in the Southeastern United States and were primarily incendiary fires,” where incendiary means those fires were set intentionally to clear forests or agricultural lands. But the U.S. Forest Service, which was trying to reduce all fires, considered them akin to wildfires. They were clearly not the same as the uncontrolled wildfires we have seen recently in forest fires in western states. Furthermore, since different U.S. agencies kept their own records of fires, there was also often double- or triple-counting of fires before uniform reporting and identification was introduced by NIFC in 1983.
When PolitiFact queried H. Sterling Burnett, the editor of the Heartland booklet, about the clear unreliability of the early 20th century data, Burnett responded “You can only go with the data you have.” In other words, data known to be faulty are still useful if they support your science denial. In Steven Koonin’s book Unsettled? he proposed a somewhat similar “alternative” headline in his opening chapter: “the global areas burned by fires each year has declined by 25% since observations began in 1998.” As we have pointed out in our review, that alternative headline was highly misleading for the same basic reason as the Heartland claim. Our rebuttal was (and still is): “the global decrease is strongly driven by decreases in the intentional fires set to remove flammable vegetation for agricultural clearing, especially in tropical areas, as opposed to the uncontrolled climate-related wildfires that have increasingly devastated parts of Australia, California and Canada, for example, in recent years.”
— Continued in Part II —
