
April 28, 2023
III. The status of the oceans
Roughly 20% of the Heartland Institute’s booklet Climate at a Glance is concerned with brief comments on the status of the oceans. As with all of their booklet, this section is devoted not to an even-handed discussion of the effect of global climate change on the world’s oceans, but rather to efforts to mislead readers. We will give a number of examples in this section that demonstrate the techniques used by the Heartland Institute, and we will refute their arguments.
A. What is the Situation With Respect to Global Sea Level Rise?
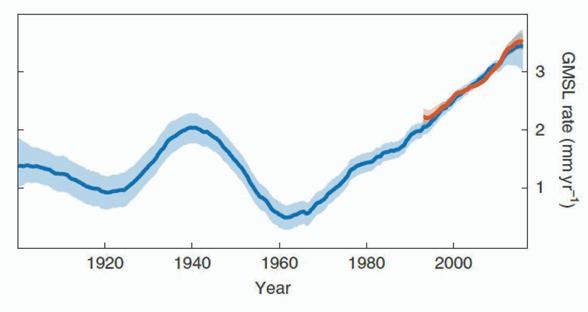
The Heartland Institute booklet claims that global warming is having no impact on sea level rise: “Global sea levels have been rising at a relatively steady pace of approximately 1 foot per century since at least the mid-1800s…with very little, if any, recent acceleration.” However, the data they show (Fig. III.1) belies this claim, showing rather clear acceleration of sea level rise over the past 50 years. Indeed, the rate of rise has been increasing pretty steadily since 1960 as the globe has warmed (see Fig. III.2). Figure III.2 includes both tide-gauge data (blue curves, which date from about 1880 to the present day), and more accurate satellite data (red curve), which date from 1993. The Heartland team seems to prefer tide-gauge data over the more recent and more accurate satellite data, though the two data sets agree well over their common years of availability.
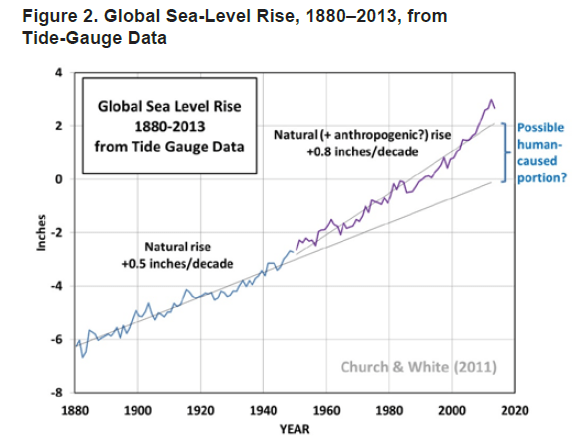
The Heartland Institute also shows tide-gauge data from a single location, The Battery in New York City. They claim that the Battery measurements refute the idea that the sea level rise is accelerating. In fact, the use of a single location simply shows the unreliability of using a single location measurement rather than taking a global average. The acceleration in sea level rise comes in part from ocean heating and primarily now from glacier and ice sheet melting (due to heating from below by warmer land and oceans and from above by warmer air). The IPCC assigns high confidence to the acceleration of sea level rise, and claims that increased sea rise driven by global climate change is virtually certain. The IPCC reported that “Global mean sea level has risen faster since 1900 than over any preceding century in at least the last 3,000 years.”
In April 2023, the World Meteorological Organization (WMO) issued its 2022 annual report on the status of climate change. They report that extreme glacier melt and record ocean heat levels contributed to an average rise in sea levels of 4.62 mm/year between 2013 and 2022. This is significantly greater than the 3.7 mm/yr shown for the last year included in Fig. III.2, and it is nearly double the rate of sea rise for the period 1993 – 2002. In addition to the heating of the oceans and the loss of polar sea ice, another major contributor to the sea rise is the very high level of melting of glaciers. Figure III.3 shows the rate of melting of reference glaciers per year. In 2022, the rate of glacier melting in Europe set an all-time record; for example, Switzerland lost 6% of its glacier ice volume in a single year, and it has lost one-third of its glacier volume between 2001 and 2022.

In its booklet, the Heartland Institute relies on cherry-picked data (tide gauge measurements from a single location, The Battery). They also claim that “satellite data going back to 1993 shows little, if any, acceleration in the pace of sea-level rise;” this statement is in direct conflict with both Figure III.1 and Figure III.2, and with the most recent report of the World Meteorological Organization, all of which show a clearly accelerating rate of sea level rise over the past 60 years.
B. Has the Rate or Severity of Hurricanes in the Atlantic and Gulf of Mexico Increased as a Result of Global Warming?
The Heartland Institute booklet begins by incorrectly asserting that “the U.S. has seen no significant warming since 2005.” We dealt with that claim in Section II.B. The Heartland team next uses that alleged, though incorrect, fact to assert the following: “Thus, when climate activists have claimed in recent years that warming has caused various U.S. environmental problems, it’s not possible their assessments are accurate, unless it can be shown the U.S. Climate Reference Network data is wrong…”. Even if their claim that the U.S. hasn’t warmed were correct, the latter statement displays a lack of understanding of the impact of global climate on water and air flow around the globe and on water temperatures that significantly affect severe storm formation. For example, most hurricanes that affect the U.S. mainland originate in the Atlantic Ocean and pass through the Gulf of Mexico. Figure III.4 shows the warming trend since 1950 for the surface temperatures of the Gulf, the mid-Atlantic, and the average of the world’s oceans. Over that same 2005-2020 time period when Heartland claims that U.S. land temperatures did not increase, the Gulf’s surface temperature increased by 0.6°C, warming about twice as fast as the average of the world’s oceans. The mid-Atlantic is warming almost as fast. The warmer surface temperatures in the Gulf strengthen hurricanes passing through the Gulf and contribute to the increase in U.S. climate disaster frequency.

Speaking of hurricanes, the Heartland booklet also claims that “real-world hurricane activity shows little, if any, impact from global warming.” To back this up they show Fig. III.5 that is consistent with roughly constant frequency of hurricanes and tropical storms over the years. However, warming oceans are not necessarily supposed to generate more storms, but rather to strengthen those storms propagating over warmer waters. As shown in Fig. III.6, the fraction of hurricanes that develop into severe (category 3 or higher) storms worldwide does show an overall increasing trend over the past four decades, though with significant year-to-year fluctuations.


The Heartland Institute claimed that “Real-world hurricane activity shows little, if any, impact from global warming.” Although they are correct that the number of hurricanes and tropical storms does not appear to be increasing, they neglect the fact that the severity of hurricanes does seem to be increasing. The 6th IPCC Report assigns medium confidence to the prediction of “intensification of tropical cyclones and/or extratropical storms.”
C. Are Islands and Coastal Areas Being Threatened by Climate Change?
It would appear that islands and coastal areas are being threatened by global climate change. As we have shown, the sea level is rising (and that rise is currently accelerating), and storms and storm surges are becoming more severe.
However, in its 2022 booklet the Heartland Institute claims that Pacific Islands are not really threatened by climate change, sea level rise, and more severe storms and surges: “Most islands and atolls in the Pacific Ocean, including Tuvalu, are increasing in size, not shrinking.” That assertion is not consistent with the data shown in Fig. III.7, where more small Pacific Islands are losing significant land mass (>5%/decade) to rising seas than are gaining due to increased sediment. And the graph, which does not go beyond 20%/decade changes, does not even include six of the Solomon Islands, which have disappeared completely between 1947 and 2014 due to sea level rise; another six of those islands have shrunk between 20 and 62 percent.

The claims by the Heartland Institute represent a case of cherry-picked data; they report only on those islands that are increasing in size and not the majority of islands that are currently decreasing.
Meanwhile, right here in the U.S., the state of Louisiana is currently losing coastal land surface area rapidly. About 1900 square miles have been lost since the 1930s, while estimates of rising sea effects suggest a possible additional loss of 4120 square miles over the next 50 years. Even when inhabitants migrate from those lands, their absence leads to stronger storm surges and increased flooding in the newly coastal regions. In addition, coastal areas of the U.S. particularly in southern Florida are now experiencing “sunny day flooding.” These events typically occur during King Tides, which result when the orbits of the Sun, Moon and Earth combine to produce the greatest tidal effects of the year. But the height of King Tides is now increasing due to the rise of sea levels caused by global climate change. None of these events are alluded to in the Heartland Institute booklet.
D. What is the Current Status of Coral Reefs Worldwide?
The Heartland Institute booklet states that coral reefs thrive in warm water conditions. They claim that “cold snaps can harm corals much more than warm spells.” The Heartland Institute discussion of coral reefs gives the impression that increasing temperatures are a boon to the reefs, and do not represent a danger to the health of the reefs. The Heartland Institute states that in past eras, coral reefs have grown when water temperatures were considerably higher than seen today. However, references to past conditions can be highly misleading. A feature of the current climate change is that it is occurring over a much faster time scale than found under normal climatic conditions. If the climate changes sufficiently slowly, plants and animals have ample time to adjust and evolve to changing conditions; however, this is not the case with the current rapidly changing situation with climate change.
Figure III.8 by NOAA highlights several ways that climate change is threatening coral reef ecosystems.
- Warming oceans produce thermal stress that causes bleaching;
- Sea level rise produces increased sedimentation that can smother coral;
- Stronger and more frequent storms can destroy reef structure;
- Increased runoff of sediment and pollutants can produce algal blooms and reduce the sunlight that reaches the corals;
- Altered ocean currents can diminish the food for corals and hamper dispersal of coral larvae;
- Increased ocean acidification can affect the integrity of the reef and decrease the rate of growth of the reef.

Although the Heartland Institute claims that coral reefs are doing fine and in fact are thriving under warmer ocean conditions, the Great Barrier Reef Foundation states that climate change is the biggest threat to the future of coral reefs around the world. In just seven years, heatwaves have triggered four mass coral bleaching events on the Great Barrier Reef, and this has reduced shallow water coral reefs by as much as 50%. Corals exist in a symbiotic relationship with photosynthetic algae; the coral structures provide shelter for the algae, and each of them provides the other with nutrients. But with increasing water temperatures, the corals expel the algae; this leaves the corals more vulnerable to disease; and it also makes it more difficult for the corals to build their skeletal structures.
Contrary to the claims of the Heartland Institute, ocean acidification represents a major threat to coral reefs, as it impedes the ability of corals to build skeletons and form coral reefs. Between 2004 and 2018, ten cyclones of category three or greater crossed the Great Barrier Reef, causing significant damage. As water temperatures rise, many marine species are forced to move to waters with cooler environments. The loss of marine life represents a severe negative impact to the reef environment.
A recent study of global reef structures during the period 1997 – 2018 found that “particularly marked declines in coral cover occurred in the Western Atlantic and Central Pacific.” Prof. David Baker of the University of Hong Kong stated that “The frequency and severity of mass coral bleaching events is increasing and indisputable. Corals have adapted to change over geological timescales – however, their evolutionary history has never encountered the unprecedented rate of change we are seeing.” The Heartland Institute claimed that “Recent warming has allowed corals to expand their range poleward.” However, Prof. Baker cautioned that “Poleward migration is going to be very limited for most coral species that do not possess the reproductive mechanisms to migrate.”
Finally, the Heartland Institute booklet quotes Australian physicist Peter Ridd as saying that “Not only are the coral at the Great Barrier Reef recovering, the amount of healthy corals is now at an all-time high.” In the past few years, Dr. Ridd has given a lecture tour disputing claims that the Great Barrier Reef is suffering, as a result of both climate change and sediment and chemical runoff on the coast of the Reef. An expert panel led by Dr. Ian Chubb stated that Dr. Ridd has seriously misrepresented “robust science” about the plight of the Great Barrier Reef. The panel compared Ridd’s claims about the Reef to the strategy used by the tobacco industry to raise doubts about the impact of smoking.
Dr. Ridd’s lecture tour has been supported by “rightwing commentators and sugarcane industry managers” who have lobbied against proposed regulations by the state of Queensland that would limit sediment and chemical runoff on the Australian coast. The letter by the expert panel states that there is clear scientific evidence regarding the condition of the Great Barrier Reef. “The northern two-thirds of the Reef were severely bleached in 2016 and 2017; while some areas have recovered, the recruitment of coral spawn into bleached areas has fallen by up to 89%; the coral has a better chance of survival in cleaner water; that global heating was the greatest risk to the Reef; that poor water quality due to contamination by nutrients, sediments and pesticides was also a major threat.”
The Heartland Institute correctly asserts that coral reefs are also threatened by sediment runoff from nearby coastal lands and fertilizer and nitrogen loading from agriculture. However, their denial that coral reefs are threatened by a number of aspects of global climate change is contrary to the position of the great majority of the scientific community.
E. Is ‘Ocean Acidification’ a Problem?
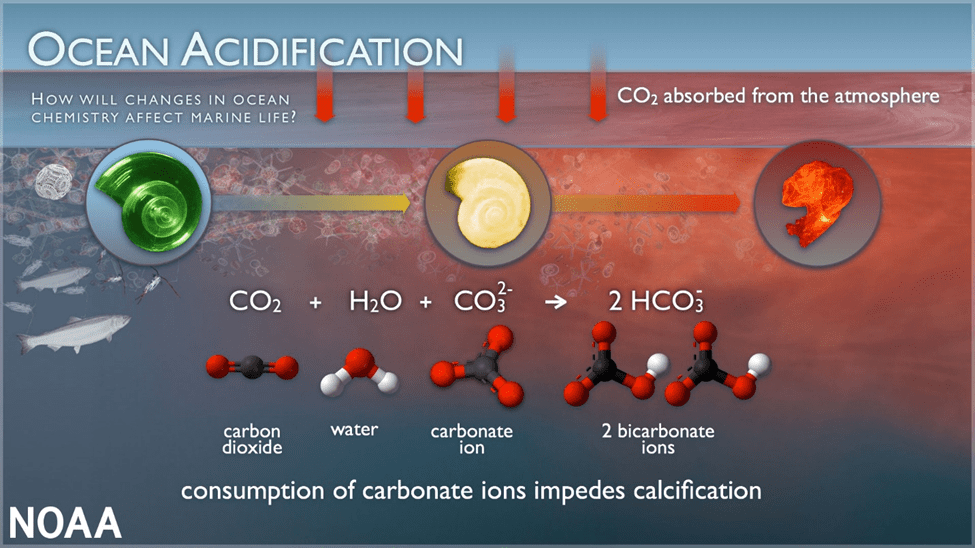
The ocean absorbs about 30% of the carbon dioxide (CO2) that is released into the atmosphere. When carbon dioxide enters the ocean, it undergoes a series of reactions. The net result is to produce bicarbonate ions (HCO3) plus hydrogen ions. Also, the number of carbonate ions (CO3) decreases in these reactions. These processes are shown schematically in Fig. III.9. The hydrogen ions released in this process make the ocean water more acidic. The pH scale gives a measure of the acidity of a solution. On the pH scale that ranges from 0 to 14, 7 represents a chemically neutral state. Anything less than 7 is acidic and greater than 7 is basic. The pH of a substance is inversely related to the concentration of hydrogen ions; so as the level of hydrogen ions increases, the pH will decrease.
Seawater is basic. In about 1850 the average pH of seawater was roughly 8.2, and today the average pH is about 8.1. The Heartland Institute booklet calls this a change of “merely 0.1 pH units.” Does this represent a very small change in the chemical composition of seawater? No, it doesn’t. Because the pH scale is logarithmic, this change means that surface ocean waters are 30 percent more acidic than they were at the beginning of the Industrial Revolution. The Heartland Institute is correct that the “acidification” that is referred to means that seawater is changing from more basic to less basic; however, the fact that the pH of the oceans remains basic does not mean that this is not an important issue. In fact, the rate of change of the pH of the oceans is now faster than it has been in the last 66 million years. And if carbon emissions are not reduced from their current values, by the end of the century ocean surface waters could reach a pH of 7.8; this would mean that ocean waters would be more than twice as acidic as they were in the year 2000. The last time that ocean waters reached an average pH of 7.8 was in the middle Miocene Period between 14 and 17 million years ago, a time when a major extinction event was taking place.
The changes to ocean chemistry depend on a number of different factors, and can vary with changes in temperature, latitude and ocean depth. For example, as ocean temperatures increase, the amount of CO2 they can hold decreases. Thus, in the colder polar regions, more CO2 is absorbed than in tropical latitudes. Surface waters in polar regions are becoming more acidic than in tropical latitudes; in fact, some of the warmer areas of the ocean are releasing more CO2 into the atmosphere than they are absorbing.
The decrease in carbonate ions that is associated with greater concentrations of carbon dioxide in seawater has strong negative consequences for species that construct their shells and skeletons from calcium carbonate. Thus, species such as clams, mussels, crabs, phytoplankton and corals have greater difficulty in finding the calcium carbonate they need to construct and maintain their shells. In sufficiently more acidic environments, the shells of such creatures can actually disintegrate. Figure III.9 from NOAA shows the shell of a pteropod dissolving, as the pH of seawater decreases. The pteropod is a very small sea snail. These creatures form an important element in food webs for marine creatures. In a research project, pteropod shells were placed in sea water whose pH and carbonate levels were adjusted to fit projections for the year 2100. The pteropod shells dissolved after 45 days in this environment. This does not represent mere speculation about future events; in a 2012 study, researchers found severe levels of dissolution of shells of pteropods in the Southern Ocean, which surrounds the Antarctic region.
As we described in Section III.D, the increased acidity of ocean waters, together with the increased temperature of the oceans, represents a serious ‘one-two punch’ for coral reefs. The increasing temperatures cause ‘bleaching’ of coral reefs, where the coral expels algae from their colonies. This weakens the coral and makes it more susceptible to disease. In addition, the increased acidity decreases the number of carbonate ions which the corals need to grow and maintain their skeletons.
The Heartland Institute booklet claims that increased carbon dioxide is a boon to the oceans, as CO2 is beneficial for phytoplankton, “which form the foundation of the marine food chain.” Unfortunately, increased CO2 and warmer temperatures also cause a major increase in the presence of toxic algal blooms. Such blooms produce domoic acid, “which is a dangerous neurotoxin that builds up in the bodies of shellfish.” As this toxin poses serious danger to human health, some fisheries on the West Coast have already suffered financially from these toxic algae.
There are some positive benefits that result from increased CO2 in the oceans. Seagrass and algae benefit from increased carbon dioxide, which they need for photosynthesis to occur. Some researchers are studying whether ‘farms’ of seagrass could be a way of absorbing CO2 in ocean waters; in fact, NOAA has provided California Sea Grant funds to investigate whether seagrass farms could be grown in coastal waters off California.
The increased temperature of the oceans and the subsequent increased acidity as a result of the absorption of CO2 in the oceans has already presented serious problems. If global temperatures continue to increase at the current rate, results could be dire by the end of this century. The 6th IPCC report assigns “high confidence” to the statement “Ocean warming and ocean acidification have adversely affected food production from fisheries and shellfish aquaculture in some oceanic regions.” That IPCC report also concluded that “There is high confidence that open ocean surface pH is now the lowest it has been for at least 26 [thousand years] and current rates of pH change are unprecedented since at least that time.” The IPCC also asserts that increasing ocean acidification due to climate change is virtually certain. Once again, the Heartland Institute attempts to minimize the problem by emphasizing one of the few benefits of increased CO2, and completely ignoring or belittling all of the negative consequences.
IV. tipping points
A. Greenland and Polar Ice Sheets
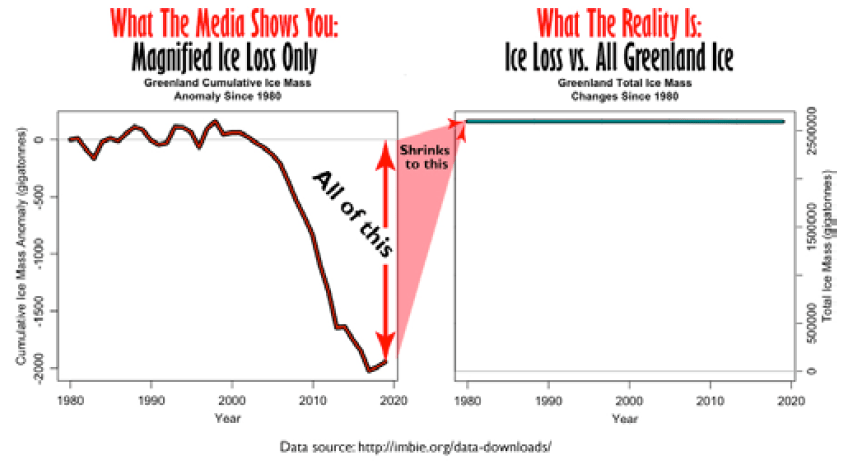
Yet another misleading claim by the Heartland team concerns the Greenland ice sheet. In describing Fig. IV.1, they say the following: “When recent ice loss is compared to the full Greenland ice sheet, the loss is so miniscule that it is practically undetectable.” They mischaracterize this fact as “the exact opposite of what many climate activists claim.” In fact, the left frame of Fig. IV.1 shows clearly that Greenland ice sheet loss is accelerating during this century. So far by 2023, the cumulative loss is about 5 trillion tons of ice. No responsible climate scientist has ever claimed that we are in danger of complete loss of that ice sheet any time soon. What concerns climate scientists is that we may well soon pass a tipping point, beyond which the eventual, irreversible, complete melting of the ice sheet, over centuries or even millennia, becomes difficult to impossible to prevent.
The anticipated tipping point occurs because of a positive feedback mechanism. Most of the current melting occurs from loss of ice from the upper surface of the Greenland sheet, some of it at altitudes of about 10,000 feet. The melting is accelerating because air temperatures at high latitudes are warming about twice as fast as the global average. But as the upper layers of ice melt, the surface now becomes exposed to even warmer air at lower altitudes, so that the more ice that melts, the faster the melting becomes.
Even if one were to cut greenhouse gas emissions drastically over the coming decades, it may take a century for atmospheric temperatures to return to preindustrial levels, because the heat-trapping carbon dioxide remains in the atmosphere for many decades. Thus, the melting of the Greenland ice sheet may well pass an irreversible tipping point between now and mid-century. Humans may then have a few centuries to adapt to much higher seas, but by the time the Greenland ice sheet has fully melted, global sea levels will have risen about seven meters from their current levels, wiping out coastlines across the planet.
Ignoring the ice melt to date, as the Heartland team proposes, because it corresponds to only a tiny fraction of all the ice in Greenland is the moral equivalent of ignoring an outbreak of a deadly, highly transmissible infectious disease when it has infected only 100 people out of the 8 billion people on Earth. If the disease is highly transmissible, infections can spread exponentially: the more people who get infected, the faster the pandemic spreads. Ignoring early warnings leads to an inability to contain subsequent catastrophe.
The Heartland booklet ignores other polar ice melt. The current rate of ice mass loss measured by satellites from the Greenland sheet is about 273 billion metric tons per year, while that from Antarctica is about 151 billion metric tons per year. The West Antarctic ice sheet is melting primarily from ocean heating. According to NASA: “Meltwater coming from these ice sheets is responsible for about one-third of the global average rise in sea level since 1993.” The eventual collapse of the West Antarctic ice sheet, leading to an additional 3 meter rise in global sea levels, is expected to pass a tipping point between now and mid-century at about the same conditions as those for the Greenland ice sheet. The IPCC 6th Assessment Report puts it this way: “At sustained warming levels between 2°C and 3°C [above pre-industrial levels], the Greenland and West Antarctic ice sheets will be lost almost completely and irreversibly over multiple millennia.”
Arctic sea ice, measured via satellite each September, when the sea ice extent reaches an annual minimum, is now shrinking at a rate of 12.6% per decade. At that rate, it may all be gone before the end of this century. Arctic winter sea ice may also be subject to a tipping point, but one that would not set in until global temperatures climb by several more degrees Celsius over current values. However, if global temperatures reach that tipping point, the Arctic winter ice could disappear over a time period as short as 10-20 years. The polar and Greenland ice melt rates are clear warnings that conditions on Earth are changing rapidly due to climate change.
B. Other Climate Tipping Points
Figure IV.2 summarizes the potential climate tipping points around the globe that may be triggered by continuing global warming. The most serious threats for the current century, colored in magenta in the figure, concern topics we have treated above: the melting of Greenland and polar ice sheets; and the dying of coral reefs. But there are also longer-term potential tipping points (colored in dark blue) involving irreversible changes in ocean currents and ocean oxygen levels. Boreal forest permafrost is likely to pass a tipping point for an eventual complete thaw, with the release of much trapped methane, this century, but the conditions that might lead to an eventual die-off of the boreal forests is less certain. The loss of mountain glaciers worldwide may pass a point of no return later in this century. Numerous other environmental tipping points are still subjects of ongoing research.
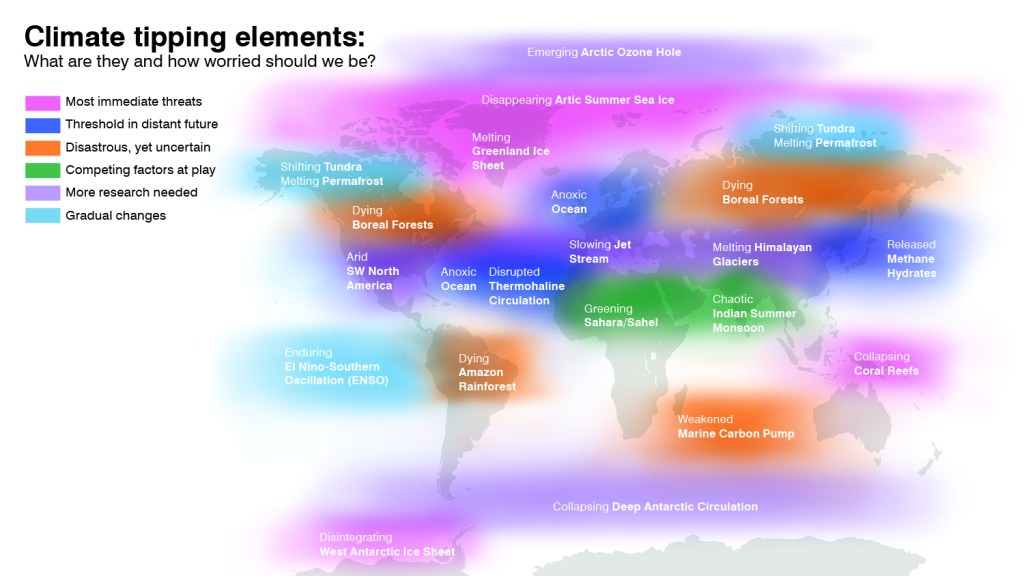
Associated with many of these tipping points are likely species extinctions. The 6th IPCC Assessment Report describes the situation this way: “The likelihood and impacts of abrupt and/or irreversible changes in the climate system, including changes triggered when tipping points are reached, increase with further global warming (high confidence). As warming
levels increase, so do the risks of species extinction or irreversible loss of biodiversity in ecosystems including forests (medium confidence), coral reefs (very high confidence) and in Arctic regions (high confidence).” Such a loss of biodiversity would cause severe collateral damage to food chains and ecosystems.
There is no mention at all of tipping points in the Heartland booklet. Any such mention would, of course, substantially weaken their intended false message that everything is fine and everyone will adapt to any small and slow changes in the global climate. The booklet is simply an irresponsible exercise in standard science denial.
V. conclusions
Many politicians and fossil fuel supporters are, quite honestly, scared of the widespread climate change concerns of our young people and new voters, who will inherit a poorly managed environment. The Heartland Institute has mailed their booklet to thousands of teachers around the country in what we hope is an ineffectual attempt to misinform at least some of those students that all is actually well.
We have specifically addressed only a fraction of the individual topics on which the Heartland authors spread misinformation. But from the topics we have addressed, one can identify the patterns of science denial methods the Heartland Institute specializes in. They cherry-pick sources, and sometimes cherry-pick which data to reproduce from even their selected sources. They mis-state the findings of other researchers and they misinterpret graphs. They feel free to use data they have been told are unreliable, so long as those faulty data support their predetermined conclusions. They ignore or reject abundant data and sources that contradict those conclusions. They also ignore previous intensive studies that have directly debunked their claims. They often ignore the global nature of climate change to focus on data for specific locations or time periods. They emphasize year-to-year or month-to-month fluctuations in weather, while ignoring the overall global trends over multiple decades. Climate at a Glance is not a useful resource about Earth’s rapidly changing climate. But it can be a rich resource in lesson plans that focus on the methods and aims of science denial.
Unfortunately, the Heartland booklet is part of a growing national campaign to corrupt the education of young people. Laws being passed in multiple Republican-controlled states to restrict the topics in science, U.S. history, and human sexuality that can even be discussed in schools (including even in colleges, in some states), while also banning books that might enlighten students about the forbidden issues, are aimed at maintaining long-term control of revisionist political narratives. The advertised aims of guaranteeing “parents’ rights” and “keeping students from feeling uncomfortable in class” ring false. Effective education often involves discomfort, as students are exposed to facts or views that may differ from those they have seen previously, and their misconceptions are addressed. And one would think that the first right of parents is to see that their students are not murdered or maimed in class. But the legislatures restricting education seldom seem interested in passing real measures to mitigate the epidemic of gun violence in American schools.
Many politicians and fossil fuel supporters are, quite honestly, scared of the widespread climate change concerns of our young people and new voters, who will inherit a poorly managed environment. The Heartland Institute has mailed their booklet to thousands of teachers around the country in what we hope is an ineffectual attempt to misinform at least some of those students that all is actually well.
references:
A. Watts and J. Taylor, Climate at a Glance: Facts on 30 Prominent Climate Topics, Heartland Institute (2022), https://heartland.org/opinion/tag/climate-at-a-glance/
Intergovernmental Panel on Climate Change, AR6 Synthesis Report: Climate Change 2023, https://www.ipcc.ch/report/sixth-assessment-report-cycle/; see also https://report.ipcc.ch/ar6syr/pdf/IPCC_AR6_SYR_SPM.pdf and https://www.ipcc.ch/report/ar6/wg2/downloads/report/IPCC_AR6_WGII_SummaryForPolicymakers.pdf
https://debunkingdenial.com/the-heartland-institute-strikes-again-part-i/
N. Oreskes and E.M. Conway, Merchants of Doubt: How a Handful of Scientists Obscured the Truth on Issues from Tobacco Smoke to Climate Change, (Bloomsbury Press, 2010), https://www.amazon.com/Merchants-Doubt-Handful-Scientists-Obscured/dp/1608193942
https://debunkingdenial.com/scientific-tipping-points-the-ozone-layer/
https://debunkingdenial.com/portfolio/the-ozone-layer-controversy/
https://ozonewatch.gsfc.nasa.gov/
B. Begert, Heartland Institute Sends 8,000 Teachers Climate Denial ‘Textbook’, Gizmodo, Feb. 6, 2023, https://gizmodo.com/heartland-institute-sends-8-000-teachers-climate-denial-1850077393
A. Chopra, ‘Infecting Minds’: US Book Sent to Teachers Seeks to Sow Climate Doubt, Yahoo, April 5, 2023, https://www.yahoo.com/lifestyle/infecting-minds-us-book-sent-032221479.html
R.L. Parry, M. Jacob, J. Mansour, and Z. Low, Book Sent to Schools Contains Misleading Climate Change Claims, Agence France Presse, Feb. 22, 2023, https://factcheck.afp.com/doc.afp.com.339G4NM
https://debunkingdenial.com/debunked-a-review-of-steven-koonins-book-unsettled/
J.J. Kennedy, N.A. Rayner, C.P. Atkinson, and R.E. Killick, An Ensemble Data Set of Sea Surface Temperature Change from 1850: The Met Office Hadley Centre HadSST.4.0.0.0 Data Set, JGR Atmospheres 124, 7719 (2019), https://agupubs.onlinelibrary.wiley.com/doi/full/10.1029/2018JD029867
NOAA, U.S. Climate Reference Network, https://www.ncei.noaa.gov/access/crn/
R.A. Muller, et al., Earth Atmospheric Land Surface Temperature and Station Quality in the Contiguous United States, Geoinformatics & Geostatistics: An Overview 1, 1000107 (2013), https://static.berkeleyearth.org/papers/Station-Quality.pdf
C. Wickham, et al., Influence of Urban Heating on the Global Temperature Land Average Using Rural Sites Identified from MODIS Classifications, Geoinformatics & Geostatistics: An Overview 1, 1000104 (2013), https://berkeleyearth.org/wp-content/uploads/2022/12/UHI-GIGS-1-104.pdf
S. St. George, The Aberrant Global Synchrony of Present-Day Warming, Nature 571, 483 (2019), https://www.nature.com/articles/d41586-019-02179-2
J.D.P. Coggin, New Report Highlights Alaska’s Last Five Years of Dramatic Climate Change, Climate.gov, Oct. 15, 2019, https://www.climate.gov/news-features/understanding-climate/new-report-highlights-alaska%E2%80%99s-last-five-years-dramatic-climate
https://www.eea.europa.eu/data-and-maps/figures/global-left-and-european-land-1
UN Office for Disaster Risk Reduction, Human Cost of Disasters: An Overview of the Last 20 Years, https://www.undrr.org/publication/human-cost-disasters-overview-last-20-years-2000-2019
Munich RE’s NatCatService, Data on Natural Disasters Since 1980, https://www.munichre.com/en/solutions/for-industry-clients/natcatservice.html
NASA, Warming Makes Droughts, Extreme Wet Events More Frequent, Intense, Mar. 13, 2023, https://www.nasa.gov/feature/warming-makes-droughts-extreme-wet-events-more-frequent-intense
US Environmental Protection Agency, Climate Change Indicators: Heavy Precipitation, https://www.epa.gov/climate-indicators/climate-change-indicators-heavy-precipitation
US Environmental Protection Agency, A Closer Look: Temperature and Drought in the Southwest, https://www.epa.gov/climate-indicators/southwest
J. Greenberg, No, Wildfires Weren’t Bigger in the 1920s and ‘30s Than Today, PolitiFact, Oct. 15, 2021, https://www.politifact.com/factchecks/2021/oct/15/heartland-institute/no-wildfires-werent-bigger-1920s-and-30s-today/
S. Dangendorf, et al., Persistent Acceleration in Global Sea-Level Rise Since the 1960s, Nature Climate Change 9, 705 (2019), https://www.nature.com/articles/s41558-019-0531-8
Intergovernmental Panel on Climate Change, Sea Level Rise and Implications for Low-Lying Islands, Coasts and Communities, https://www.ipcc.ch/srocc/chapter/chapter-4-sea-level-rise-and-implications-for-low-lying-islands-coasts-and-communities/
World Meteorological Organization, WMO Annual Report Highlights Continuous Advance of Climate Change, April 21, 2023, https://public.wmo.int/en/media/press-release/wmo-annual-report-highlights-continuous-advance-of-climate-change
Z. Wang, T. Boyer, J. Reagan, and P. Hogan, Upper-Oceanic Warming in the Gulf of Mexico Between 1950 and 2020, Journal of Climate 36, 2721 (2023), https://journals.ametsoc.org/view/journals/clim/36/8/JCLI-D-22-0409.1.xml
J.P. Kossin, K.R. Knapp, T.L. Olander, and C.S. Velden, Global Increase in Major Tropical Cyclone Exceedance Probability Over the Past Four Decades, Proceedings of the National Academy of Sciences 117, 11975 (2020), https://www.pnas.org/doi/full/10.1073/pnas.1920849117
Wikipedia, Effects of Climate Change on Small Island Countries, https://en.wikipedia.org/wiki/Effects_of_climate_change_on_small_island_countries
S. Albert, et al., Interactions Between Sea-Level Rise and Wave Exposure on Reef Island Dynamics in the Solomon Islands, Environmental Research Letters 11, 054011 (2016), https://iopscience.iop.org/article/10.1088/1748-9326/11/5/054011
Louisiana Coastal Protection and Restoration Authority, A Changing Landscape, https://coastal.la.gov/whats-at-stake/a-changing-landscape/
How King Tides Lead to Sunny Day Flooding in South Florida, NBC Miami, Oct. 4, 2022, https://www.nbcmiami.com/news/local/how-king-tides-lead-to-sunny-day-flooding-in-south-florida/2874557/
NOAA, How Does Climate Change Affect Coral Reefs?, https://oceanservice.noaa.gov/facts/coralreef-climate.html
Great Barrier Reef Foundation, Climate Change is the Single Biggest Threat Facing the Reef, https://www.barrierreef.org/the-reef/threats/climate-change
S.B. Tebbett, S.R. Connolly, and D.R. Bellwood, Benthic Composition Changes on Coral Reefs at Global Scales, Nature Ecology & Evolution 7, 71 (2023), https://www.nature.com/articles/s41559-022-01937-2
A. Morton and B. Smee, Great Barrier Reef Expert Panel Says Peter Ridd Misrepresenting Science, The Guardian, Aug. 27, 2019, https://www.theguardian.com/environment/2019/aug/28/great-barrier-reef-expert-panel-says-peter-ridd-misrepresenting-science
NOAA, Ocean Acidification, https://www.noaa.gov/education/resource-collections/ocean-coasts/ocean-acidification
P. Moore, Ocean Health – Is There an “Acidification” Problem?, CO2 Coalition, June 1, 2020, https://co2coalition.org/publications/ocean-health-is-there-an-acidification-problem/
Union of Concerned Scientists, CO2 and Ocean Acidification: Causes, Impacts, Solutions, Jan. 30, 2019, https://www.ucsusa.org/resources/co2-and-ocean-acidification
N. Bednarsek, et al., Extensive Dissolution of Live Pteropods in the Southern Ocean, Nature Geoscience 5, 881 (2012), https://www.nature.com/articles/ngeo1635
Wikipedia, Tipping Points in the Climate System, https://en.wikipedia.org/wiki/Tipping_points_in_the_climate_system
N. Boers and M. Rypdal, Critical Slowing Down Suggests that the Western Greenland Ice Sheet Is Close to a Tipping Point, Proceedings of the National Academy of Sciences 118, e2024192118 (2021), https://www.pnas.org/doi/10.1073/pnas.2024192118
NASA, Ice Sheets, https://climate.nasa.gov/vital-signs/ice-sheets/
NASA, Arctic Sea Ice Minimum Extent, https://climate.nasa.gov/vital-signs/arctic-sea-ice/
https://blogs.edf.org/climate411/files/2017/10/Climate_tipping_map_01.jpg
