
November 20, 2024
I. introduction
As global warming and the consequent changes to Earth’s climate continue throughout the 21st century, the quality of life in various regions of the globe will deteriorate significantly. More and more regions will be affected by rising sea levels, dramatic changes in precipitation yielding frequent flooding or extended droughts, loss of agricultural productivity and food insecurity, water shortages, and by an increasing frequency of heat waves, severe storms, floods, droughts, and forest fires. Many humans in these regions who are able to leave their homes will migrate to other regions, either within their own countries or across international borders.
Those migrations can, in turn, cause drastic secondary effects such as overcrowding and resource pressures in preferred destinations, civil unrest and exacerbation of state instabilities, and even wars that can trigger broader migrations. We have already seen some of those drastic secondary effects this century in Syria. Estimates of how many people will be affected remain relatively crude for now but run to the tens or hundreds of millions by the middle of the 21st century. Local and national governments will have to prepare to manage the considerable impacts of the anticipated migrations and will need useful projections of the scope of the problem in order to judge how to proceed.
The sophisticated global climate models fostered and used by the Intergovernmental Panel on Climate Change (IPCC) now provide useful, if still somewhat uncertain, projections of climate change impacts around the globe, with improving geographical granularity. They provide these projections under various assumptions concerning the growth of greenhouse gas concentrations in the atmosphere throughout the rest of this century, ranging from optimistic to pessimistic. On the basis of such climate simulations, one can make educated plans for which regions will see the greatest climate-induced incentives to migrate by the middle or the end of the century.
However, models of how humans will respond to these incentives, and what migration magnitudes and patterns may be like, are still quite crude. They must incorporate data with sufficient geographical granularity not only on climate change incentives for migration, but also on evolving population densities, economic conditions, demographics, adaptability to climate changes, and the costs of adaptation to climate change with and without mass migration. An alarmist estimate from the international think tank the Institute for Economics and Peace that there would be 1.2 billion global climate migrants by 2050 is almost certainly a gross overestimate, because the analysis assumed that all people displaced by cumulative climate events would remain displaced permanently. But more and more attention is being paid to methods to improve the climate migration estimates and it is useful to give a flavor of the present state of the art in this post.
We will first summarize what is known to date from recent statistics on massive human displacements (Section II) and from projections of climate impacts around the globe (Section III). We will then survey some human migration models in Section IV and applications specifically to migrations induced by sea level rise in Section V. We will offer some outlook and comments on government preparedness in Section VI.
II. recent statistics on mass human displacements
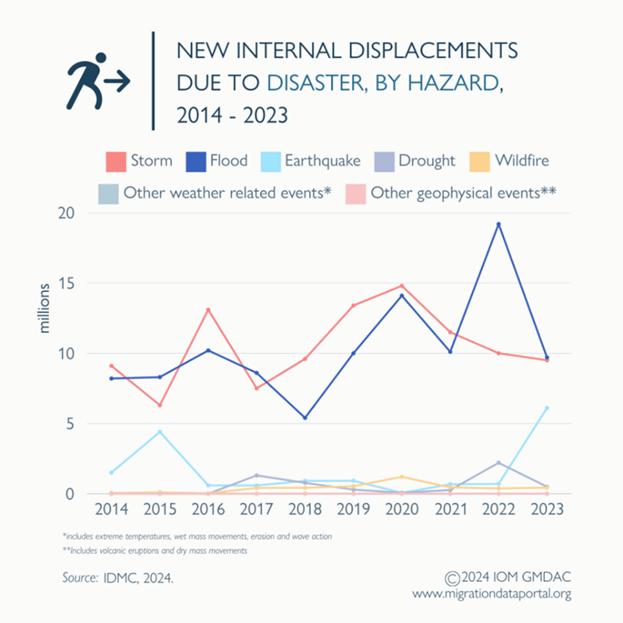
What do we know from recent past migration statistics? Good statistics on human displacements from natural disasters have been maintained in this century by the International Organization on Migration (IOM) associated with the United Nations. The vast majority of these displacements have been internal within the affected country and the global average over the past decade (see Fig. II.1) indicates that more than 20 million people, on average, are affected annually.

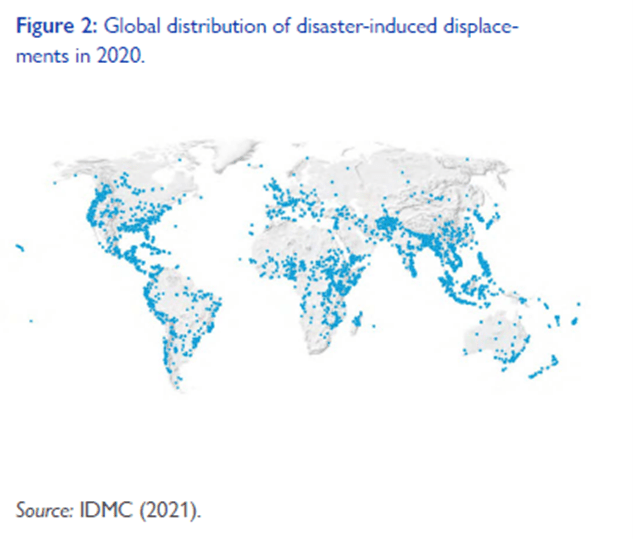
As shown in Fig. II.2, the largest contributors to these displacements have been intense storms and floods. The regions hit hardest by storms and floods have been East Asia and the Pacific, South Asia, and Sub-Saharan Africa. But as illustrated by the map in Fig. II.3, all parts of the globe and especially coastal regions have seen impacts.
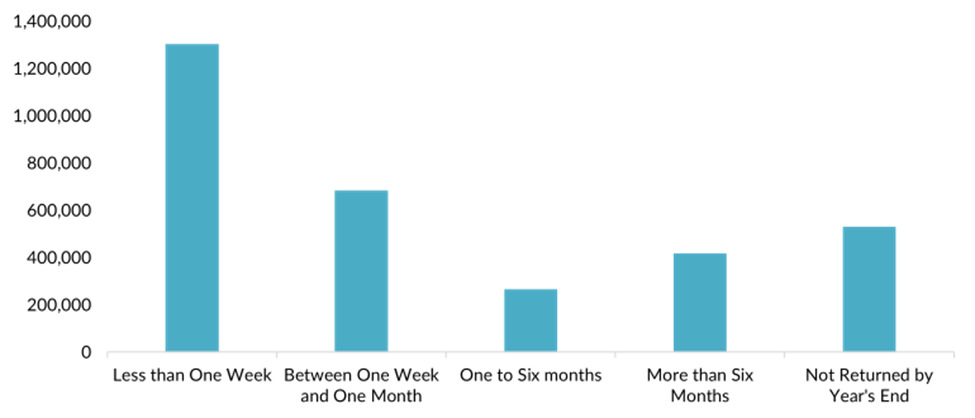
However, the majority of the disaster-triggered displacements are temporary. For example, “According to U.S. Census Bureau data, 3.2 million U.S. adults were displaced or evacuated due to natural disasters in 2022, of whom more than 500,000 had not returned by the beginning of 2023” (see Fig. II.4). But 40% of those displaced adults were able to return home within one week.
Long-term or permanent migrations, either internal or cross-border, can be induced by numerous incentives, including economic conditions, threats of violence, wars and government instability, in addition to climate drivers. Because two or more of these motivations are often involved in individual decisions to migrate, there is not yet any general agreement about how to define “climate migrants.” The challenge is illustrated by Fig. II.5, showing model results from Schutte, et al., who “assessed the relative influence of climate, economic factors, and political violence on asylum applications to EU member states over time.” The Schutte model suggests that climate conditions have to date been only a minor consideration in migration decisions, outweighed by economic and especially by violence conditions.
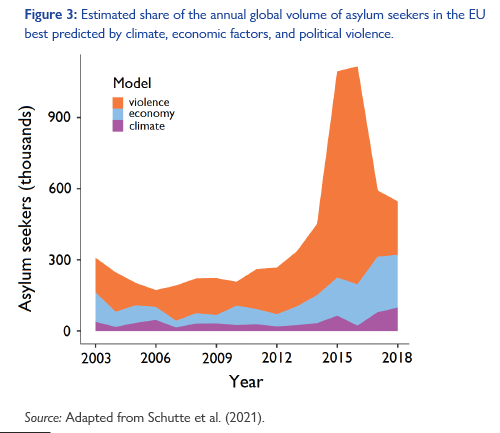
However, the huge orange spike in Fig. II.5 in 2015-16 reflects the massive influx of Syrian refugees, who were indeed immediately convinced to migrate by the Syrian Civil War. But internal climate migration within Syria was a major root cause of that war. As we have reported previously in our post on Climate-Related Societal Collapse, a severe, extended drought starting in 2006-7 led to the collapse of agricultural productivity and the death of most livestock in the northeastern “breadbasket” region of Syria. Stimulated further by President Bashar al-Assad’s decision to cut food and fuel subsidies, roughly 1.5 million climate migrants subsequently relocated from no-longer-viable rural farming areas to the peripheries of Syria’s large urban centers, exacerbating overcrowding already fed by rapid population growth and more than a million refugees from the Iraq War. As reported by Kelley, et al., “The rapidly growing urban peripheries of Syria, marked by illegal settlements, overcrowding, poor infrastructure, unemployment, and crime, were neglected by the Assad government and became the heart of the developing unrest…”
The Syrian situation illustrates that secondary impacts of climate migration, often coupled with other problems, can be severe. In particular, as more regions of the globe become subject to climate-change-induced severe drought, flooding, and agricultural collapse, rural-to-urban migration and consequent stresses on resources will grow more widespread. In Syria since 2011, according to the UN Refugee Agency (UNHCR), more than 7.2 million Syrians have been internally displaced by agricultural collapse and conflict, and in addition to the more than 2 million who sought asylum in the EU, another 5.5 million Syrian refugees now live in the five neighboring countries of Turkey, Lebanon, Jordan, Iraq, and Egypt. The influx of so many refugees also exacerbates tensions in those destination countries. In sum, more than 14 million Syrians have been forced to migrate, either internally or across borders, by the combination of climate change, dire economic conditions, and conflict.
III. projections of climate change impacts around the globe
Long-term and permanent climate migration in the future may well be triggered not so much by temporary disasters, but more by gradually increasing climate change – the steady rise in sea levels, coastal erosion and island submersion, altered precipitation patterns (extended drought and flood periods), water shortages, and temperatures and humidity often reaching levels endangering human health. Such gradual changes also make the impacts of sudden disasters worse, for example, by increasing storm surges and floods when climate-strengthened storms occur over rising and warming seas.
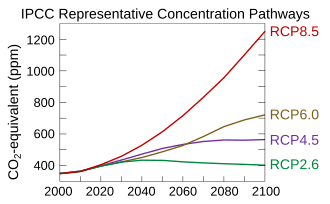
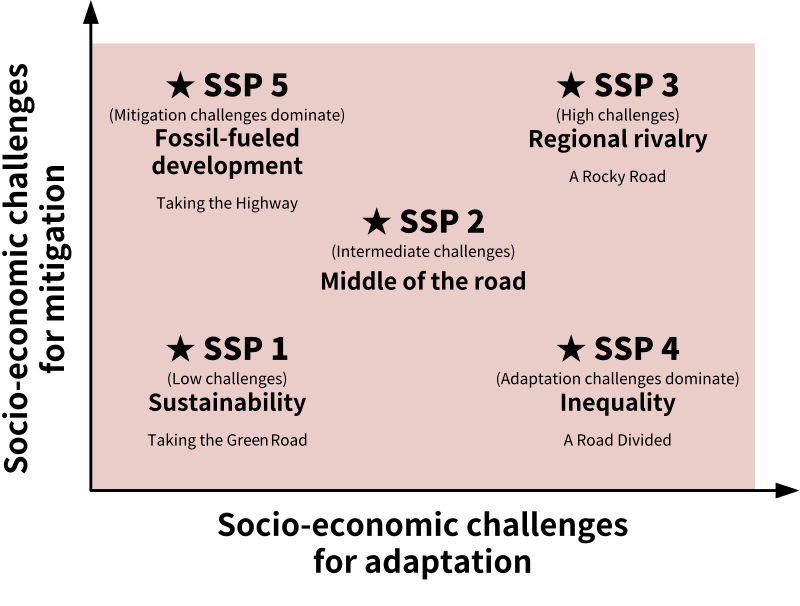
In the IPCC 6th Assessment Report the best current projections of climate change impacts and human risks around the world are outlined in the section on Impacts, Adaptation and Vulnerability. Projections are based on global climate models assuming a range of values for the Representative (greenhouse gas) Concentration Pathway (RCP, see Fig. III.1) and for a variety of Shared Socioeconomic Pathways (SSP). The latter refer to diverse assumptions for how humanity deals with mitigation and adaptation to climate change (see Fig. III.2).
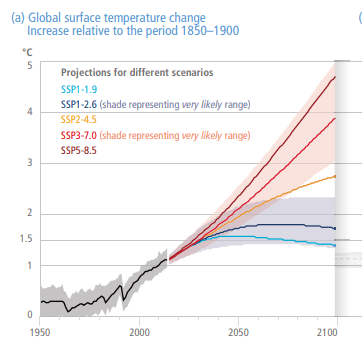
The impacts of different SSP-RCP choices on global mean temperature projections out to the end of the century are shown in Fig. III.3. The shaded bands for RCP 2.6 and RCP 7.0 indicate the range of predictions for various models using the same concentration and socioeconomic pathways. Projections for global mean sea level rise in meters are shown in Fig. III.4. Global sea level has already risen by about 20 centimeters since 1900 and is projected to continue rising in all SSP-RCP scenarios, as shown in Fig. III.4. The dashed line in Fig. III.4 represents a worst-case SSP5-RCP8.5 scenario in which the globe passes tipping points for the melting of the Greenland and West Antarctic ice sheets, thereby strongly accelerating sea level increase.

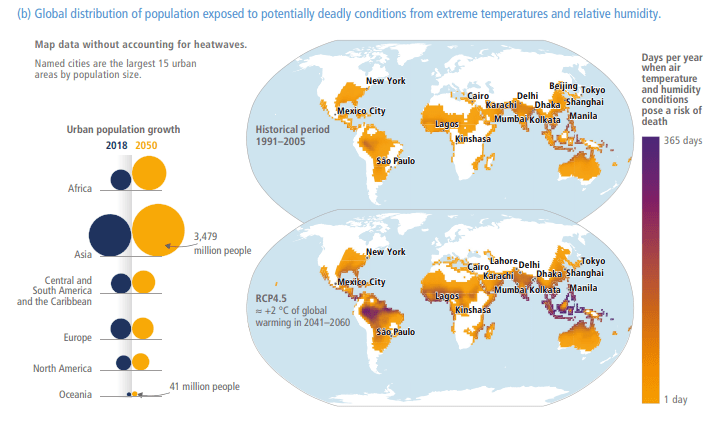
What matters for projecting climate migration is the variations in climate change impacts around the globe. One example of projected impacts for even the moderate pathway RCP4.5 is shown in Fig. III.5, where the map indicates the average number of days per year that people in various regions will experience temperature and humidity conditions that pose human health risks, both near the turn of this century and projected to mid-century. Note that even with only 2.0°C increase in global mean temperature above the 1850-1900 average many equatorial regions around the globe will be subjected to dangerous temperature and humidity conditions for hundreds of days per year, especially due to increasing urbanization. As the IPCC report points out, “Within cities the urban heat island effect elevates temperatures further, with some populations in cities being disproportionately at risk including low income communities in informal settlements, children, the elderly, disabled, people who work outdoors and ethnic minorities.” Figure III.5 also indicates the expected urban population growth for various continents by mid-century; nearly 3.5 billion people are anticipated to reside in urban areas in Asia. And the data used for the map don’t even take into account heatwaves, which can amplify the danger to human health.
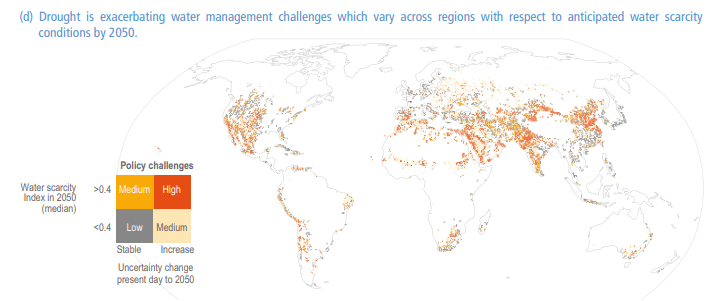
Agricultural production worldwide has been increasingly affected by droughts and floods already, as seen in Fig. III.6. Continuing climate change will alter precipitation patterns across the globe, with some regions subjected to severe drought and others to severe flooding. Figures III.7 and III.8 illustrate IPCC projections for regions that will be affected, respectively, by water scarcity and by flooding by mid-century.
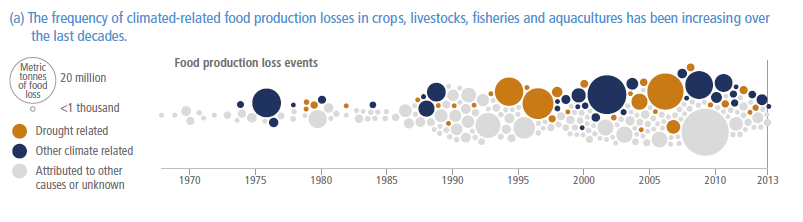
Figure III.7 indicates regions that are likely to be impacted by water scarcity by 2050, using median climate projections. Note the likelihood of severe drought conditions through the so-called Fertile Crescent region of the Middle East, including Syria, where drought already contributed strongly to the Syrian Civil War. Other regions that will be seriously impacted include the American southwest and northern Mexico, northwestern India and Pakistan, western South America, and parts of China and Mongolia.
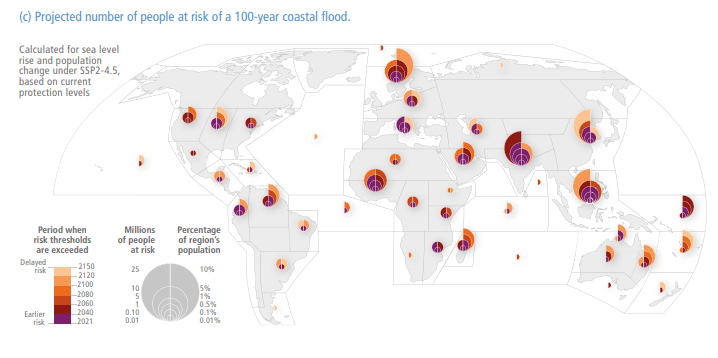
At the opposite extreme are the regions that will be severely impacted by flooding or inundation as a result of sea level rise, storm surges, and precipitation changes. These are mapped for the various world regions considered by the IPCC in Fig. III.8. Each circle in the figure has two halves. The diameter of the left half indicates the absolute number of people in that region who will be at risk, for the moderate SSP2 RCP4.5 pathway, of suffering from a major flood, the type that used to occur once per 100 years before the 21st century. The right half of each circle indicates the fraction of the region’s population who will be at risk. The color coding of the circles indicates when each level of risk is expected to be exceeded during the next 130 years. The areas at most immediate risk are: South Asia, including India and Pakistan, where about 25 million people will be at risk by 2040; southeast Asia, where 25 million people will be at risk by the end of the century; Scandinavia, where 10% of the population will be at risk by 2080; and Pacific islands, where significant fractions of the population are at imminent risk from inundation. Even though the risks are more moderate in North America, we will consider in Section V an explicit model for migration within the U.S. that would result from continued sea level rise.
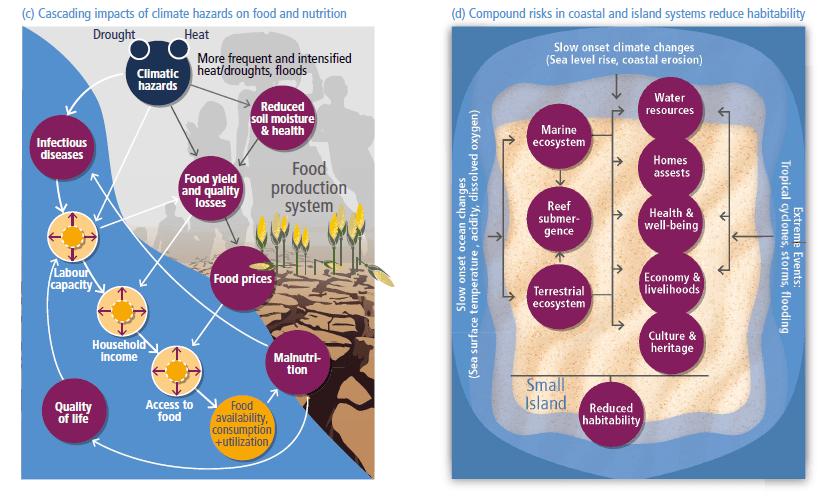
The risks posed by all these climate changes are not only to human health and well-being, but also to food production, to national economies and personal livelihoods, to the quality of life, to culture and heritage, and even to government stability as we’ve seen in Syria. In a series of illustrations, the IPCC report attempts to show how effects cascade from various climate impacts. Two of these are shown in Fig. III.9, indicating how increased drought, heat, and flooding affect food and nutrition, and how the combination of sea level rise, coastal erosion, flooding and intensified storms, along with changes to the oceans themselves, affect many features of coastal life and the habitability of island nations.
IV. migration modeling
All of the climate change impacts outlined in Section III, as well as others like more frequent and severe wildfires and heat waves, will provide the incentive for many people to migrate to more desirable regions. But projecting how many people will migrate is a complicated business. It requires modeling, in addition to the climate impacts, the anticipated evolution in population densities, economic conditions, job availability, climate risk and adaptation, and openness to migrants, all with sufficient geographical granularity to make meaningful maps of where people may leave and where they will migrate to. And the evolution of those characteristics has to be modeled dynamically to include the effects on them of migration itself (including ongoing urbanization unrelated to climate change); for example, urban centers which initially seem like desirable destinations may soon become so overcrowded that subsequent migration to them is suppressed.
The problem is sufficiently daunting when considering migration within the country of origin. Adding potential language, culture, social, ethnic, and political barriers is beyond the capability of the best migration models to date. When migrants do cross borders it is most often to neighboring countries. The Groundswell Report generated by the World Bank points out that “Although absolute numbers are higher today than in the past, international migration has not changed greatly in percentage terms since 1990.” So the best current models we discuss in this and the following section deal purely with internal migration.
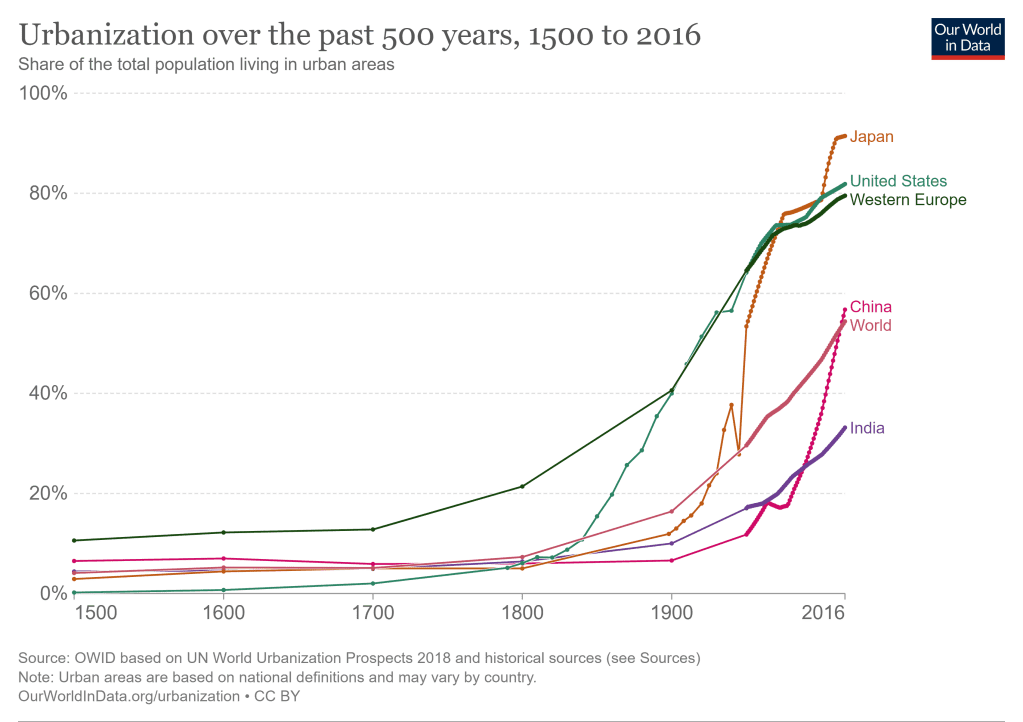
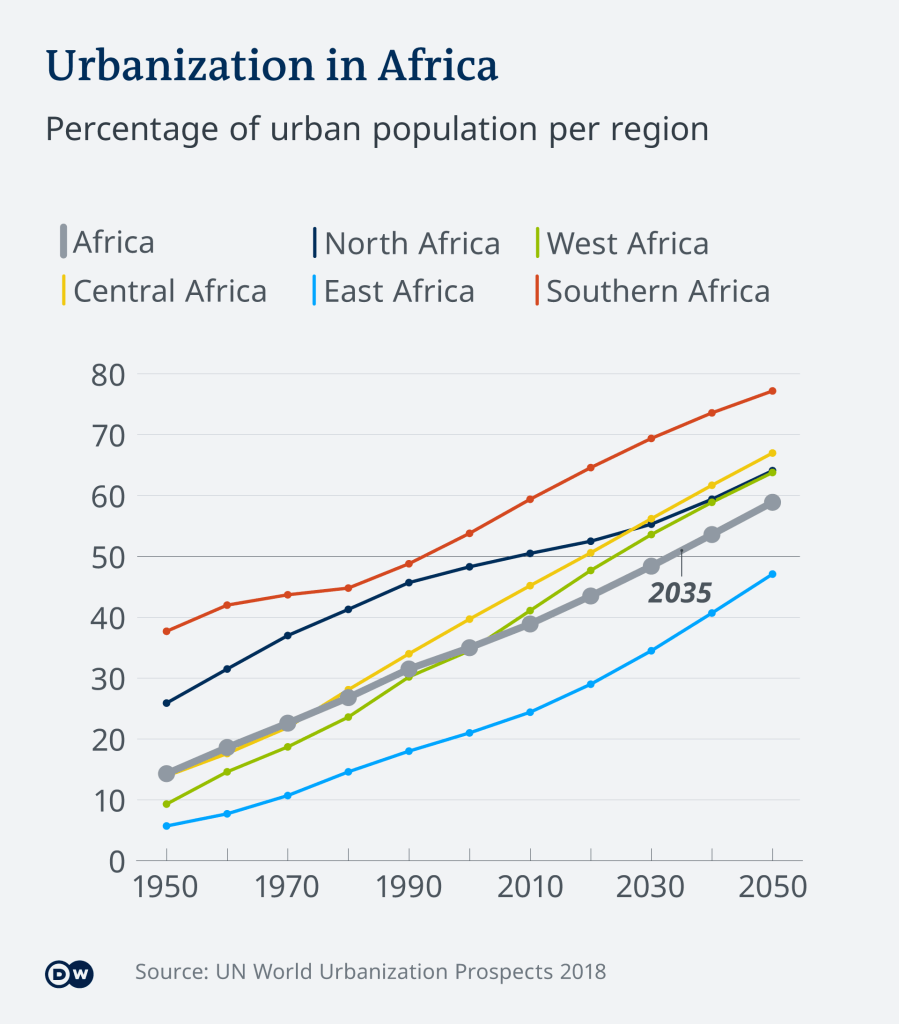
Most migration models used to date apply econometric models tuned to explain historical human migration patterns. The dominant migration pattern during the industrial age has been movement to large urban centers or their peripheries, where jobs and support opportunities are greater than in rural areas. The rapid urbanization within the industrialized world is illustrated by population data in Fig. IV.1. Much of Africa has lagged behind in industrialization and urbanization, but it is currently the site of the fastest ongoing urbanization in the world, as indicated in Fig. IV.2.
Classical economic approaches to modeling migration have thus assumed “that migration typically flows from low-wage to high-wage labor markets and from low-opportunity to high-opportunity locales.” Classical models have been extended by “push-pull theory”: “Push factors (such as poverty, lack of opportunities, and migration networks) are associated with source areas. Pull factors (such as jobs, social services, family members, and social networks) are related to destination areas.” But push-pull theory also incorporates influences on migration decisions from individual characteristics such as age, gender, ethnicity, and wealth, as well as barriers to moving such as bureaucratic constraints and loss of property rights.
The New Economics of Labor Migration acknowledges that, in addition to the conventional push and pull factors, “migration decisions are often part of a household’s collective strategy to diversify its income sources and reduce its exposure to hardships and risks…”. Climate change impacts will certainly constitute a new class of hardships and risks to be taken into account. The economic theories have traditionally focused on voluntary migration, whereas climate impacts may occasionally force mass migrations or lead to government-mandated evacuations in order to mitigate the overall costs of dealing with the impacts.
The most extensive application of econometric modeling to climate migration has been carried out by the World Bank Group in the two-volume Groundswell Report. The Report’s approach “quantifies the attractiveness of each cell of a spatial grid in terms of economic, demographic, and climate change-related environmental conditions (water stress, crop yields, and sea level rise augmented by storm surge) and simulates the internal migration flows of people from less to more attractive locations” within the countries where they reside at first. The spatial grid used comprises 14 square kilometer cells covering six world regions: Sub-Saharan Africa; South Asia; Latin America; East Asia and the Pacific; North Asia; and Eastern Europe and Central Asia. Since the Groundswell Report was generated prior to the IPCC 6th Assessment Report (from which the figures in Section III were drawn), it relies on the 5th Assessment Report to evaluate likely slow-onset climate impacts by 2050 on water availability and crop productivity, as well as sea level rise and storm surges. The analysis does not consider potential climate tipping points that could conceivably be passed by 2050 and amplify climate impacts such as sea level rise.
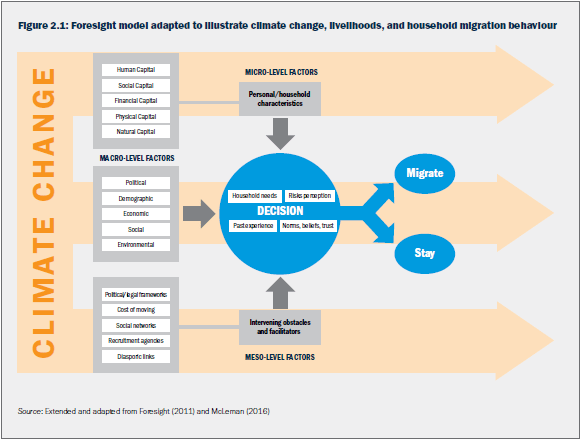
In order to assess climate migration impacts, the Groundswell Report projects national population distribution within each country under two basic scenarios: for development pathways alone — associated with population growth, increasing urbanization, and economic development – and for pathways that combine those development projections with specific, slow-onset climate impacts. The main drivers and destinations of climate migration differ from location to location in their granular models. The analysis including climate change impacts relies on a framework for climate migration developed in the 2011 Foresight Report. “It emphasizes that climate change influences migration decisions through existing migration drivers, especially economic, environmental, and to some extent political drivers—by, for instance, depressing rural wages, raising agricultural prices, shaping exposure to hazards, and stressing ecosystems.” The Foresight approach to individual household decisions about whether or not to migrate is summarized in Fig. IV.3.
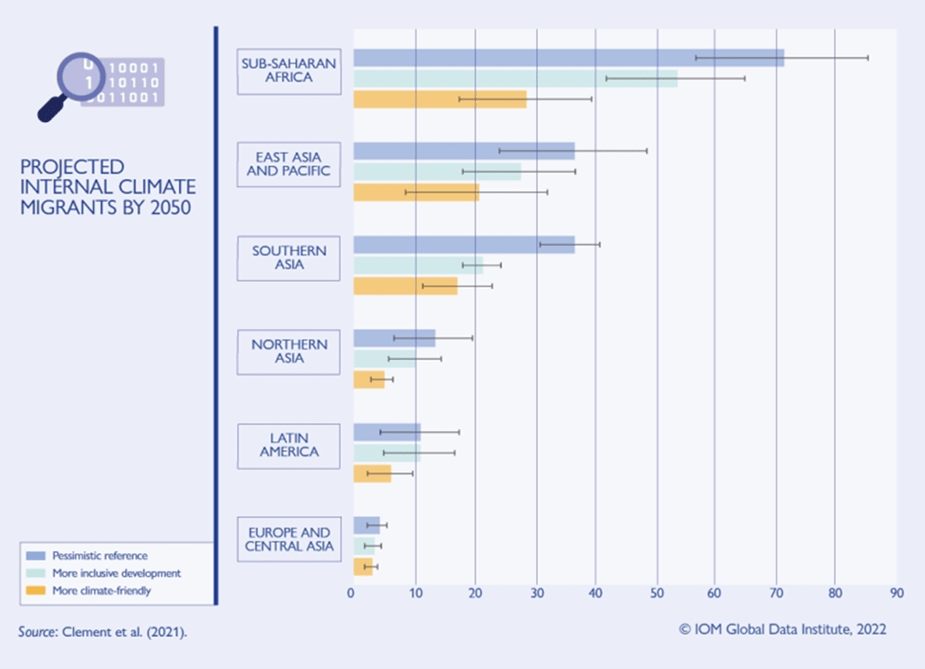
The conclusion of the Groundswell Report is that “climate change could lead up to 216 million people across six world regions…to move within their countries by 2050 if no urgent action to reduce global greenhouse gas emissions is taken.” These results are presented in Fig. IV.4, where the different colored bars represent the three distinct climate and socioeconomic pathways under which the Groundswell Report considered likely internal migration patterns. The darker blue bars represent the most pessimistic assumptions, characterized by Representative Concentration Pathway RCP8.5 (see Fig. III.1) combined with Shared Socioeconomic Pathway SSP4 (see Fig. III.2). These choices imply that no real progress is made toward reducing human greenhouse gas emissions and that developing regions remain “highly vulnerable to climate change and with limited adaptive capacity.” The lighter blue bars combine the same pessimistic climate pathway with a more inclusive development pathway (SSP2 in Fig. III.2) that moderates economic inequality, urbanization rates, and population growth. The orange bars are based on combining the pessimistic development pathway (SSP4) with the much more optimistic climate pathway determined by RCP2.6, which assumes that every country meets its Paris Climate Accord pledges to keep global mean temperature rise from preindustrial values within 2.0°C.
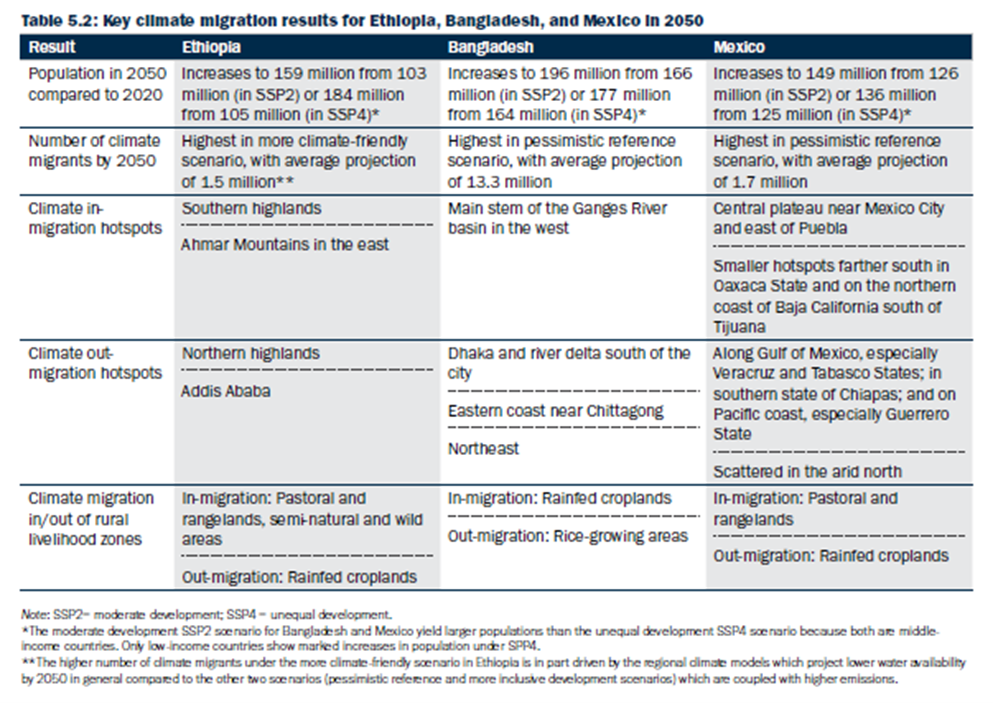
Because the climate change impacts vary from location to location, the primary drivers of climate migration differ from country to country. This is illustrated by the table in Fig. IV.5 summarizing some results from the Groundswell simulation, specifically for Mexico, Ethiopia, and Bangladesh. Note, for example, that while climate migrants in Ethiopia and Mexico are expected to move away from rainfed croplands as the climate there grows drier, rainfed croplands are likely to be a preferred destination in Bangladesh, where flooding is likely to be the bigger problem. In addition, climate migration will not necessarily follow the normal migration trend toward increasing urbanization: in Ethiopia and Bangladesh climate migrants are expected to move out of the major cities of Addis Ababa and Dhaka, respectively, while in Mexico the central plateau around Mexico City is expected to be a popular in-migration site.
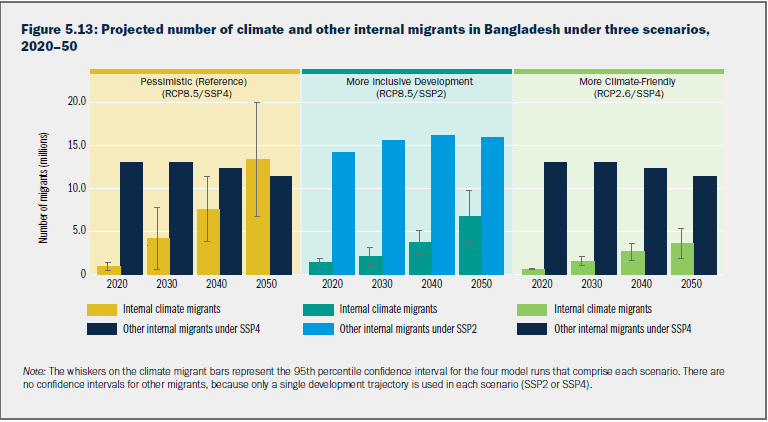
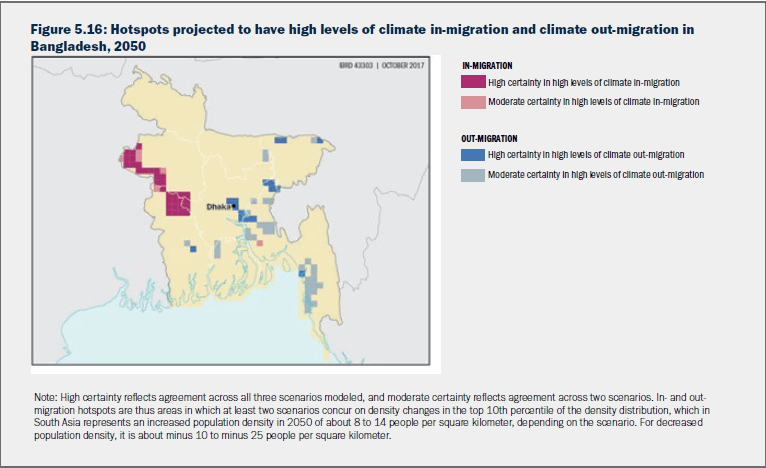
Among the three specific countries considered in Fig. IV.5, the low-lying Bangladesh is projected to be most impacted by climate migration, as illustrated in Figs. IV.6 and IV.7. In the most pessimistic climate scenario, climate migration within Bangladesh is projected to be comparable to ordinary economic migration by 2050, as shown in Fig. IV.6. The detailed map in Fig. IV.7 of out-migration and in-migration hot-spots within Bangladesh gives some idea of the geographical granularity that needs to be taken into account in meaningful projections of climate migration.
The Groundswell Report probably represents the most careful of the various econometric approaches to climate migration and provides a useful order-of-magnitude estimate (tens to hundreds of millions) of the number of people worldwide whose decision to migrate will be strongly influenced by climate change impacts. However, there is no general quantitative consensus among econometric models. As the International Organization on Migration puts it: “Comprehensive reviews of econometric analyses on climate mobility have highlighted the divergent nature of findings, concluding that whilst most studies find that certain climatic variables have statistically significant effects on internal and international migration, there is overall no consensus about the quantitative strength, and in some cases even the direction, of the effect.”
V. modeling climate migration due to sea level rise
Recent years have seen a number of new migration models based not on economic theories, but rather employing machine learning computer codes to characterize existing patterns of migration within countries, including of climate-related migration arising from disaster displacement. We have described machine learning in our previous post on artificial intelligence. These models tend to deal with climate migration arising from a particular climate impact, such as sea level rise and coastal flooding or decreasing agricultural productivity.
We will first describe one of these attempts, dealing in some detail with climate migration within the U.S. under the threat of ongoing sea level rise. This work, by Robinson, Dilkina, and Moreno-Cruz, is notable for including not just the direct impacts of climate change on migration, but also the indirect impacts likely to arise from the migration itself. They show that the indirect impacts are important to consider. As these authors point out: “These indirect effects will cause accelerated changes for inland areas, particularly urban areas, that will observe much higher levels of incoming migrants than they would have without climate impacts. These changes can in turn take the form of tighter labor markets…and increased housing prices…with broader effects on income inequality in the coastal areas.”
Robinson, et al. project internal U.S. migration under two scenarios of mean global sea level rise by 1.8 meters (about 6 feet) or 0.9 meters (about 3 feet) by 2100. As seen in the IPCC sea level projections in Fig. III.4, 1.8 meters is at the upper end of the worst-case scenario, while 0.9 meters is already at the top of the projections not including ice sheet tipping points. However, Robinson, et al. show some timelines that will allow us to relate their projections to more modest expectations of sea level rise.
Their analysis divides the U.S. into 216,330 census block groups. They have county-level statistics on population, demographic distributions, and median income, as well as projections of how these would evolve under normal conditions, and they apply these data to all census blocks within a given county. For each block they also have relevant climate projection estimates, including local sea level rise based on the Digital Coast dataset provided by the National Oceanic and Atmospheric Administration (NOAA), as well as temperature variations across urban heat islands. The NOAA spatial estimates take into account “tidal variability, hydroconnectivity, probable flooding, and federal leveed areas.” For an assumed global sea level rise they then separate all of these census blocks into two groups that they consider “flooded” and “unflooded.” Here, “flooded” can include areas truly inundated by rising seas as well as areas affected by “exposure to ‘high-magnitude events’ such as large-scale flooding from hurricanes, or indirectly through the ’cumulative contribution of ongoing localized events across regions.’”
As suggested by Fig. V.1, Robinson, et al. treat migration from the flooded and unflooded blocks very differently. Inhabitants of unaffected blocks are assumed to migrate to other unaffected areas as in usual climate-unrelated migration patterns. In particular, past observations suggest that, on average, 3% of a county’s population will migrate per year under normal conditions. They use an artificial neural network (ANN) trained on past county-to-county migration data kept by the Internal Revenue Service to deduce the probability that a migrant from one county will move to a second county, depending upon the populations of the two counties, the distance between them, and all the other possible destination counties within the same distance from the county of origin. With an ANN this relationship can be quite complicated, as opposed to the simple functional forms used in more traditional econometric approaches.

The authors assume that all inhabitants of flooded blocks will be forced to migrate. This certainly represents an overestimate for regions that are not completely inundated, but it probably compensates in part for ignoring climate-related migration from nearby unflooded blocks. For the flooded counties, they train a new ANN on historical migration patterns from seven specific coastal counties in Louisiana and Mississippi that were severely impacted by the powerful Hurricanes Katrina and Rita earlier this century. Each of these counties had more than 1,000 outgoing migrations and experienced more than 100% increase in the outgoing migrations compared to data from before the two hurricanes. The two hurricanes both struck the New Orleans region within one month of each other in 2005. 80% of the city of New Orleans was flooded in the aftermath. “Followup studies and Census estimates showed that New Orleans only contained around half of its pre-hurricane population within a year of the storms.” Thus, the migration patterns from those seven counties provide a window into more-or-less permanent migration resulting from severe flooding. Remember that the ANN does not depend on the specific location of the county of origin, but determines migration probabilities as dependent only on the populations and distances to unflooded destination counties.
As migration occurs in the Robinson, et al. approach, the demographic data change for both origin and destination counties. In addition, the climate data evolve according to simulations for the chosen greenhouse gas concentration pathway. The demographic and climate data updates then impact subsequent migration patterns. In this sense, the authors carry out a dynamic simulation.
Figures V.2 and V.3 represent migration results from Robinson, et al. by the year 2100 for the most pessimistic climate projection, where they assume sea level rise by 1.8 meters. In Fig. V.2, the flooded coastal regions are colored in blue, while the color coding in other regions reflects the number of additional incoming migrants per county in the sea level rise scenario over the baseline. Clearly, the in-migration hot spots tend to be just inland from the flooded regions. Some of these destination counties would see a hundred thousand or more climate migrants.
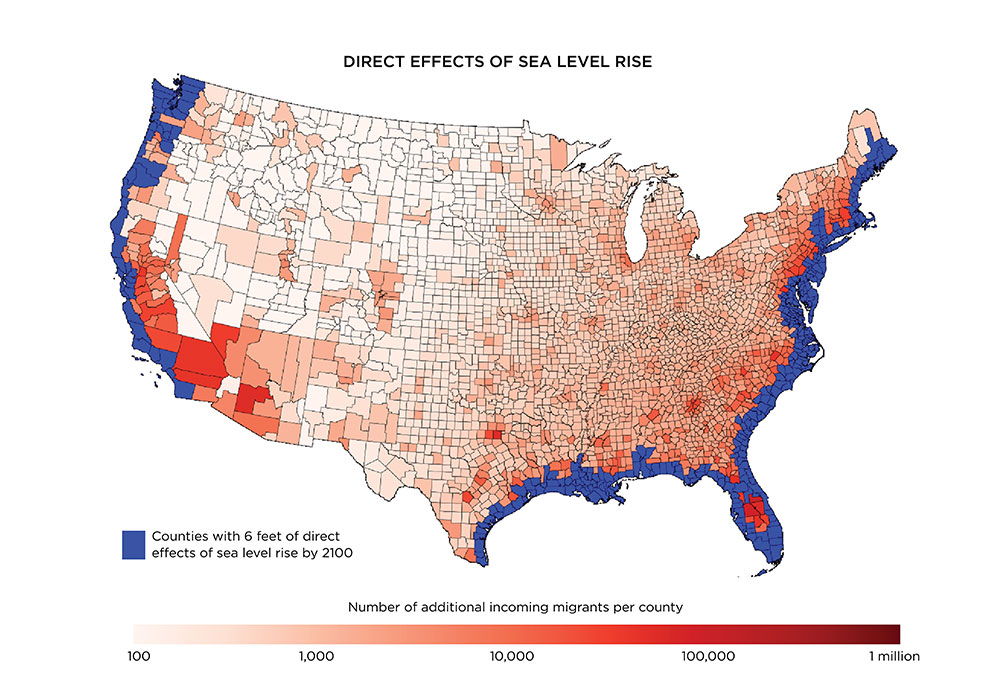
Figure V.3 illustrates the indirect impacts of the climate migration. In addition to the flooded regions still colored in blue, now the color coding of destination counties reflects the percentage increase in the county’s population represented by the migrants specifically resulting from sea level rise. Although there isn’t a large absolute number of climate migrants from flooded coastal regions who reach the Midwest, nonetheless there are a significant number of Midwestern and Plains state counties that would see their populations swell by more than 6%, as would also be the case for many counties just inland from the flooded regions. Significant planning is needed for counties to deal with that level of otherwise unanticipated growth.

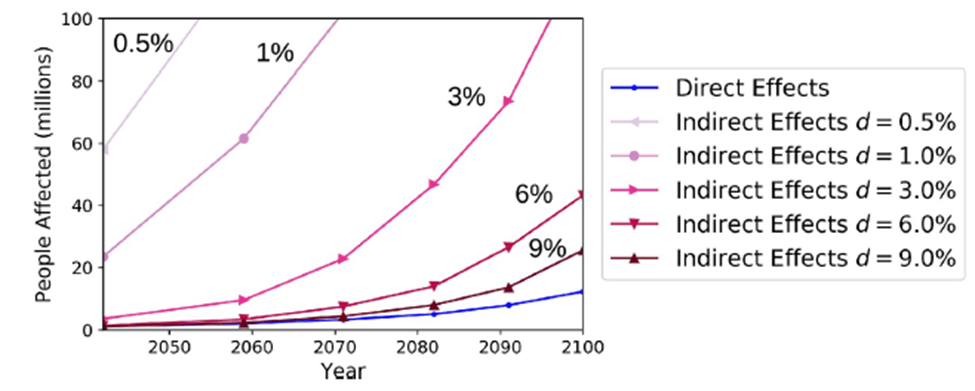
Figure V.4 shows how the total number of U.S. inhabitants affected either directly by sea level rise (blue curve) or indirectly by in-migration (purple curves) grows with year under the most pessimistic sea level rise scenario. If sea levels were actually to rise by 1.8 meters by 2100, some 13 million Americans would be permanently displaced from flooded coastal regions. In addition, another 40 million people would reside in counties whose population would grow by more than 6% from climate in-migration. The data points in this figure represent stages of sea level rise from 0.3 meters to 1.8 meters in increments of 0.3 meters. In the much more optimistic climate change view represented by SSP2-RCP4.5, sea level would rise by only 0.7 meters by 2100 (see Fig. III.4), a level reached by the early 2060s in the pathway represented in Fig. V.4. In that scenario, then, the number of people affected directly and indirectly by 0.7-meter rise would be about 3 million and 5 million, respectively. The bottom line is that, according to the Robinson, et al. simulations, millions of Americans are likely to be affected by internal migration driven by sea level rise this century. And it could get much worse if the melting of the Greenland and West Antarctic ice sheets continues to accelerate, leading to rapidly accelerating sea level rise.
One shortcoming of the Robinson approach is the assumption that migration is forced once a county falls below sea level. In an alternative global analysis of sea level rise impacts, Lincke and Hinkel note that there are “millions of people that are currently living below mean high tides, for instance in The Netherlands or other densely populated delta regions such as New Orleans, Tokyo and Shanghai.” The people in these densely populated regions are protected from flooding by levees, dikes, and other barriers. Any meaningful assessment of climate migration due to global sea level rise should then take into account whether the costs of mass migration exceed the costs of adding and maintaining comparable protection against flooding. Lincke and Hinkel have carried out a cost-benefit analysis addressing such tradeoffs in estimating coastal migration impacts around the world from continuing sea level rise.
Lincke and Hinkel consider sea level rise throughout the 21st century under five distinct greenhouse gas concentration pathways representing end-of-century rise by anywhere from 33 to 170 centimeters: the lower (low ice-melt) and upper (high ice-melt) edges enclosing 90% of the uncertainty bands corresponding to RCP2.6 and RCP8.5, and the low-likelihood, high-impact worst-case scenario represented by the dashed curve in Fig. III.4. They also consider each of the five socioeconomic SSP pathways in Fig. III.2 and five social discount rates – used in computing the value of funds spent on social projects – ranging from 0% to 6%.
Lincke and Hinkel further consider scenarios in which residents are allowed to migrate autonomously, one by one reactively when they consider their situations no longer tenable, or alternatively are recommended proactively to evacuate by governments. Taking into account general public reluctance to leave one’s home, the authors assume that autonomous migration occurs when a region is projected to experience one major flood per year, while managed migration would be put in place when there is one major flood per ten years. At one flood per year, land is no longer useful for buildings or infrastructure, while at one flood per ten years it may still be possible to use the land for agricultural purposes even after a managed migration of the inhabitants. In all, Lincke and Hinkel evaluate coastal land loss, numbers of people who will migrate, and local cost-benefit analysis (CBA) for 250 different scenarios and about 12,000 global coastline segments, each treated as containing within it homogeneous coastal and socioeconomic characteristics.
Lincke and Hinkel find: “From the point of view of CBA, coastal protection is found to be favored over retreat (including both, autonomous migration and planned relocation) in all scenario combinations for 3.4% of the world’s coastline…corresponding to…78% of global floodplain population, and 92% of the global floodplain assets in 2015. For the remaining 96.6% of the world’s coastline, proceeding without protection and accepting the resulting land loss and coastal migration is the preferred option in at least one scenario combination.” Most of the protected 3.4% are found in Europe, China, and Japan, which all have extensive coastal urbanization.
Figure V.5 contains the Lincke and Hinkel projections of consequent land loss and human migration by 2100 under the five distinct climate pathways. Land loss is plotted (blue bars) for each climate scenario under the assumptions of no human retreat (i.e., for unpopulated coastal regions), reactive (autonomous) retreat, and proactive (managed) retreat. For reactive and proactive retreat the red bars and right-hand axis represent projections of the numbers of people worldwide who would have to migrate in each climate scenario. The height of each bar in the figure represents the average over the five different SSP scenarios and five different social discount rates considered, while the error bars represent the range of results over those scenarios. According to Lincke and Hinkel, anywhere from 17 million to 72 million people would be displaced from sea level rise in unprotected coastal regions worldwide.
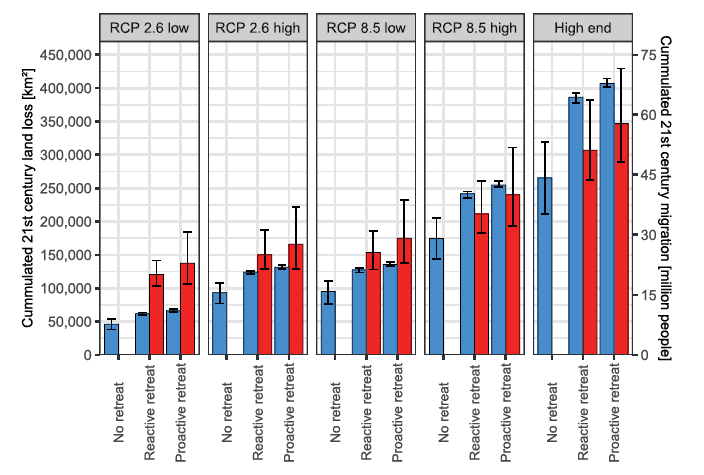
The largest projected land loss in Fig. V.5 occurs for Russia, Canada, and the U.S., which all have long, sparsely populated northern coastlines. However, the largest migration sources are in densely populated countries in South and Southeast Asia, despite protections being the cost-effective approach for coastal mega-cities, such as Mumbai, Chennai, and Kolkata in India and Ho Chi Min City, Hanoi, and Hai Phong in Vietnam. “The highest relative effects (for both, land loss and migration) are obtained for Small Island States with large proportions of low-lying land…” Even under the most pessimistic climate pathway coastal migration within the U.S. is predicted to be considerably smaller than in the Robinson, et al. analysis, because Lincke and Hinkel judge it to be more cost-effective to construct protection for many coastal American cities.
There are in the Lincke and Hinkel analysis still substantial unprotected coastal regions subjected to flooding that encompass significant human population, totaling as much as 24 million people worldwide as of 2015. If human retreat from these regions were not an option, the cost of constructing protective barriers would probably be less than the cost of recovering from frequent flood damage. As the authors point out, “If the retreat option is introduced, however, flood damage costs are reduced through migration, which brings the sum of retreat and remaining flood damage below the cost of protection for the bespoke 24 million people.”
The results of the Lincke and Hinkel cost-benefit analysis for the likely costs of adaptation to rising sea levels are shown in Fig. V.6, without taking social discounts into account. Note that in all scenarios considered the cumulative global adaptation cost during the 21st century is projected to be multiple trillions of U.S. dollars, and for non-migration scenarios tens of trillions. For all scenarios, adaptation costs are reduced by allowing for human migration and are slightly lower when the migration is proactively managed before flooding becomes too regular; in other words, managed migration reduces flood damage costs more than the increase in migration costs. For the optimistic climate scenarios the costs of constructing protection are the largest contributor to total costs, while for the most pessimistic climate scenarios it is human migration costs that dominate. Total adaptation costs are about twice as high for pessimistic than for optimistic climate scenarios. The bar heights in Fig. V.6 represent the average costs over all socioeconomic pathways, while the error bars indicate the lowest and highest costs among those pathways. The migration and flood damage costs (but not the protection costs) differ strongly among socioeconomic pathways because these determine how many people are likely to be living within the coastal floodplain as the sea levels rise.
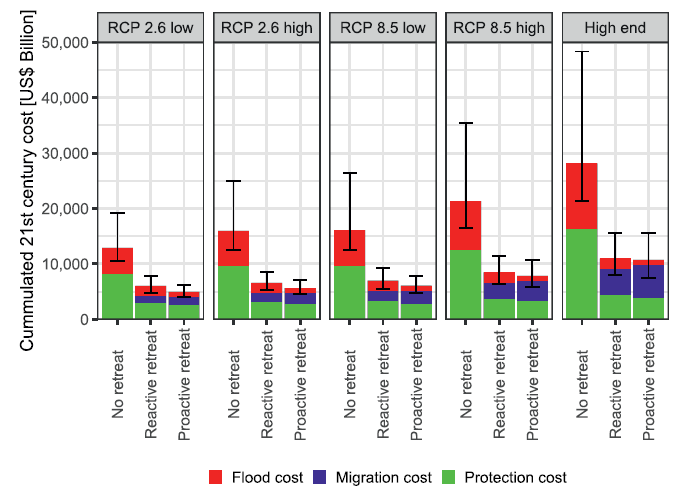
A major additional uncertainty in the cost estimates arises from the wide range of migration costs found in various economic models. In calculations for Fig. V.6, “a per capita migration cost of three times the local GDP [Gross Domestic Product] per capita was used, assuming that capital assets on the land lost need to be deconstructed and fully replaced…” If the per capita migration cost is significantly lower, that would favor retreat over protection, leading to significantly more migrants and more land loss. Higher per capita migration costs would favor protection over retreat. The specific numbers from the Lincke and Hinkel analysis are less important than the trends.
VI. outlook and government preparedness
None of the specific climate migration models we have chosen to describe in Sections IV and V should be considered definitive. Each makes questionable assumptions and omits important considerations. But in combination they are useful to illustrate both the scope of the problem and the many features of climate, demographics, socioeconomic conditions, costs, and possible collateral impacts on the quality of life and the possibility of conflict that must be weighed in order to manage adaptation to upcoming climate change. It is likely that tens to hundreds of millions of people may migrate permanently as a result of climate change impacts this century and that tens of trillions of U.S. dollars will be spent on attempts to adapt to climate change. Mitigation approaches may well be less costly but are running into political opposition in the U.S. and other countries.
Most of the world’s countries are not really prepared to manage large waves of climate-related internal migration. As we have seen in the Syria situation, the secondary impacts of such internal migration can be severe and can lead to massive cross-border migration if governments and civil society do not work effectively to find ways to provide internally displaced people help in finding lodging, jobs, schooling, and services without severely disrupting existing communities. The Syria situation is not a lone example. In our post on Climate and Civilization we have also pointed out that a regional cooling of the European climate during the late 16th and early 17th centuries led to greatly reduced crop yields and earnings, increases in disease, conflicts, and migration, and a General Crisis including the Thirty Years’ War that plagued most of Europe. Furthermore, waves of migrants or even the anticipation of migrants can alter the politics within destination countries, again as was seen in Europe as they handled the influx of Syrian refugees.
While broad international principles for dealing with displaced persons have been laid out, we haven’t really seen them successfully applied yet in cases of mass migration. For example, “The Sydney Declaration of Principles on the Protection of Persons Displaced in the Context of Sea Level Rise recommends that evacuations be undertaken by States only if provided for by law and necessary to protect life and health, and that all evacuations must be carried out with full respect for life, dignity, liberty, and security of evacuees.” But climate-related migrations may not be government-mandated evacuations. The 2030 Agenda for Sustainable Development, adopted by all UN member states in 2015, “recognized forcibly displaced people, including IDPs [internally displaced persons], as a vulnerable group in need of particular attention and calls for full respect for human rights.” The only binding international legal instrument specific to IDPs is the 2009 Kampala Convention of the African Union, which states that “Parties shall take measures to protect and assist persons who have been internally displaced due to natural or human-made disasters, including climate change.” But “protect and assist” are pretty broad terms, easily misapplied by leaders like Bashar al-Assad.
The possibility of cross-border climate migrants has been addressed by the Nansen Initiative launched by Switzerland and Norway during the preceding decade. It led to the creation of the Platform on Disaster Displacement (PDD), “a group of states working together to forge durable solutions for displaced persons in the context of disasters and climate change. The PDD also leverages close partnership between governments, civil society groups, universities, and other key stakeholders, such as IOM, UNHCR, and the UN Environment Program (UNEP), by providing governments with a toolbox to address these challenges and build consensus, through knowledge sharing and consultations.” All fine words, but let’s see them successfully applied as climate migration grows.
In the U.S. Joe Biden’s White House produced a 2021 Report on the Impact of Climate Change on Migration. The report’s major recommendation is to “Establish a standing interagency policy process on Climate Change and Migration to coordinate U.S. government efforts to mitigate and respond to migration resulting from the impacts of climate change that brings together representatives across the scientific, development, humanitarian, democracy and human rights, and peace and security elements of the U.S. Government.” It seems highly unlikely that such coordination will be taken seriously in the second Donald Trump administration, which is most likely to discredit research on climate change and discourage any migrants from coming to the U.S. Political leaders who today willfully deny the science of climate change and refuse to prepare for its impacts repeat the self-centered attitude of Louis XV before the French Revolution: “Après moi, le déluge” (“After me comes the flood”).
references:
Intergovernmental Panel on Climate Change, Climate Change 2022: Impacts, Adaptation and Vulnerability, https://www.ipcc.ch/report/ar6/wg2/
R. Beyer and A. Milan, Climate Change and Human Mobility, International Organization on Migration, 2023, https://www.migrationdataportal.org/sites/g/files/tmzbdl251/files/2023-06/Final5_2023%20Climate%20Change%20and%20Human%20Mobility.pdf
World Bank Group, Groundswell: Preparing for Internal Climate Migration, https://www.worldbank.org/en/news/feature/2021/09/13/millions-on-the-move-in-their-own-countries-the-human-face-of-climate-change
D. Lincke and J. Hinkel, Coastal Migration Due to 21st Century Sea-Level Rise, Earth’s Future 9, e2020EF001965 (2021), https://agupubs.onlinelibrary.wiley.com/doi/full/10.1029/2020EF001965
C. Robinson, B. Dilkina, and J. Moreno-Cruz, Modeling Migration Patterns in the USA Under Sea Level Rise, PLoS ONE 15, e0227436 (2020), https://journals.plos.org/plosone/article?id=10.1371/journal.pone.0227436
DebunkingDenial, Ten False Narratives of Climate Change Deniers, https://debunkingdenial.com/ten-false-narratives-of-climate-change-deniers-part-i/
Institute for Economics and Peace, Over One Billion People at Threat of Being Displaced by 2050 Due to Environmental Change, Conflict, and Civil Unrest, https://www.economicsandpeace.org/wp-content/uploads/2020/09/Ecological-Threat-Register-Press-Release-27.08-FINAL.pdf
L. Huang, Climate Migration 101: An Explainer, Migration Policy Institute, Nov. 16, 2023, https://www.migrationpolicy.org/article/climate-migration-101-explainer
Migration Data Portal, Environmental Migration, https://www.migrationdataportal.org/themes/environmental-migration
S. Schutte, J. Vestby, J. Carling, and H. Buhaug, Climatic Conditions are Weak Predictors of Asylum Migration, Nature Communications 12, article number 2067 (2021), https://www.nature.com/articles/s41467-021-22255-4
DebunkingDenial, Climate and Civilization, Part II: Climate-Related Societal Collapse, https://debunkingdenial.com/climate-and-civilization-part-ii-climate-related-societal-collapse/
C.P. Kelley, S. Mohtadi, M.A. Cane, and Y. Kushnir, Climate Change in the Fertile Crescent and Implications of the Recent Syrian Drought, Proceedings of the National Academy of Sciences 112, 3241 (2015), https://www.pnas.org/doi/10.1073/pnas.1421533112
UN Refugee Agency, Syria Refugee Crisis Explained, March 13, 2024, https://www.unrefugees.org/news/syria-refugee-crisis-explained/
Wikipedia, Shared Socioeconomic Pathways, https://en.wikipedia.org/wiki/Shared_Socioeconomic_Pathways
DebunkingDenial, Climate Tipping Points: Coming Soon to a Planet Near You?, https://debunkingdenial.com/climate-tipping-points-coming-soon-to-a-planet-near-you/
Our World in Data, Urbanization, https://ourworldindata.org/urbanization
J.-M. Bos, Africa Drives Global Urbanization, DW, May 17, 2023, https://www.dw.com/en/africa-drives-global-urbanization/a-65653428
UK Government Office for Science, Foresight Report: Migration and Global Environmental Change, 2012, https://assets.publishing.service.gov.uk/media/5a74b18840f0b61df4777b6c/11-1116-migration-and-global-environmental-change.pdf
DebunkingDenial, Artificial Intelligence: Is It Smart? Is It Dangerous?, https://debunkingdenial.com/artificial-intelligence-is-it-smart-is-it-dangerous-part-i-mastering-games-image-recognition-and-autonomous-driving/
Wikipedia, Hurricane Katrina, https://en.wikipedia.org/wiki/Hurricane_Katrina
Wikipedia, Hurricane Rita, https://en.wikipedia.org/wiki/Hurricane_Rita
The White House, Report on the Impact of Climate Change on Migration, Oct. 2021, https://www.whitehouse.gov/wp-content/uploads/2021/10/report-on-the-impact-of-climate-change-on-migration.pdf
Platform on Disaster Displacement, https://disasterdisplacement.org/
Platform on Disaster Displacement, Sydney Declaration of Principles on the Protection of Persons Displaced in the Context of Sea Level Rise, June 19, 2019, https://disasterdisplacement.org/resource/sydney-declaration/
United Nations Department of Economic and Social Affairs, Transforming Our World: the 2030 Agenda for Sustainable Development, https://sdgs.un.org/2030agenda
African Union, African Union Convention for the Protection and Assistance of Internally Displaced Persons in Africa (Kampala Convention), https://au.int/en/treaties/african-union-convention-protection-and-assistance-internally-displaced-persons-africa
International Organization on Migration, The Nansen Initiative: Disaster-Induced Cross-Border Displacement, https://environmentalmigration.iom.int/nansen-initiative
Wikipedia, Après Moi, Le Déluge, https://en.wikipedia.org/wiki/Apr%C3%A8s_moi,_le_d%C3%A9luge
