
Steve Vigdor, May 27, 2019
1) Strategies Based on Scientific and Economic Modeling

The cartoon above crystallizes the ongoing evolution in the claims made by climate change deniers (mislabeled in the cartoon as “skeptics”). As we have pointed out in our posts on The Science Denier’s Toolbox, the goal of deniers is often to sow doubt that will delay actions to mitigate a problem until it is too late to do anything about it. It is up to citizens, individual actions and, especially, elections to make sure that the deniers fail in the case of climate change. In posts in our Heartland Institute series, we have debunked deniers’ claims that climate change is not happening or not caused by human activities. In this post, we will debunk the idea that it is too late to do anything to ameliorate the effects of climate change.
In one of our posts on Scientific Tipping Points, we have indicated the signs that the tide is turning on climate change. The continuing increase in global mean temperatures is now supported by dramatic, and easy-to-comprehend, graphics. The steadily increasing frequency of severe storms, floods, droughts and forest fires has driven a significant recent rise in American public perceptions that climate change is real, is caused primarily by the burning of fossil fuels by humans, and is likely to cause significant harm to their families and future generations. Major international fossil fuel companies have begun to take notice and to change their investments: ExxonMobil is now investing heavily in the development of carbon capture technology; Shell Oil has recently cut its ties and financial support for groups lobbying against climate change mitigation. In the wake of the 2018 Congressional elections, the U.S. Congress is once again discussing climate change policy.
Much of the political discussion in the U.S. right now is centered on the Green New Deal, an aspirational set of goals put forward by Senator Ed Markey and Congresswoman Alexandria Ocasio-Cortez. The Green New Deal couples very optimistic goals to combat climate change with broad economic concerns about income inequality, access to healthcare and higher education, and it is short on actual policy solution details. It is thus easy for opponents to caricature. But the time has come to stop debating the reality and causes of climate change, and to get back to what politicians are actually elected to do: problem solving.
Fortunately, there are a significant number of groups now working on projecting the impacts of real policy solutions to guide the formulation of public climate, energy and environmental policy going forward. The purpose of this post is to convey a flavor of these projections, which all serve to make a crucial central point: attaining serious reductions in the emission of greenhouse gases will require a coherent strategy addressing multiple aspects of energy production and usage, combined with serious political will to combat the daunting problems that face us after decades of neglect. But the bottom line is that it is, in no way, too late to mitigate the impacts of climate change; the longer we wait to start, the harder it will get, and the more serious and more costly will be the impacts we can no longer prevent.
Several noteworthy articles, books, documentaries and websites report the ongoing efforts at defining achievable policy solutions. Energy Innovation: Policy and Technology LLC is an energy and environmental policy firm that provides high quality research and analysis to policy makers on climate-related issues. Some of their proposals are summarized in Hal Harvey’s book Designing Climate Solutions: A Policy Guide for Low-Carbon Energy. More generally, Energy Innovation has provided publicly accessible simulation software to model the impacts of any proposed policy affecting climate, and we will discuss their modeling and some results below.
Former Secretary of Energy Ernie Moniz and Assistant Secretary for Energy Efficiency and Renewable Energy Andy Karsner have proposed a Green Real Deal approach that combines increased reliance on renewable and low-carbon energy sources, improvements in the efficiency of energy usage in buildings, transportation and industry, and implementation of new technologies for carbon capture, in ways that take account of regional differences in accessibility of some of these solutions. Planning for regional differences is also stressed in simulations from Stanford University that form the heart of The Solutions Project and in simulations carried out by the National Renewable Energy Laboratory. Academy Award-winning documentary filmmaker Charles Ferguson has come out with Time to Choose, a film that covers both the impacts of climate change and ongoing efforts to find viable solutions. Bloomberg Philanthropies has funded America’s Pledge and put out a booklet summarizing the actions currently being taken by a coalition of U.S. states and cities to live up to the pledge the U.S. made during the Obama administration to set its goals for the Paris Climate Accord.
In order to evaluate the projected costs and climate impacts of various proposed policies, we must rely on sophisticated models that take into account the multiple interacting systems that generate and use energy, that emit or capture greenhouse gases, along with the economics, environmental and health impacts of changing or rebalancing technologies or land usage. Figure 1.2 illustrates the complex network of interactions treated in one particular set of models, the Energy Policy Simulator provided by Energy Innovation. This simulator has been subjected to peer review by multiple expert panels and has been applied to date to six different countries, in collaboration with government or non-profit organizations. Included among those countries are the two biggest current contributors to worldwide greenhouse gas emissions: China and the U.S.

The heart of the Energy Policy Simulator deals with the characteristics of various possible energy fuels (including fossil, nuclear and renewable fuels) in energy production (by generating either electricity or heat) and energy usage in industry and agriculture, in buildings, and in transportation. Changes within any of these energy production and usage sectors affect both cost and savings (cash flow), as well as the emission of greenhouse gases and other pollutants. So, too, do policy changes regarding land usage (including, for example, reforestation to increase the natural capture of carbon dioxide) and carbon capture and sequestration (CCS). Ongoing or proposed research and development (R&D) has likely impacts on the efficiency and cost of CCS, of energy usage in all sectors, and of electricity production. The simulator also takes into account the couplings of distinct policy initiatives: the impacts of one policy may be increased or decreased by combining it with another policy. All of these interacting parts, and their sub-units, are described in the overview video of the simulator produced by Energy Innovation.
We will deal with some of the projected impacts for potential U.S. policies evaluated with this Energy Policy Simulator in the next section of this post. Modeling far into the future, say to 2050, is not an exact science: it is especially challenging to predict the outcomes of future R&D and the economic choices that will be made by individuals and industries. But qualitative features of the projections will nonetheless allow us to draw important lessons about what constitutes a coherent strategy that will adequately address the threats of ongoing climate change.
2) An Illustrative Set of Policies and Impacts
In order to set the stage for the desirable goals for new U.S. climate policy initiatives, we illustrate in Fig. 2.1 the profiles of worldwide greenhouse gas emissions necessary to limit global mean temperature increase to various values by the end of this century, and in Fig. 2.2 the current annual emissions sorted by country or region.

Figure 2.1. The profiles of annual worldwide net greenhouse gas emissions (measured in equivalent billions of tons of carbon dioxide emissions) to the atmosphere, as a function of year, for four different climate change scenarios. The reference scenario, continuing “business as usual” from the beginning of this century, would produce a projected increase of global mean temperatures by 4.2°C (or 7.6°F) at the end of the century. The national plans incorporate pledges for greenhouse gas reductions made so far by the countries that have signed the Paris Climate Accord. Plans to limit global mean temperature increases below 2°C require that greenhouse gas emissions decrease, as shown, after about 2030.
The curves in Fig. 2.1 represent possible scenarios for the net worldwide emission during the 21st century of all greenhouse gases, including carbon dioxide (CO2), methane (CH4), nitrous oxide (N2O) and hydro-fluorocarbons (HFCs) used in air conditioning and refrigeration. The effectiveness of the different gases in absorbing and re-radiating infrared heat radiation from the Earth can be measured relative to that for CO2, so that the total annual emissions can be expressed in units of the equivalent billions of tons of CO2. Business as usual from the turn of the century, combined with anticipated growth in worldwide population and gross domestic product (GDP), would lead to the orange “reference scenario” curve reflecting a steady increase more than tripling annual emissions, from the current roughly 40 billion tons per year, by the end of the century. The projected end-of-century temperature rise for that reference scenario is 4.2°C, with catastrophic implications for mass extinctions, worldwide food shortages, massive human migration from coastal areas, increased frequency of natural climate-related disasters, etc.
The blue curve in Fig. 2.1 incorporates national pledges made to date in response to the Paris Climate Accord, and it ameliorates the situation somewhat, but would still lead to unacceptable consequences. The dark and light green curves in Fig. 2.1 illustrate what would be needed to limit end-of-century temperature rise to less than 2°C or, as recommended in the 2018 report of the Intergovernmental Panel on Climate Change, 1.5°C. In either case, it is essential for net worldwide greenhouse gas emissions to begin decreasing toward zero by 2030 or so, because the heat-trapping greenhouse gases already added to the atmosphere will remain there for a long time, even if humans were to add no more. Even in those optimistic scenarios, it is projected that worldwide coral reefs will die off, polar icecaps will continue to melt and sea level will continue to rise, causing more frequent coastal flooding. But many disastrous long-term effects could be avoided.

Figure 2.2 shows that worldwide greenhouse gas (GHG) emissions are dominated by China, the U.S., the European Union, India and Russia. While the U.S. ranks second behind China in total emissions, its per capita emissions are nearly twice as high as those in either China or the E.U. India is currently 4th in total emissions, despite very low per capita emissions, but its anticipated population and GDP growth present daunting challenges for that country to keep its total emissions under control throughout this century. All the signees of the Paris Climate Accord have pledged to reduce their GHG emissions over the coming years. Under the Obama Administration, the U.S. pledged to reduce its annual emissions from 6.5 billion tons CO2 equivalent in 2005 to about 4.8 billion tons by 2025.
Through the year 2017 the U.S. was largely on track to meet its Paris pledge, with reductions attained primarily (as seen in Fig. 2.3) in the electricity generation sector, via the substitution of generation with natural gas and renewables for roughly 40% of coal-fired electric power generation. Those gains were largely driven by market forces, as the prices for natural gas and renewable generation dropped. The rebalancing of the electricity generation sector was further boosted in anticipation of the new guidelines that were proposed in the Obama-era Clean Power Plan (CPP). However, as the economy grew and the Trump Administration worked to discredit climate concerns and repeal the CPP, GHG emissions actually increased by a few percent in 2018.


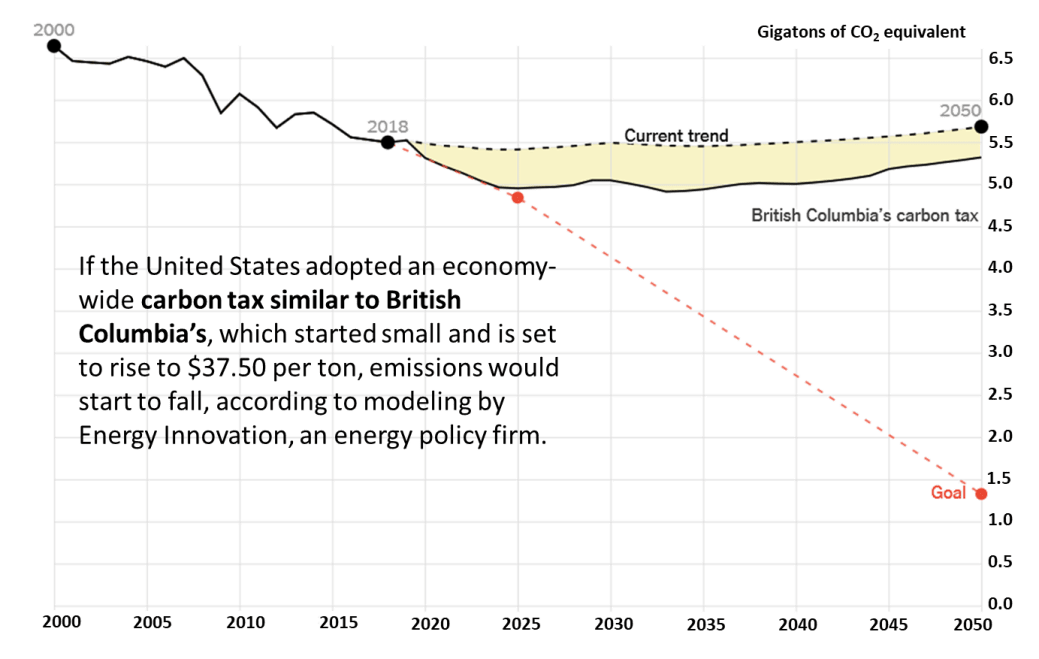
One type of federal climate mitigation legislation that has some bipartisan support in Congress is the implementation of a tax or fee on carbon emissions, preferably with the revenues gained to be returned to citizens in the form of dividends. A possible template to follow is the carbon tax already adopted by the Canadian province of British Columbia and implemented since 2008. Figure 2.5 shows the projected impact of such a tax imposed on U.S. energy generation fueled by coal, oil and natural gas, under the assumption that it begins at $7.50/ton of CO2 equivalent in 2020 and gradually escalates to $37.50/ton by 2033. This policy alone would likely lead to a fairly rapid abandonment of many coal-fired plants and greater reliance on natural gas and renewables, and would allow the U.S. to accomplish much of the 2025 Paris pledge. However, following that initial move away from coal, GHG emissions are projected to stabilize and, once the full tax is “baked into” the economics by 2033 while population expands, to rise slowly thereafter, leaving the country still far short of its 2050 goal.
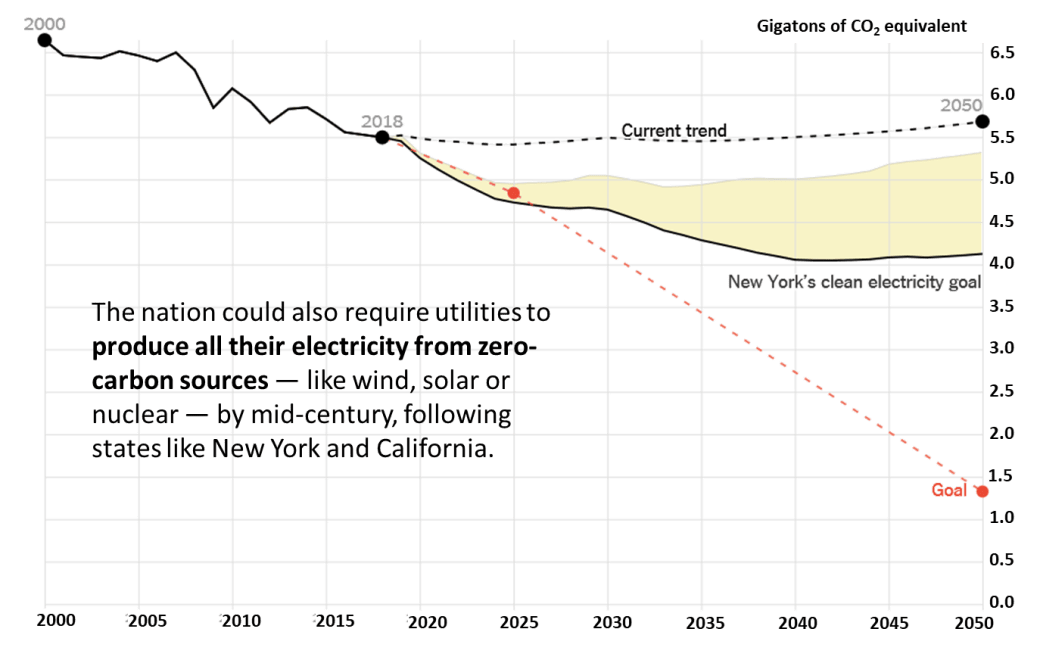
The carbon tax would not eliminate GHG-emitting power plants, but that goal could be separately mandated, as it has been in policies adopted in California and New York State. These states are requiring utilities to steadily increase the percentage of electricity production from carbon-free sources – including wind, solar, nuclear, hydropower, geothermal and biomass – in order to reach 100% renewable electricity production by 2040 in New York’s case or 2045 for California. Figure 2.6 shows the projected significant impact if a comparable policy were to be adopted nationally, and imposed in addition to the carbon tax, to achieve 100% renewable energy production by 2050. As we will discuss in Section (3) of this post, the preferred mix of carbon-free sources would differ from state to state, depending on their access to the different clean sources.
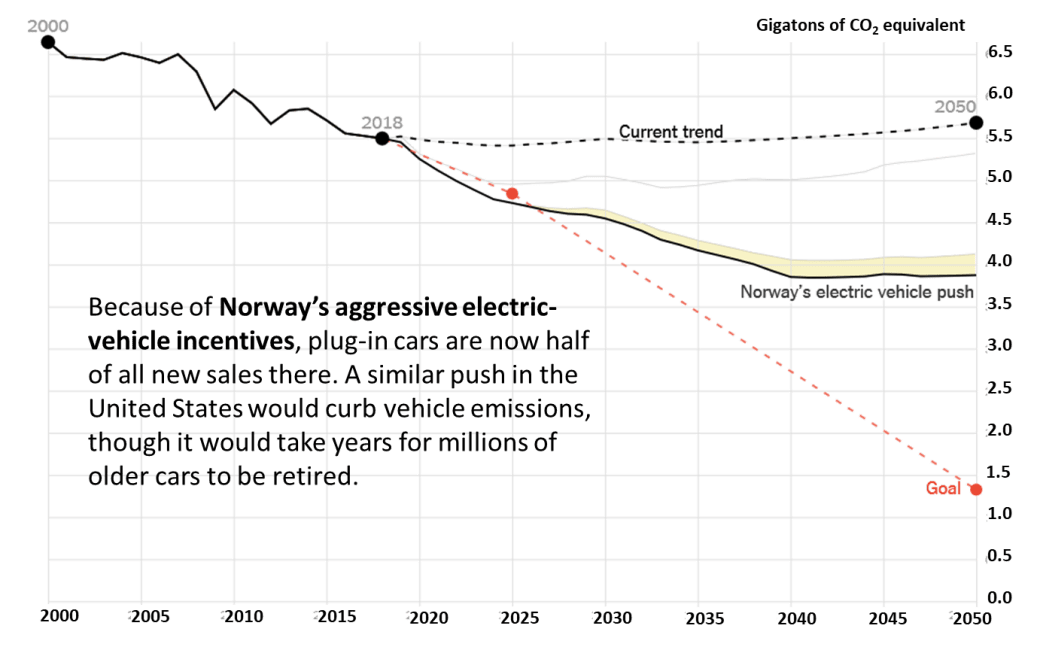
The next policy considered addresses GHG emissions from vehicles. Norway has implemented a set of electric vehicle tax incentives that have increased sales of electric and plug-in hybrid vehicles from 1.6% share of all new passenger vehicle sales in 2011 to 49% in 2018. Figure 2.7 illustrates the projected impact of U.S. policies that would lead to an analogous linear increase in electric vehicle share starting in 2027 and reaching nearly 100% by 2050. The impact of transitioning the vehicle fleet is amplified when the electricity used to recharge vehicle batteries is generated by carbon-free sources. However, the impact remains rather modest because the policy assumed does not affect trucks, buses, ships or airplanes, and it would take a considerable amount of time for older gasoline-powered cars to be retired. Nonetheless it represents an incremental policy worth considering, and one strongly at odds with the disincentive provided by the Trump administration’s proposed rollback of vehicle fuel efficiency standards.
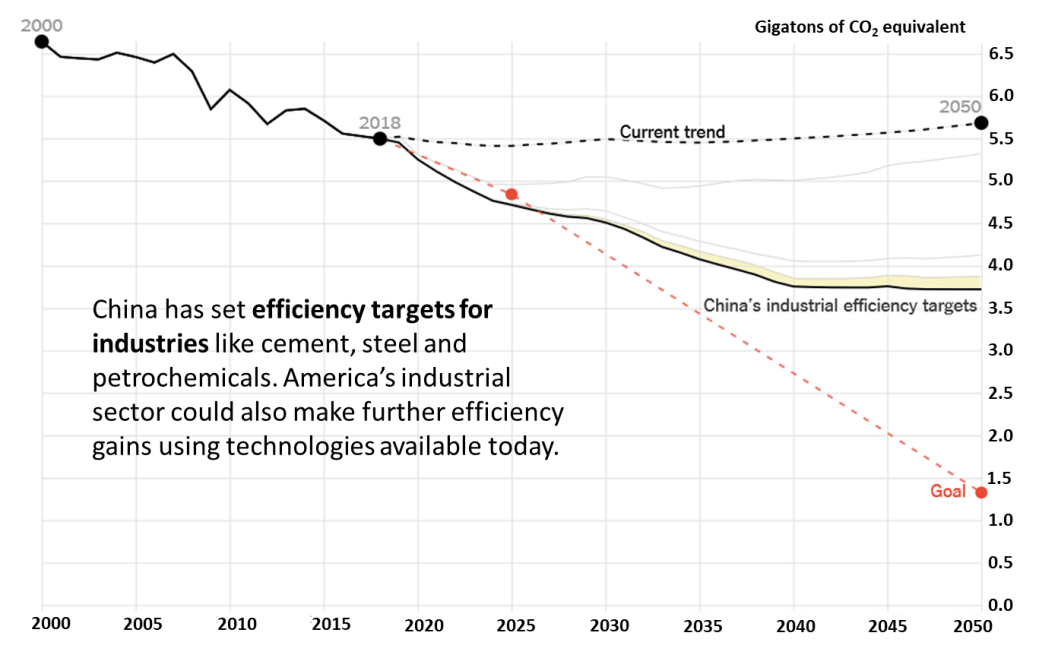
The next two policies considered address the efficiency of energy usage in the industrial and building sectors, and are represented by simulations in Figs. 2.8 and 2.9, respectively. The industrial efficiency targets are analogous to ones set in China, but are actually based on a 2016 U.S. Department of Energy study, which judged that application of existing technologies could lead to energy savings twice as large as those currently expected. The policy simulated in Fig. 2.8 assumes that only half that potential is met by 2050. The building codes assumed in Fig. 2.9 would apply standards already adopted in California to the entire nation. The California Energy Commission calculated in 2016 that those standards would reduce energy-use intensity, in comparison with existing national standards, by 29% for residential buildings and by 13% for commercial buildings. The policy simulated assumes that similar reductions could be achieved nationally by 2050, but applying only to new buildings. The projected reductions in GHG emissions achieved by the efficiency improvements in Figs. 2.8 and 2.9 are modest because the policies are added to the carbon tax and the mandate to move toward carbon-free electricity production, which already accomplish (see Figs. 2.5 and 2.6) much of the GHG reductions targeted by the efficiency improvements.

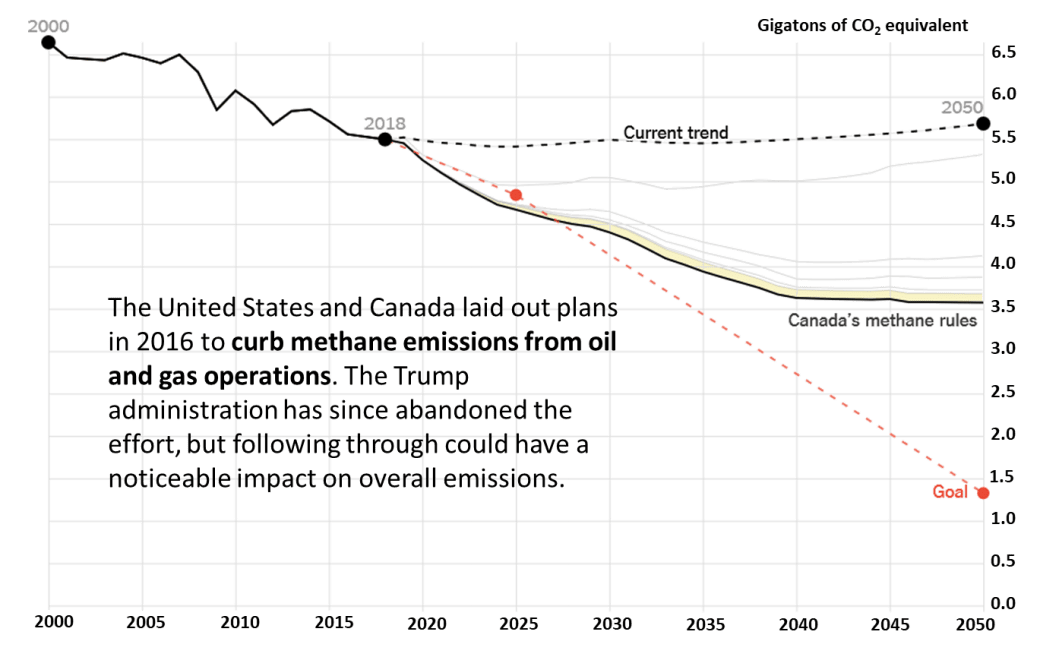
Methane is one of the most potent greenhouse gases at trapping infrared radiation. In addition to its emission in coal mining, landfills, melting Arctic permafrost, and from microbes in the stomachs of cows, sheep and goats, large quantities of methane are emitted in oil and gas operations. Methane is, in fact, the main component of natural gas, and some is released to the atmosphere via leaks from wells, pipelines or processing equipment. The same is true in petroleum processing. The oil and gas industries are presently responsible for about one-third of all U.S. methane emissions. The U.S. and Canada agreed on plans in 2016 to reduce these emissions from oil and gas processing, but the Trump administration has since abandoned that effort. The policy treated in Fig. 2.10 would reduce U.S. methane emissions from oil and gas processing by 40% below currently projected levels by 2030. That is similar to the goals of the Canadian policy, whose aim is to accomplish those reductions by 2025.
The final policy simulated here (see Fig. 2.11) addresses a different set of greenhouse gases unaffected by any of the previously considered policies. We have addressed elsewhere on this site the worldwide replacement of chlorofluorocarbons (CFCs) for use in air conditioning, refrigeration, aerosols and foams, as per the global Montreal Protocol to counteract the depletion of the stratospheric ozone layer. The initial replacement for CFCs were HCFCs (hydrochlorofluorocarbons), which had reduced, but still not negligible, ozone depletion potential. These have now been replaced in many countries by HFCs, which contain no chlorine and thus do not act at all to deplete ozone. However, as shown in the table in Fig. 2.12, some of the HFCs are rather potent greenhouse gases, and their emission contributes significantly to global warming. This recognition led the countries of the world to adopt in 2016 the Kigali Amendment to the Montreal Protocol, which mandates a staged phase-down in the production and consumption of HFCs, according to the schedule depicted in Fig. 2.13 for countries that sign the agreement. Some countries are already beginning to transition to the use of hydrocarbons, such as a mixture of propane and isobutane, as an environmentally friendly alternative to HFCs.
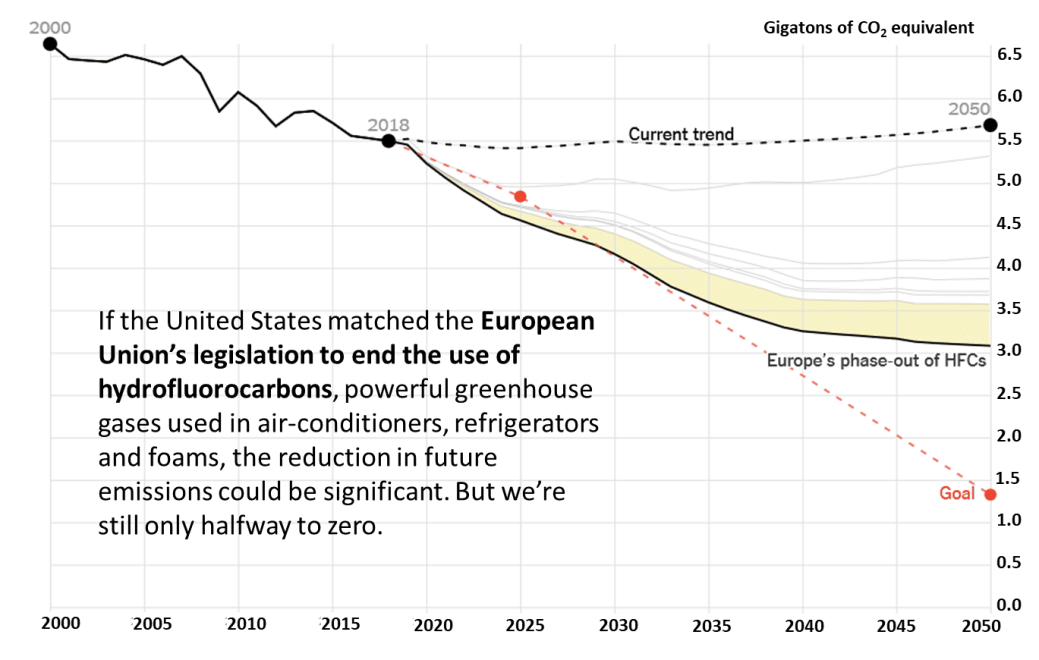
The U.S. has signed, but not yet ratified, the Kigali Amendment. The U.S. Environmental Protection Agency adopted in 2016 a regulation that would have phased out the use of HFCs in appliances, in keeping with the spirit of the Kigali Amendment. However, in September 2018 the EPA under the Trump administration has proposed to rescind that regulation. The policy treated in Fig. 2.11 assumes that the U.S. adopts a similar approach to the European Union, leading to a 96% reduction in HFC emissions by 2050. As seen in the figure, the GHG impact of such a policy is substantial, and largely independent of the other policies considered.


The bottom line from Fig. 2.11 is that the suite of policy proposals considered above – all of which are based on policies within the realm of reason that have already been adopted in individual states or other countries – would most likely allow the U.S. to exceed its Paris Accord pledge by 2025. However, they would still fall short of the lofty goal set by the Obama administration for 2050. The details of projections out to 2050 should not be taken too seriously, as they could easily be affected by development of new technologies, by changes in economic circumstances, and by changes in public perceptions and politics. But the simulations do make clear that it is plausible for the U.S. to reduce its overall GHG emissions by a factor of two from 2005 to 2050, and such a reduction is consistent with the dark green “<2°C path” curve in Fig. 2.1. The main takeaway, though, is that there is no single “silver bullet,” a point also emphasized in the Green Real Deal discussions led by Moniz and Karsner.
It will take a suite of coherent policies based on science and serious modeling, addressing most, if not all, of the sectors included in Fig. 1.2, and a considerable transformation of the U.S. economy. The needed economic transformation away from fossil fuels is not so different in time scale from the technologically driven ones that have already occurred in association with the development of solid state electronics in the mid-20th century or the personal computing revolution of the late 20th and early 21st century. As in those cases, the transformation will establish many jobs in new economic sectors. If the political will to institute such a coherent strategy at the federal level remains absent in Congress and the White House, many of the policies can still be implemented at the level of individual states. Indeed, 23 states plus Puerto Rico have so far joined the U.S. Climate Alliance committed to meeting goals of the Paris Accord, even as the federal government shirks its responsibility.
It is also important to point out that the exercises in Figs. 2.4-2.11 consider so far only policies aimed at reducing the emissions of GHGs and the usage of the fuels that produce them. There is also substantial development worldwide on efforts to increase the removal of carbon dioxide from the atmosphere. For example, massive reforestation projects have been launched in China, Australia, Pakistan, Africa (the Great Green Wall), Brazil and other countries. The Chinese project, for example, already increased carbon capture by vegetation by 0.8 billion tons between 2003 and 2012.
Meanwhile, various commercial companies – e.g., Climeworks in Switzerland and Carbon Engineering in Canada – are working to perfect technologies for the non-natural capture and removal of carbon dioxide directly from the air. The basic approach of these technologies is to develop plants at which ambient air can be sucked into units where CO2 can be chemically filtered out and captured, so that the units then release air freed from carbon dioxide. Once filters are saturated with CO2, they can be heated to release the CO2 as a concentrated gas stream to store, supply to customers, or use to generate synthetic fuels. The capture plants themselves can operate on low-grade waste heat or renewable energy. The first commercially operational pilot plant near Zurich is pictured in Fig. 2.14.

Carbon Engineering has a prototype plant in Squamish, British Columbia that currently removes about a ton of carbon dioxide per day. They estimate that a full-sized version of the Squamish plant will be capable of removing about a million tons per year. If 400 such plants could be built and operating in the U.S. by 2050, the net contribution to GHG emissions reductions would be comparable to that projected in Fig. 2.5 for the institution of a British Columbia style carbon tax. This is not a cheap solution. Operating costs are expected to run on the order of $100 per ton of CO2 captured, so a program to capture 0.4 billion tons per year in the U.S. would carry an operations tab on the order of $40 billion/year, over and above the considerable capital investment to build all the plants. But this technology has the potential to form a significant part of a coherent strategy to avoid costs far exceeding that sum in climate change impacts.
It is not too late to formulate such a coherent strategy to combat anthropogenic climate change, based on policy options highlighted here or others under consideration, but there is a real sense of urgency to get going on this formulation in earnest. In the next section, we will turn our attention to a more detailed discussion of how one might accomplish the single most effective policy considered above, namely, the transition to renewable electricity production.
3) A Different Template for Every State
The National Renewable Energy Laboratory (NREL) is housed in Golden, Colorado and funded by the U.S. Department of Energy. In 2012, NREL produced a Renewable Electricity Futures Study that assessed the technical feasibility of reaching various levels, from 30% to 90%, of U.S. electricity production from renewable sources by 2050. The study explored electric “grid integration issues using models with unprecedented geographic and time resolution for the contiguous United States.” The very detailed analysis led to the central conclusion “that renewable electricity generation from technologies that are commercially available today, in combination with a more flexible electric system, is more than adequate to supply 80% of total U.S. electricity generation in 2050 while meeting electricity demand on an hourly basis in every region of the United States.” The more flexible electric system “needed to enable electricity supply-demand balance with high levels of renewable generation, can come from a portfolio of supply- and demand-side options, including flexible conventional generation, grid storage, new transmission, more responsive loads, and changes in power system operations.”

Figure 3.1 illustrates the mix of technologies assumed for each assessed scenario in the NREL study. The baseline scenario projects a largely conventional electricity generation system with minimal growth of renewables from their present U.S. market share, coupled with improvements in energy usage efficiency and electric vehicles that keep overall electricity consumption roughly constant from 2010 through 2050, even as the U.S. population grows. The renewable sources assumed to substitute for coal and natural gas production in the other scenarios include wind, solar, hydropower, geothermal and biomass.
Solar production is furthermore subdivided into two technology classes: photovoltaics (PV) that utilize the photoelectric effect and familiar solar panels to directly convert sunlight to electricity; and concentrating solar plants (CSP) that focus sunlight to heat a material that can then be used either to directly transport heat or to drive steam generators to operate turbines that produce electricity (see Fig. 3.2). CSPs utilize the same basic approach you may have used to burn a piece of paper with sunlight focused by a magnifying glass, but scaled up enormously and relying on curved mirrors rather than lenses to do the focusing. You can get a feeling for the scale from the photograph in Fig. 3.3 of a CSP near Seville, Spain, featuring thousands of mirrors, each with a tilt adjusted throughout the day to keep sunlight focused on the same receiver atop the central tower. Several CSPs are currently operating in the U.S., primarily in southwestern states where both sun and land are abundant.


While Fig. 3.1 illustrates the average national share of each renewable technology for each assessed scenario, it is the variety of renewable sources that allows each region of the U.S. to contribute substantial renewable electricity supply by 2050, despite considerable regional differences in the local renewable resource base. Those regional differences in resource availability are summarized in Fig. 3.4. Geothermal energy and hydropower are already largely exploited where they are available – in the western U.S. for geothermal and except in the midwest for hydropower – so they are not projected to grow rapidly as the renewable energy share increases in Fig. 3.1.

The rapid growth renewables envisioned in Fig. 3.1 are wind, solar and biomass. As seen in the lower right-hand map of Fig. 3.4, access to wind power is especially prevalent in the Great Plains – where it already represents a rapidly growing share of electricity production in states such as Iowa, South Dakota, Kansas, Oklahoma and Texas – and is likely to be exploited far more in coming years at offshore sites. Solar power is accessible over much of the country, but especially in the southwest, where land availability also allows for the construction of new CSPs. Biomass is broadly accessible, except for a few western states.
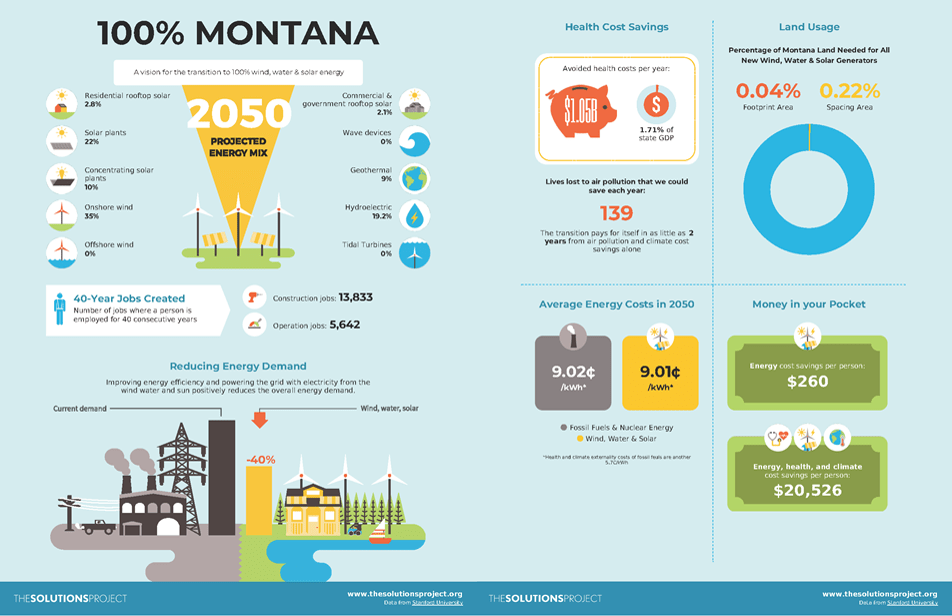
Taking such resource distributions into account, it becomes possible to design a renewable energy transition tailored to the needs and opportunities of each individual state. This is precisely what is being done by The Solutions Project, a non-profit collaboration of celebrities, scientists and business people dedicated to moving the world toward 100% renewable electricity production. State-by-state analyses are based on modeling by Mark Jacobson, the Director of the Atmosphere and Energy Program at Stanford University. Jacobson’s simulations focus on the roles of wind, water and solar power, neglecting biomass because its burning can also contribute to air pollution. In addition to considering the mix of renewable sources appropriate to each state by 2050, Jacobson’s analyses estimate how the transition will affect electricity costs, job creation, land usage and health and climate cost savings. Estimates of land usage for new electricity generation plants take into account both the immediate footprint needed for the generating units and the additional “spacing area” needed for some of the considered technologies, such as the safety buffer zone required around nuclear power plants. Wind, wave and tidal power generation require space between turbines or other devices to reduce the effects of turbulence and energy dissipation caused by one device on the performance of others nearby.
Jacobson’s projections are illustrated in Figs. 3.5-3.7 below, for three representative states, including inland western (Montana) and midwestern (Indiana) states and one mid-Atlantic state (North Carolina) with substantial available shoreline for offshore wind installations. Electricity production in 2017 differed dramatically among these three states, with carbon-free sources providing 47% of electricity consumed in Montana (dominated by hydroelectric power), 42% in North Carolina (dominated by nuclear), but only 6% in Indiana. Coal-fired plants currently provide 49% of electricity in Montana, 27% in North Carolina and 73% in Indiana. In Figs. 3.5-3.7 all three states are projected to a 2050 future completely dependent on renewables for electricity production, but with a quite different mix in each state. A renewable future would get comparable contributions from wind and solar energy in both Indiana and North Carolina, but with the wind power coming exclusively from onshore farms in Indiana and primarily from offshore farms in North Carolina. In contrast, Montana’s electricity would involve a broader mix, with substantial contributions from hydroelectric and geothermal power.


The central take-away message from all the simulations discussed in this post is that various groups are providing the sort of detailed modeling necessary for intelligent policy planning for a U.S. future featuring greatly reduced GHG emissions and power production dominated by renewable sources. Sensible mitigation of climate change impacts can be implemented over the coming few decades, if only citizens generate the political will to stop dithering and start serious strategizing.
References:
https://www.gp.org/green_new_deal
H. Harvey, et al., Designing Climate Solutions (Island Press, 2018) (https://www.amazon.com/Designing-Climate-Solutions-Policy-Low-Carbon/dp/1610919564)
https://energyinnovation.org/wp-content/uploads/2016/04/Climate_HowToWin-final.pdf
https://www.energypolicy.solutions/
https://www.cnbc.com/2019/03/11/what-america-needs-is-a-green-real-deal-top-energy-experts-say.html
https://www.bloomberg.com/news/videos/2019-04-16/ernest-moniz-offers-a-green-real-deal-video
NREL Renewable Electricity Futures Study, Executive Summary (https://www.nrel.gov/docs/fy13osti/52409-ES.pdf)
https://www.bbhub.io/dotorg/sites/28/2018/09/Fulfilling-Americas-Pledge_Executive-Summary_2018.pdf
https://en.wikipedia.org/wiki/Clean_Power_Plan
http://multimedia.3m.com/mws/media/1365924O/unep-fact-sheet-kigali-amendment-to-mp.pdf
https://www.usclimatealliance.org/
https://en.wikipedia.org/wiki/Reforestation
https://earthtalk.org/reforestation-in-china/
https://www.greatgreenwall.org/about-great-green-wall
https://en.wikipedia.org/wiki/Carbon_Engineering
https://en.wikipedia.org/wiki/Concentrated_solar_power
https://seia.org/initiatives/concentrating-solar-power
https://en.wikipedia.org/wiki/Mark_Z._Jacobson
https://www.eia.gov/electricity/data/state/
M.Z. Jacobson, Review of Solutions to Global Warming, Air Pollution and Energy Security, http://web.stanford.edu/group/efmh/jacobson/Articles/I/ReviewSolGW09.pdf
