
February 12, 2019
When the phrase “tipping point” has been used in discussions of climate change, it has most often been in the negative sense of a threshold for irreversible change in some aspect of Earth’s environment, as a consequence of global warming. But one may also consider the possibility of reaching tipping points in public perception of the severity of the problem and in global action to mitigate the impacts of climate change. In this post we consider whether lessons learned from the tipping points achieved in the 1980s for the case of ozone depletion in the stratosphere may inform strategies for reaching tipping points for global action on climate change, and whether these may be reached before too many features of the environment suffer irreversible damage.
1. Climate Tipping Elements
Detailed consideration of a wide variety of impacts of global warming, especially by the Intergovernmental Panel on Climate Change (IPCC), has identified a significant number of environmental elements subject to possible threshold behavior. These so-called “tipping elements” are summarized in Fig. 1.1, reproduced from the Environmental Defense Fund website. These elements include melting polar ice caps, dying coral reefs, changing ocean currents, increasing acidification and oxygen depletion in Earth’s oceans, dying forests, melting permafrost and glaciers, drying lands and greening deserts in different areas of the planet.

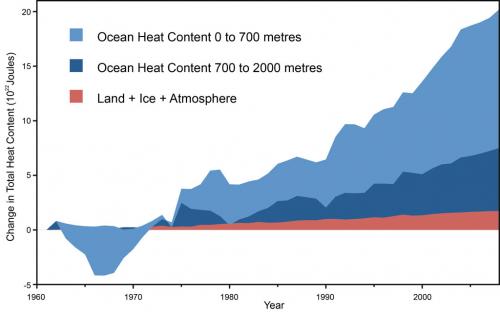
Many of these changes indicated in Fig. 1.1 are driven by the heat stored in the oceans. Water has a relatively high heat capacity: it takes a large amount of heat energy to raise the temperature of water by 1°C, to match the temperature increase in surface air. For this reason, as indicated in Fig. 1.2, more than 90% of the heat trapped by greenhouse gases in the atmosphere and returned to Earth has been stored in the oceans. The amount of heat energy stored is staggering: since 1970, the heat content of Earth’s oceans has increased by 200 billion trillion joules, an amount of energy equivalent to about 300 years of worldwide energy consumption at present rates! This stored heat is a “gift” that will keep on giving. It will continue for a long time to contribute to the thermal expansion of the oceans and the melting of polar ice that dominate global sea level rise. It will modify ocean currents and spawn more intense storms.
As suggested by the color coding in Fig. 1.1, the prediction of environmental impacts of ocean heat and increasing surface temperatures is not an exact science. There are many interacting elements of the environment. Thus, some of the elements considered in the figure need further research to make more reliable predictions. Others are currently expected to undergo only gradual change, not necessarily characterized by a tipping point. Still others may reach tipping points, but only in the relatively distant future. But the most immediate threats, from melting polar ice and dying coral reefs, have already reached critical levels.
Arctic summer sea ice has been disappearing at faster rates than predicted by the most pessimistic global climate models. The rate of Antarctic ice melt has increased by a factor of 6 since the 1970s. Warming ocean waters can eat away at the sea ice from below. And the melting ice hurts in two ways. It contributes to global sea level rise. But it also reduces the reflection of incident sunlight, speeding up warming at the poles and accelerating the ice melt even further.
For this reason, climate scientists are concerned that we may already have reached tipping points for Arctic and Antarctic ice melt. The inevitable change following such a tipping point may unfold slowly, but inexorably. For example, it is estimated that a complete collapse of the West Antarctic ice sheet may take centuries to play out, but could end up resulting in a net rise of global sea levels by 16 feet. A tipping point for the complete melt of the Greenland ice sheet may be reached later this century, when global mean temperatures have risen by 2°C above levels at the start of the 20th century. Again, the complete melt would take place over subsequent centuries, and could increase global sea levels by an additional 20 feet. But don’t be fooled by the slow unfolding of the impact. Whether or not we reach the tipping point is likely to be determined by global actions during the next decade.
The planet’s coral reefs are already under severe threat. Healthy corals maintain a symbiotic relationship with the algae that provide their primary food source, and the corals in turn support diverse marine life. As the oceans warm and become more acidic, the algae are expelled from the corals in an often fatal process called coral bleaching. According to a 2018 IPCC report, the corals are likely to undergo irreversible collapse by the time global temperatures have increased by 1.5°C. We are already at 1°C increase and are likely to reach 1.5° before mid-century, given current rates of greenhouse gas emissions.
At this point, we may simply have to plan measures to accommodate changes associated with tipping points already passed or imminent. But we still have to reduce global greenhouse gas emissions substantially and in the immediate future, in order to avoid reaching even more, and more damaging, climate tipping points.
2. What Can We Learn from the Tipping Points for Global Action on Ozone Depletion?
A number of the same “Merchants of Doubt,” using the same tools from the science denier’s toolbox, have been involved in attempts to discredit the science behind the ozone layer depletion and global climate change. So perhaps we can learn from the success in finding global solutions to the former problem, to develop strategies for attacking the latter.
There are a number of important similarities between the ozone and global warming controversies. Both are global problems, in which emissions from all countries affect Earth’s atmosphere, and require global solutions. In both cases, the science underlying the primary mechanisms of change is well understood, but the impacts are amplified by secondary effects arising from the many interacting parts of the atmosphere and the environment. Scientific consensus about the nature and urgency of both problems has been attained with the aid of sophisticated models. But in both cases, public confusion over the science remained after scientific consensus was reached, opening opportunities for the deniers to exploit. Both the CFCs that were responsible for ozone depletion and the greenhouse gases now responsible for heat trapping remain in the atmosphere long-term. Thus, in both cases, net emissions have to be reduced toward zero to avoid exacerbating the problem, and even then recovery will take a long time.
There are, however, also a number of critical differences. Science denial has been established more completely as an aspect of political identification in the case of climate change. A much larger component of the world’s industrial economy is involved in greenhouse gas emissions, and in resisting climate change science and implications. The impacts of climate change are more diverse than those of ozone depletion, and hence, it is more challenging to get the public to focus on a few impacts that may affect them personally. There is a much larger worldwide scientific community currently engaged on the issues of climate change. And the 21st century explosion in social media and partisan news sources has made it much easier for those who wish to avoid exposure to inconvenient facts.
The Montreal Protocol adopted to drive global elimination of CFCs has provided a template for the Paris Climate Accord to address global reductions in greenhouse gas emissions. In the case of the ozone layer, the global accord among governments followed the clear tipping points. But this does not seem to be the case for the Paris Climate Accord, with the announced U.S. withdrawal from the accord as clear evidence that acceptance of the urgency for mitigating action is not yet sufficiently widespread.
But consider the two tipping points we identified in our posts on the ozone layer, and let’s see how current developments on climate change may stack up in comparison. The first ozone tipping point was associated with rapid growth in public awareness and concern about the problem, driven by the discovery of rapid changes in the atmosphere above Antarctica, combined with compelling visualizations of the changes that were easily absorbed by the lay public. As illustrated in Fig. 2.1, NASA is currently providing comparably compelling graphics to visualize the rapid ongoing warming of the globe. On its climate web site NASA has archived measurements of mean annual surface temperatures as a function of location and year, from 1884 to the present, and provided a clear visualization of the resulting temperature maps. The four frames in Fig. 2.1 represent typical snapshots of these global temperature maps at approximately 16-year intervals starting in 1970, when the current global warming trend began in earnest.
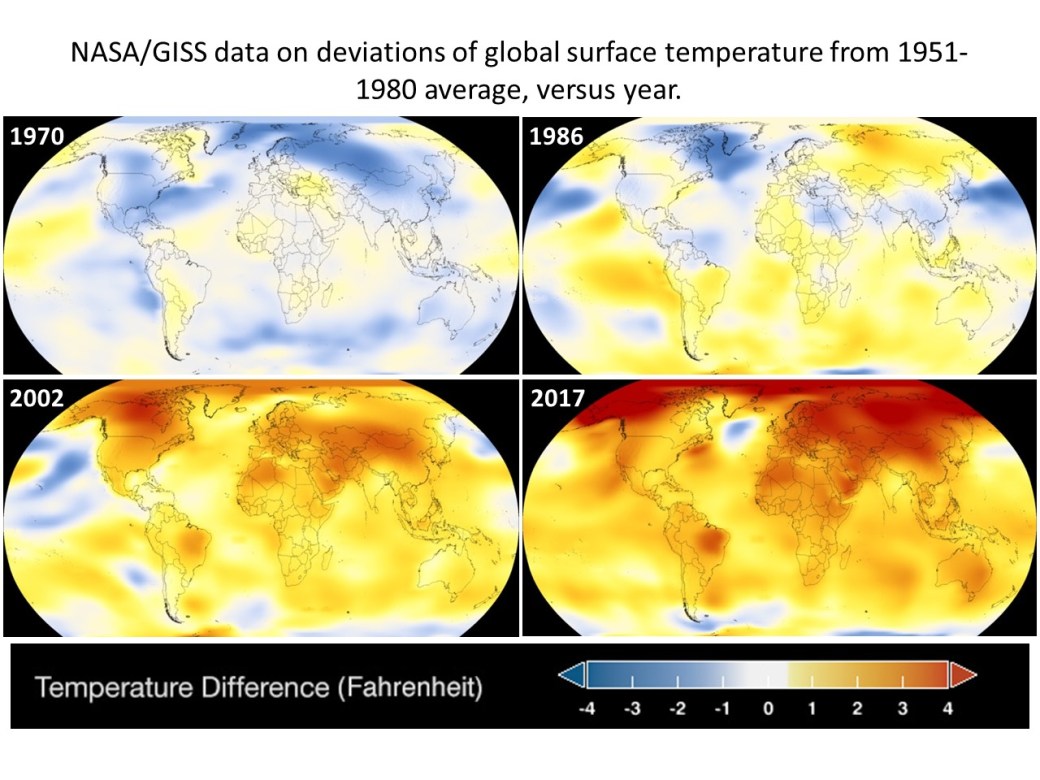
The global warming trend should be clear to all from these temperature maps. In particular, the maps show that the warming is more severe at some locations than at others, with the mean temperatures in many northern hemisphere locations now nearly 4°F higher than a half-century ago.
In the case of ozone depletion, public concerns were intensified by fears of a single type of impact, namely, a rapid growth in the incidence of skin cancer. Climate scientists often confuse the public by presenting too diverse a set of potential impacts of global warming, as for example in Fig. 1.1, some with implications that seem far off. In order to reach a tipping point in public perceptions, it is important to stress impacts the public can feel presently and perceive as short-term threats.
The most promising examples here arise from the rapidly increasing worldwide frequency of severe storms, floods, droughts and forest fires. This claim is not based, as many deniers suggest, on anecdotal evidence, but rather on actuarial evidence. The statistics in Fig. 2.2, reported by the giant reinsurance company Munich RE, demonstrate that the frequency of severe storms, floods, droughts, fires and extreme temperature incidents has tripled since 1980. Over the same period, the frequency of geophysical disasters not associated with climate change, such as earthquakes, tsunamis and volcanic activity, has remained approximately constant. As more people feel the effects of severe climate-induced disasters, public perceptions about climate change are beginning to turn, as we will discuss in a later section.

Changes in public perception alone were necessary but not sufficient to trigger a global accord to combat the ozone layer depletion. Those changes had to be supported by the second tipping point, the acceptance of the changes by an affected global industry leader. In that case, DuPont recognized the science and saw a way to profit from the crisis by developing its own alternative to the responsible chemicals. They then provided leadership in getting the entire relevant industry to go along with the plan to eliminate CFCs, even as many in the denial industry they had previously funded continued to cast doubt upon the science.
We are now beginning to see analogous acceptance of the reality of climate change by leading fossil fuel companies, who are presumably searching for ways to profit by addressing it. This change is exemplified by the recent assessment document 2018 Outlook for Energy: A View to 2040, put out by ExxonMobil (see Fig. 2.3). In the document, ExxonMobil provides serious research projections of global growth expected by 2040 in world population, gross domestic product (GDP) of many countries, energy demand in various sectors of the global economy, energy efficiency, and renewable energy production, all in light of ongoing global warming.

3. The Global Challenge
The ExxonMobil document highlights the greatest challenge facing global action to combat climate change, namely, that greenhouse gas emissions must be reduced while worldwide demand for energy increases due to population and economic growth. The challenge can be illustrated by a number of graphs below, reproduced from the ExxonMobil outlook document.
Figure 3.1 illustrates the clear correlation that exists today between the per capita levels of GDP and of electricity demand in the countries of the world. The figure makes it clear that half the world’s population resides in countries that currently have less than one-fourth of U.S. per capita GDP. Even the enormous population of China lives now with no more than one-third of U.S. per capita GDP. The right-hand frame in Fig. 3.1 shows ExxonMobil’s projected doubling of world GDP by 2040, with much of the growth fueled by emerging economies in countries that are not currently members of the Organisation for Economic Cooperation and Development (OECD).

The projected GDP growth will drive an increase in worldwide energy demand. But continuing improvements in the efficiency of energy usage can at least temper the growth in demand to be considerably less rapid than that in GDP, as illustrated in the left frame of Fig. 3.2. In fact, those efficiency improvements are projected to lead to a slight decrease in energy demand within OECD countries. Part of that decrease arises from a significant anticipated reduction in household electricity usage within North America, although that trend will be counterbalanced by increases elsewhere, as illustrated in the right-hand frame of Fig. 3.2.

Even as global energy production must increase to meet growing demand, the emission of greenhouse gases will be tempered by changes in the transportation and energy production industries. For example, Fig. 3.3 illustrates ExxonMobil’s projections for the rapid growth of electric vehicle usage and for the relative growth in energy production via renewable and natural gas sources, in comparison with other fuels. In particular, wind and solar production are projected to increase their combined share of electricity delivery by a factor of 3—4 by 2040, reaching 22% of the market in North America and 17% worldwide.

When all the factors considered in the ExxonMobil projections – driven by market, technology and government policy trends – are taken into account, the net effect is to stabilize the annual rate of global CO2 emissions by 2040, as illustrated in Fig. 3.4 by region (in the left frame) and by energy usage sector (right). But as illustrated in Fig. 3.5, that performance still falls short of the emissions reductions needed to limit cumulative CO2 concentrations in the atmosphere to 450 parts per million and the attendant global mean temperature rise to 2.0°C by 2100. ExxonMobil has done energy sector projections in the past, but the 2018 report is the first time they have compared their projections to global climate model scenarios. The shortfall illustrated in Fig. 3.5 again begs the question with which we opened this post: can we reach a tipping point for global action to reduce greenhouse gas emissions before the global climate passes more thresholds for irreversible environmental changes?


4. Are Public Perceptions of Climate Change Evolving?
Tipping points in public opinion are best determined in retrospect, when one can see trends in data over many years. But there are encouraging signs from periodic polling about American climate change attitudes carried out by the Climate Change Communication Centers at Yale and George Mason Universities. Some of these recent polling trends are shown in Figs. 4.1 and 4.2. In December 2018, 51% of respondents said they were either extremely or very sure that global warming is happening (while 73% think it is happening), reflecting an increase by 14% over just the last three years (Fig. 4.1). In contrast, only 7% of respondents claimed to be extremely or very sure that global warming is not happening. The apparent turn in public opinion, following a decade of intense negative propaganda casting doubt on climate change, is likely triggered by the surge in severe storms, floods, droughts and forest fires experienced worldwide, and especially in the U.S., over the last few years.

Similar recent trends are seen in Fig. 4.2, in response to the question of whether respondents think global warming is caused primarily by human activities or alternatively by natural environmental changes. The past three years have seen an increase by 10% (up to a current total of 62%) in the percentage of Americans who attribute warming to human activities, accompanied by a decrease of 10% (down to a current total of 23%) over just the past year among those who blame nature.

Figure 4.3 shows that half to three-quarters of respondents now believe that global warming will cause significant harm, although many more believe that people other than themselves and their own families will be the primary victims. In particular, nearly 60% of respondents believe that future generations will suffer a great deal of harm. These changes in public perceptions are not yet reflected in U.S. government policy, but the trends suggest that they may drive policy reconsiderations in the short-term future.

In short, following the template established in the ozone layer depletion case, conditions now seem ripe for reaching tipping points for global action to mitigate climate change. Time will tell whether such action will occur in time to avoid disastrous and irreversible environmental consequences.
References:
Global Warming of 1.5°C, an IPCC Special Report 2018
Casey Ivanovich and Ilissa Ocko, Everything You Need to Know About Climate Tipping Points, Environmental Defense Fund blog (2017)
Ice Loss from Antarctica Has Sextupled Since the 1970s, New Research Finds, Washington Post, January 14, 2019
LuAnn Dahlman and Rebecca Lindsey, Climate Change: Ocean Heat Content, August 1, 2018
Naomi Oreskes and Erik Conway, Merchants of Doubt: How a Handful of Scientists Obscured the Truth on Issues from Tobacco Smoke to Global Warming (Bloomsbury Press, 2010)
Global Climate Change: Vital Signs of the Planet, NASA climate website
Munich RE NatCatSERVICE, Natural Catastrophe Statistics Online
ExxonMobil 2018 Outlook for Energy: A View to 2040
A. Leiserowitz, et al., Climate Change in the American Mind: December 2018, Report of the Yale Program on Climate Change Communication and the George Mason University Center for Climate Change Communication
