
September 24, 2026
IV. Case Studies of a Few Taxonomic Classes at Elevated Risk
It helps to understand the detailed impacts of the primary drivers discussed in the preceding section by focusing on a few case studies of taxonomic classes at elevated risk of population loss and possible extinction. Here we focus on coral reefs, North American birds, and amphibians worldwide.
Warm-Water Coral Reefs:
Coral reefs are among the most ecologically diverse and valuable ecosystems on Earth. On coral reefs, one finds “more species per unit area than any other marine environment, including about 4,000 species of fish, 800 species of hard corals and hundreds of other species.” Warm-water coral reef systems support a great deal of fishing, for roughly half the U.S. managed fisheries. “The National Marine Fisheries Service estimates the annual commercial value of U.S. fisheries from coral reefs is over $100 million, and recreational value constitutes another $100 million.” Worldwide, it is estimated that reef systems provide livelihood for over half a billion people. When healthy, as shown in Figure IV.1, coral reefs supply resources to a vast array of living organisms. It is estimated that 25% of all marine species have life stages that are dependent on coral reef systems. Many of the organisms that thrive in reef systems are found nowhere else on Earth. In addition, warm-water coral reefs provide substantial income through an array of tourism activities.
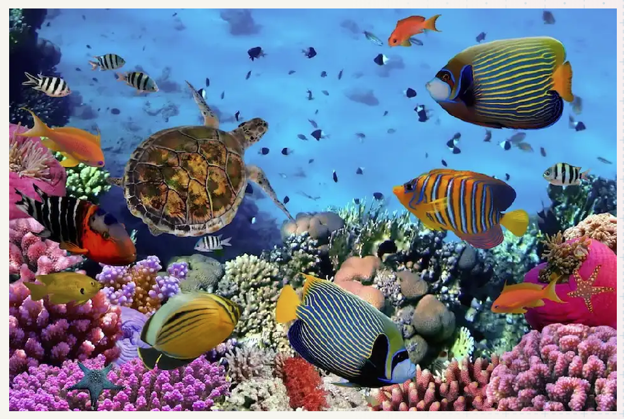
Coral reef environments also serve as a buffer that protects coastal communities against damage from high waves, flooding, and storms. However, warm-water coral reef systems are also fragile. In particular, they are directly threatened by several different aspects of climate change. Figure IV.2, from the National Oceanic and Atmospheric Administration (NOAA), highlights several ways that climate change is threatening coral reef ecosystems.
- Warming oceans produce thermal stress that causes bleaching;
- Sea level rise produces increased sedimentation that can smother coral;
- Stronger and more frequent storms can destroy reef structure;
- Increased runoff of sediment and pollutants can produce algal blooms and reduce the sunlight that reaches the corals;
- Altered ocean currents can diminish the food for corals and hamper dispersal of coral larvae;
- Increased ocean acidification can affect the integrity of the reef and decrease the rate of growth of the reef.
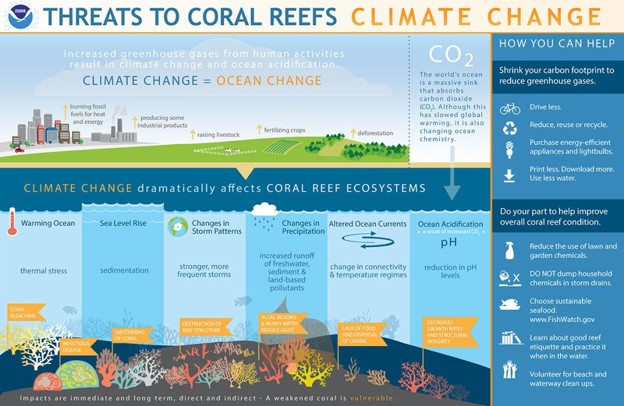
In addition to the threats to coral reef systems in Fig. IV.2, other threats to warm-water coral reef systems include overfishing, disruption from passing ship traffic, and introduction of invasive species.
Since the coral reefs under consideration require warm ocean conditions, it may seem paradoxical that increased ocean warming is threatening these ecosystems. The most common reaction of coral systems to various types of stress is a phenomenon called bleaching. As shown schematically in Fig. IV.3, under normal conditions corals play host to algae called zooxanthellae. The algae live in the tissues of the coral, form the main food source for the corals, and provide the corals with their color. Both the corals and the algae benefit from this symbiotic relationship. However, when corals are stressed by the factors summarized in Fig. IV.2, the algae can be expelled from the corals. When this occurs, the corals lose their color and turn bone white, a phenomenon called bleaching.
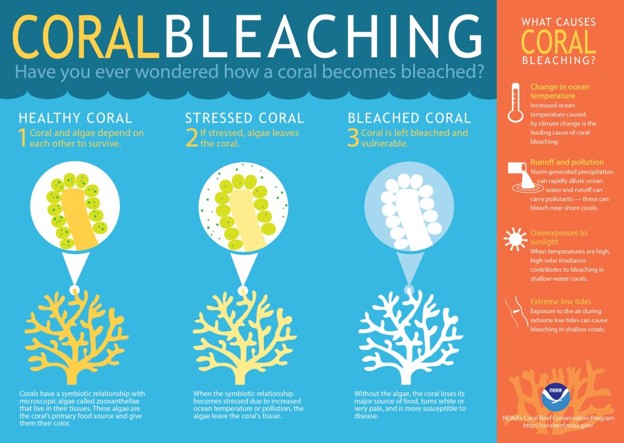
Bleaching does not necessarily kill the corals, but it leaves them more vulnerable to further damage. There are cases where bleaching events are reversible; when temporary conditions that caused the bleaching abate, algae may return to the corals and they can regain their health. Another feature of the stresses listed in Fig. IV.2 is that they make it more difficult for corals to build their skeletal structures. However, if the stressful conditions persist or if further stress is placed on the reefs, this can permanently kill the coral. The Great Barrier Reef Foundation states that climate change is the biggest threat to the future of coral reefs around the world. In recent years, heatwaves have triggered four mass coral bleaching events on the Great Barrier Reef, and the effects of climate change have already reduced shallow water coral reefs by as much as 50%. Between 1998 to the eearly 2020s, 13 cyclones of category three or greater crossed the Great Barrier Reef, causing significant damage.
Near the U.S., half of the coral reefs in the Caribbean were lost to a massive bleaching event in 2005. The thermal stress from this event was measured to be greater than that experienced in this region over the previous 20 years combined. A recent study of global reef structures during the period 1997 – 2018 found that “particularly marked declines in coral cover occurred in the Western Atlantic and Central Pacific.” Prof. David Baker of the University of Hong Kong stated that “The frequency and severity of mass coral bleaching events is increasing and indisputable. Corals have adapted to change over geological timescales – however, their evolutionary history has never encountered the unprecedented rate of change we are seeing.” The El Niño episode that peaked in 2024 produced a global bleaching that caused about 84% of the world’s coral reefs to experience bleaching-level heat stress.
The various threats to coral reef systems can take place over different time periods. Thermal stresses, in particular, can occur over periods of weeks to months. On the other hand, threats such as disease to the corals, or from sedimentation that arises from runoff from farms, or sewage from onshore developments, can occur over periods of years. It is also the case that several of the threats listed in Fig. IV.2 can act synergistically, so that the net effect on coral systems is larger than the individual factors. In general, a coral reef system is deemed to be ‘collapsed’ if the reef fails to recover over a period of a decade or longer.
The Sixth Assessment Report in 2022 (AR6) from the Intergovernmental Panel on Climate Change (IPCC) assigned “high confidence” to the statement that warm-water coral reef systems are suffering increased bleaching and mortality, and that these impacts have been attributed to human-induced climate change. In the future, IPCC report AR6 predicts that the climate change currently projected to occur, combined with ‘non-climatic drivers,’ is expected to cause loss and degradation of much of the world’s coral reefs with ‘very high confidence.’ And near-term risks for biodiversity loss are high to very high in warm-water coral reefs systems, with ‘very high confidence.’
So, warm-water coral reefs around the world are already experiencing significant mortality from a variety of effects due to global climate change caused primarily by human activity. For our purposes, global or regional “tipping points” for coral reefs would constitute reef mortality over much wider areas than we see at the moment; current reef damage tends to occur in areas of approximately 1,000 kilometers in extent. A tipping point would develop when relatively local damage expands to regional mortality; under the most extreme conditions, reef damage might occur across the globe. Although conditions vary considerably across regions, we are already seeing extended reef damage.
Global climate change, often exacerbated by strong El Niño episodes, has made ocean temperatures so high that they threaten warm-water coral reefs. Figure IV.4 shows measurements of the status of coral reefs around the world from January 2023 to April 2024, when 84% of global coral reefs underwent bleaching. These results were obtained by NOAA. The results range from no stress (light blue) to five “Alert Levels,” ranging from bright red to dark purple. Figure IV.4 shows that the only corals experiencing “no stress” are located in a small band south of the Hawaiian Islands. Many of the world’s coral reefs are experiencing Alert Levels of stress.
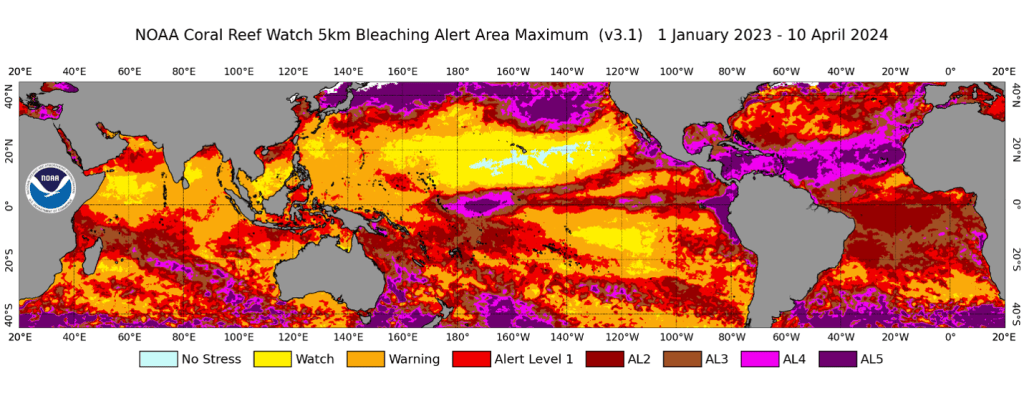
The status of warm-water coral reefs is directly related to global warming. As average global sea temperatures rise, coral reefs are affected more seriously by the different negative effects shown in Figure IV.2. At a global temperature increase of 2oC above preindustrial levels, likely to occur by 2050 or 2060 under current conditions, climate models predict that 99% of warm-water coral reefs will experience serious damage or death of the reef. This first “global tipping point” damage from climate change would produce dire changes in coral reef systems around the world. Since over 25% of all marine life spends some time in coral reef areas, and 500 million people around the world depend on coral reefs for their livelihood, this level of damage would have very serious negative impact on commercial fisheries.
Shocking Decline in the Number of North American Birds:
A landmark study in the journal Science in 2019, with Ken Rosenberg of Cornell University as lead author, showed that the number of North American birds had declined by 29%, or 3 billion birds, since 1970. This was a shocking decline in the number of birds. While it had been known that several effects — including the encroachment of humans on bird habitats, predation of birds by cats, and losses of birds during long migrations — were creating risk, the magnitude of the decreases in bird populations was not previously known. Statistics show that cats kill more than a billion birds each year, and nearly a billion birds die in collisions with buildings.
The 2019 survey used all available data sources to make their estimates. They used the North American Breeding Bird Survey, which is an annual census of bird populations that is carried out by volunteers ranging over all of North America. That census provides data on 420 species of birds. In addition, they used results from the Audubon Christmas Bird Count for data on roughly 50 species found in boreal forests and the Arctic tundra. They obtained data on shorebirds from the International Shorebird Survey. Counts for waterfowl were obtained from aerial surveys of swamps, marshes and bodies of water. They also included data from a continent-wide weather radar network that measures the biomass of migrating birds. The researchers were able to obtain information on population changes in 529 species of birds, which constitute over 90% of all North American birds.
Figure IV.5 shows percentage bird changes by habitat and species. By far the greatest percent decreases in habitat occurred in the grasslands species, followed by boreal forests. The only habitat showing an increase in bird population was wetlands. The figure also shows percent changes by bird species. Old world sparrows and larks showed the greatest percentage declines. Raptors, ducks and geese, and vireos showed the greatest population increases.
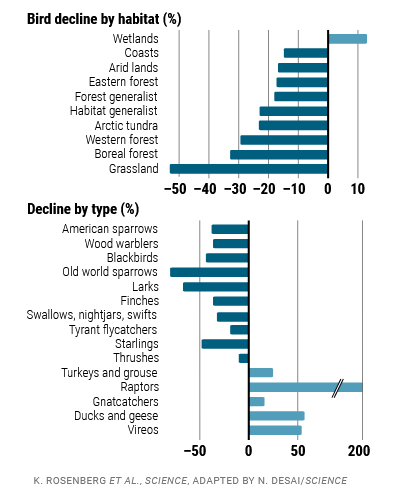
Two of the species that showed large increases in population were waterfowl and raptors. Waterfowl have been aided by wetlands conservation programs and hunting limits imposed following advocacy efforts by groups such as Ducks Unlimited. And the numbers of North American raptors soared 😊 following the banning of DDT by the Environmental Protection Agency in June, 1972. For a considerable time, the attention of the public has been focused on species that are critically endangered. North American populations of condors and whooping cranes had decreased to such dire levels that the remaining handful of birds had to be rounded up and raised by hand before they could be released back into the wild. However, these studies show that even birds that are not yet endangered are still suffering massive losses in populations.
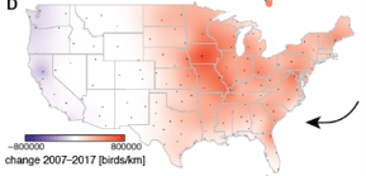
Figure IV.6 shows estimates of changes in the biomass of birds flying across U.S. migration corridors. This was measured during the decade 2007 — 2017 using data from NEXRAD radar stations that can estimate the biomass of migrating birds. Figure IV.6 provides estimates of 10-year changes in biomass, with (faint) blue representing an increase and (widespread) red a decrease. There are slight increases in the Pacific corridor, but large losses in other areas of the U.S., particularly in the Midwest and Eastern migration corridors. Overall, a 10% decrease in bird biomass was observed for that single decade over all U.S. migration corridors.
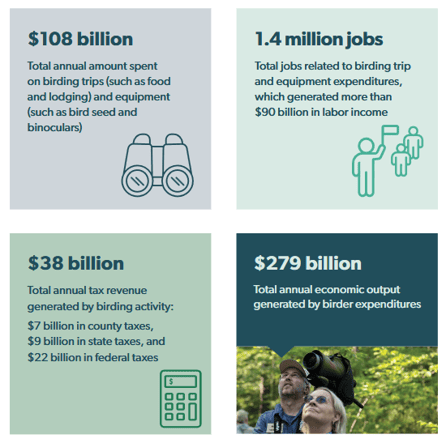
A follow-up study, the U.S. State of the Birds report, was released in March 2025. This study used data from the U.S. Geological Survey Breeding Bird Survey, the Cornell Lab or Ornithology eBird Status and Trends project, National Audubon Society Christmas Bird Count, and shorebird surveys from the Manomet Conservation Sciences and Environment and Climate Change Canada. A major input to the 2025 report was the 2022 National Survey of Fishing, Hunting and Wildlife-Associated Recreation. That report pointed out that bird-watching activities contributed a great deal to the U.S. economy. Those activities are summarized in Fig. IV.7. The total annual economic output related to bird-watching was $279 billion; of this, $108 billion was spent on birding trips and equipment (this includes bird seed). In addition, bird-related activities supported 1.4 million jobs, which generated more than $90 billion in labor income. Both hunters and anglers are often involved in birding activities, with 58% of anglers and 53% of hunters also being birders. Advocacy efforts by anglers and hunters to maintain environments conducive to their sports have the side benefit of creating ecosystems where birds thrive.
The massive declines in bird populations from 1970 to 2019 that were documented in the 2019 report have continued in 2025. One particularly concerning statistic was that duck populations, which had shown significant increases in the 50 years since 1970, were also declining recently. The findings for U.S. birds are summarized in Figure IV. 8. There were 42 “tipping point” species that had suffered steep declines and now had perilously low populations. This “red alert” category included Allen’s Hummingbird, the Tricolored Blackbird, and the Saltmarsh Sparrow. Another 37 species were categorized as “orange alert” tipping point species. This group had experienced long-term population declines that had accelerated in recent decades.
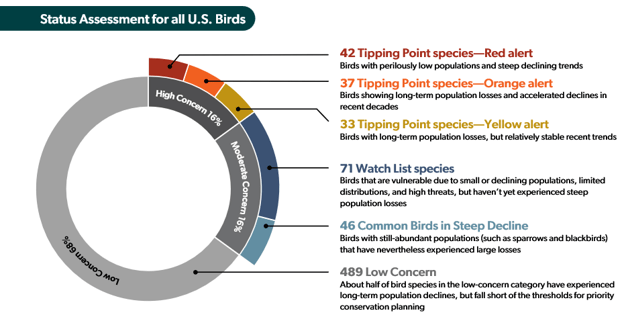
Another 33 species were classified as “yellow alert tipping point” status. These had experienced long-term population losses but had stabilized in recent decades. 71 “watch list” species had small populations and high threats but had not yet experienced large population declines. The status of 46 species was “common species in steep decline.” These had suffered extreme population declines but were still relatively abundant. The remaining 429 species were of “low concern.”
The 2025 report on U.S. bird populations provided breakdowns for about a dozen types of birds. They compared 2025 bird populations with those in prior years. Here, we provide capsule summaries for the status of a few bird populations in 2025.
- Shorebirds: a 33% decline since 1980; 19 species declining, 9 stable. Most shorebird populations are in decline despite recent conservation efforts. Shorebirds have more “tipping point” species (19 of 28 shorebird species) than any other category.
- Grassland birds: a 43% decline since 1970; 13 species declining, 4 stable and 7 increasing. The grassland biome is “in collapse” due to conversion to agriculture, invasive species, and drought. A Central Grasslands Roadmap Initiative is attempting to reverse this trend and restore grassland habitats.
- Eastern Forest Birds: 27% decline since 1970; 18 species declining, 3 stable and 6 increasing. Declines can be partly explained by changes in forest structure, with species that breed in mature forests doing better than those in regenerating forests.
- Dabbling and Diving Ducks: 24% increase since 1970; 5 species declining, 1 stable and 14 increasing. This is the most conspicuous “success story” in bird populations; however, populations in the largest breeding areas have recently declined.
- Waterbirds: 18% increase since 1970; 21 species declining, 16 species stable, 26 species increasing. Another “success story;” however, more than a third of waterbird species are declining.
There are many factors that have an effect on bird populations. Three of the birds most threatened with extinction have suffered in different ways. A major threat to raptors in the past was contamination by pesticides, particularly DDT. This caused the eggs laid by raptors to be so thin that they could no longer produce offspring. Condors also nearly became extinct. The reasons for their decline was loss of habitat areas (remote canyons), pesticides, hunting, and ingestion of lead from bullets. Whooping cranes nearly went extinct due to habitat loss, agricultural expansion, hunting, and collectors who stole the birds’ eggs.
However, there have been a number of recent studies of the quantitative effect of global climate change on bird populations. The Audubon Society devoted an entire issue of their magazine to the effects of climate change on North American bird populations. They used 140 million observations of bird ranges; with this data, they used climate models to project how each species’ range would shift due to climate change and other human impacts. The Audubon Society study estimated that future warming levels would impact populations of most bird species. Here are some general results obtained from scenarios that utilize the best climate models. At a global temperature increase of 1.5oC relative to preindustrial levels, which we are currently experiencing, 40% of North American bird species are likely to be adversely affected. At a warming level of 2.0oC, which we are on track to reach in mid-century, 54% of bird species would be vulnerable to sharp decreases in numbers; at a warming level of 3.0oC, which we are on a path to reach by 2100, 64% of bird species would face high extinction rates.
The Audubon Society study used climate models to determine the ranges of 609 different bird species, under a number of different warming scenarios. They considered four different cases: one assuming zero global temperature increase, a second that used a global temperature increase of 1oC, a third for a global temperature increase of 2oC, and a fourth for a temperature increase of 3oC. As an example, Fig. IV.9 shows the effects of climate change on the breeding range for the bobolink, a common meadowland bird. Because of the increasing temperatures due to climate change, the bobolink, and most other North American birds, will have to move to new breeding grounds if they are to survive. Figure IV.9 shows how the bobolink breeding grounds will shift if the climate increases by 3o C relative to preindustrial levels. The bright red shading shows the 88% of the bobolink’s current range that would no longer support those birds. The eggshell color shows the 12% of the bobolink current range that would remain at this temperature, while the light blue shows the new range that the bobolink would have to occupy.
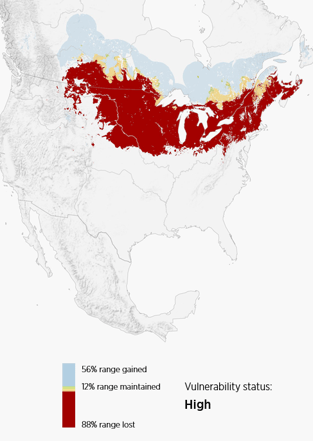
With a 3oC temperature increase. the bobolink would have to abandon most of its current range. It is extremely unlikely that the new, farther north, breeding grounds would possess the necessary conditions to support bobolink populations. The grasslands and forests of the new range would likely lack the food, shelter, and safety from predators that exist in the bobolink’s current range. As a result, the vulnerability of that bird is listed as High. The results from the other 608 bird species in the Audubon study are largely the same; birds will have to shift their range due to the increasing temperatures. While a handful of species will likely see population increases as a result of this migration, most species will fare worse in the new locations, and several of these species are likely to become extinct.
Concerning Decline in the Number of Amphibians:
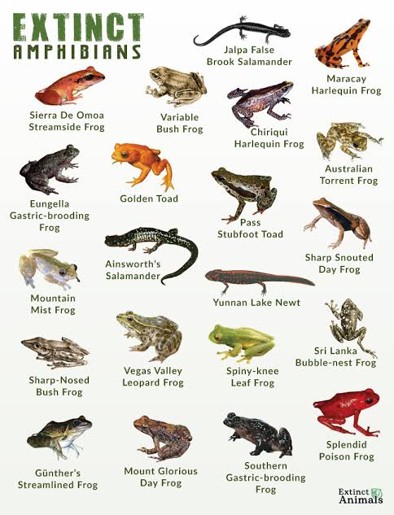
Amphibians are in great peril around the globe. In 2023, the results of the second Global Amphibian Assessment were released. They evaluated 8,011 species of amphibians around the world, and their results were included in the International Union for Conservation of Nature (IUCN) Red List of Threatened Species. Around the world, amphibians are the most threatened vertebrate species, with 40.7% of species in danger of extreme loss or extinction. Figure IV.10 shows samples of amphibians that have gone extinct in the last century, including frogs, toads, salamanders and newts. Scores of other amphibian species are facing dire threats of extinction; some of these may already be extinct.
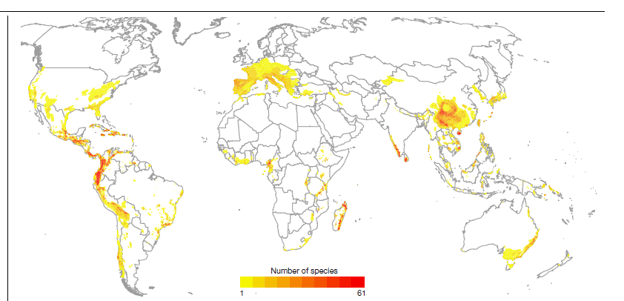
The current extinction rate for amphibians appears to be about 45,000 times the prehistoric background extinction rate deduced from fossil studies. Figure IV.11 shows the geographic distribution of the 2,873 threatened amphibian species. Locations are color-coded, where the darker colors are associated with a higher number of threatened species in that region. The greatest number of threatened species in any one region is 61. Some of the regions where amphibians are in greatest danger are Central and western South America, Europe, and southeast Asia.
The reasons for changes in status have varied over time. In the period 1980 – 2004, the dominant causes were habitat loss and disease. A particularly devastating disease was chytridiomycosis, an infectious skin disease which was caused by two fungi Batrachochytrium dendrobatidis (Bd) and Batrachochytrium salamandrivorans (Bsal). It is not clear whether these fungal diseases have appeared recently, or whether they have evolved into a much more lethal form. There are some amphibians that are capable of carrying Bd fungi without being seriously affected; these include the African clawed frog and the North American bullfrog. However, in many species around the world the disease has proved fatal. The Bd fungus is widely distributed in the Americas but only appears sporadically in Africa, Asia, and Europe. Humans may have played an inadvertent role in transporting the fungus to new regions.
Infection with the Bd fungus affects the outermost layers of skin; animals that accumulate large populations of Bd are unable to breathe, hydrate, osmoregulate or thermoregulate. A common symptom of chytridiomycosis is thickening of the skin, which rapidly leads to death as the individual is unable to ingest nutrients, release toxins or breathe. Much research is currently ongoing on the use of antifungals to treat the disease, but also investigation into compounds that can potentially neutralize the effects of the chytrid fungi.
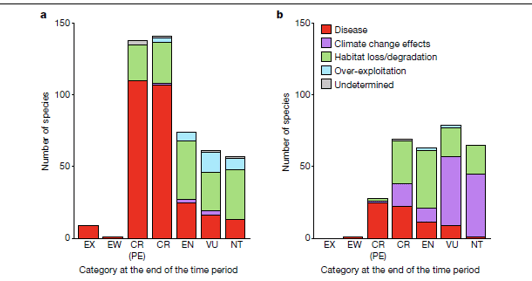
From 1980 to 2004, about 91% of all amphibians that suffered deterioration in their threatened status were affected by habitat loss and disease. However, in the period 2004 – 2022, global climate change was responsible for 39% of status deteriorations, compared with 37% by habitat loss. Figure IV.12 shows the types of threats facing amphibian species. For each type of threat the chart shows the number of species affected by that threat. All of the entries in green are due to the loss and degradation of habitat. The numbers shown in gray represent threats that are expected to occur in the future but are not yet present. Many species are experiencing multiple types of threats.
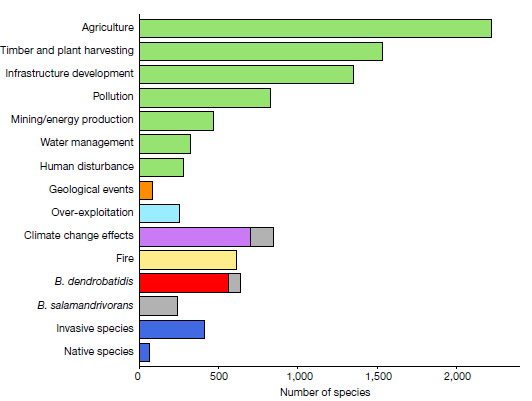
Figure IV.13 shows the number of amphibian species whose status has moved into a higher-threat category on the IUCN Red List. Those categories are (from most serious to least serious): EX (extinct); EW (extinct in the wild); CR (critically endangered, with a separate sub-category PE (presumed extinct)); EN (endangered); VU (vulnerable); NT (near threatened). It also shows the primary drivers that caused the change in status. Those drivers are: disease (red); climate-change effects (purple); habitat loss or degradation (green); over-exploitation (light blue); and undetermined (gray). Figure IV.13a shows the changes in status during the period 1980 – 2004, while Fig. IV.13b shows status changes in the period 2004 – 2022. As we mentioned earlier, while disease and habitat loss were the dominant cause of change in threatened status from 1980 to 2004, effects of climate change became significantly greater in the more recent period 2004 – 2022.
One of the features of climate change that is exacerbating the stresses on amphibian populations is drought. Drought greatly increases the probability of wildfires, and it also decreases the moisture in the soil; both of these represent significant threats to amphibian populations. As the effects of climate change become more severe, the results of the Second Global Assessment of Amphibians underscore the need to identify and remedy climate changes that place more amphibians at risk. Also, protection of habitat is crucial to minimizing the loss of amphibian species. At present, the proliferation of legal and illegal agriculture represents the single biggest threat to amphibian habitats.
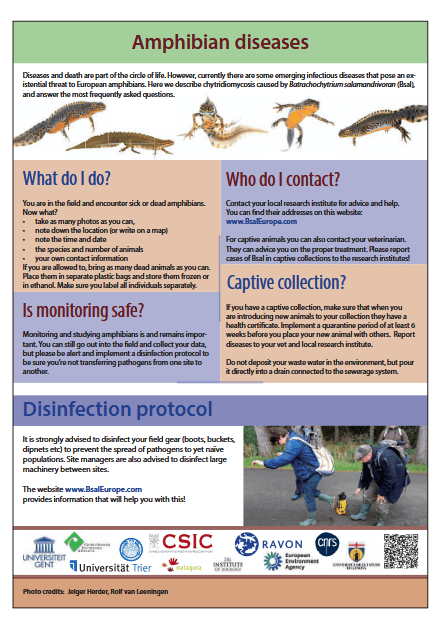
Another measure that will be critical to preserve our amphibian species is the identification and amelioration of disease. At present, it is important to limit the spread of B. salamandrivorans (Bsal) in Europe and to prevent its introduction into the Americas. Amphibians are an exceptionally diverse group of animals. Scientists have now produced action plans to help assure their survival. Figure IV.14 shows a flier that discusses the fungal disease caused by Bsal; it describes symptoms that may be evident to citizens and mentions steps to take and organizations to contact. It is hoped that governments will prioritize the steps proposed in these efforts to ensure amphibian survival.
V. How Close are We to a Sixth Mass Extinction?
The vast majority of species that have ever existed on Earth are now extinct. But the fossil record clearly indicates that most of those extinctions have occurred more or less simultaneously in dramatic events when Earth’s environment changed in some profound way. Figure V.1 shows the record of extinctions that have been determined by paleontologists, marked by five mass extinction events when at least 75% of all extant species have disappeared.
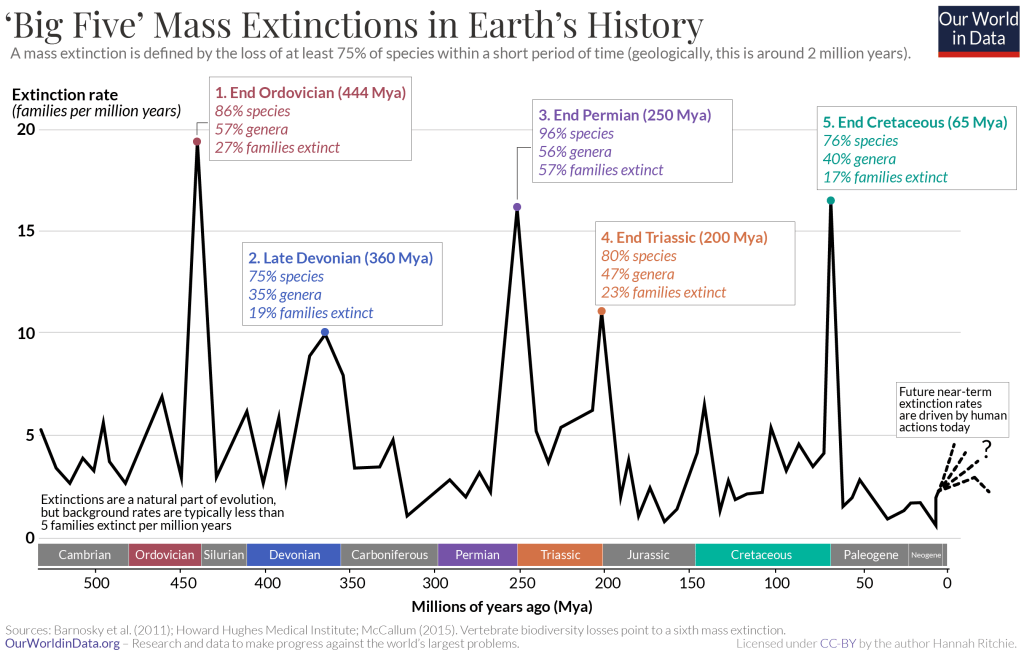
The mass extinction event we know the most about is the fifth and most recent one that marked the transition from the Cretaceous to the Paleogene epoch 65-66 million years ago. This is the one that killed off the land-based and water-based dinosaurs. We know that it was triggered by the collision of a massive asteroid with Earth in the Yucatan peninsula 66 million years ago. That collision appears to have released energy equivalent to millions of nuclear weapons, generating massive tsunamis and earthquakes, global firestorms, and a multi-year “nuclear winter,” in which dust and aerosols blocked sunlight, halting photosynthesis, and eviscerating food chains. Global temperatures dropped precipitously, food became scarce, and entire ecosystems collapsed. 76% of species were driven to extinction, with some freshwater species and small land-based animals who could live in burrows having better chances of survival than the dominant dinosaurs.
The most impactful of the mass extinction events was the third one that occurred at the end of the Permian epoch about 250 million years ago, sometimes called the “Great Dying.” 57% of all families were driven to extinction, with particularly devastating consequences for marine species. The proposed cause originated with long-lasting and intense volcanic eruptions in Siberia, which released massive amounts of carbon dioxide and hydrogen sulfide into the atmosphere and the oceans. The results would have been global warming, ocean acidification and reduced oxygen levels, acid rain, and profound changes to ocean and land chemistry.
The first mass extinction event, the end Ordovician extinction about 444 million years ago, is attributed to a combination of climatic and tectonic changes. This period is seen as the onset of Earth’s alternating swings between glacial and interglacial periods, causing large swings in sea level and consequent shifts of shorelines. Tectonic uplift created the Appalachian Mountains, affecting atmospheric and ocean chemistry. The second mass extinction event, the Late Devonian extinction some 360 million years ago, is believed coupled with the diversification of land plant species, which absorbed a significant fraction of atmospheric carbon dioxide, leading to severe and rapid global cooling. The fourth major extinction event, the End Triassic event 200 million years ago, is believed correlated with massive underwater volcanic activity in the Central Atlantic Magmatic Province, which would have raised carbon dioxide levels in the atmosphere and the oceans, led to global warming and dramatic changes in ocean chemistry.
It thus seems likely that all five of the previous major extinction events were associated with dramatic global climate changes, though resulting from diverse triggering events. Human activities are now causing a rapid change to Earth’s climate again, with serious impacts on biodiversity. But other human activities are also contributing to biodiversity loss and the threat of widespread species extinctions, as we have outlined in Section III. This raises the question of whether we are on the verge of Earth’s sixth mass extinction event, in which, once again, more than 75% of species will eventually be driven toward extinction.
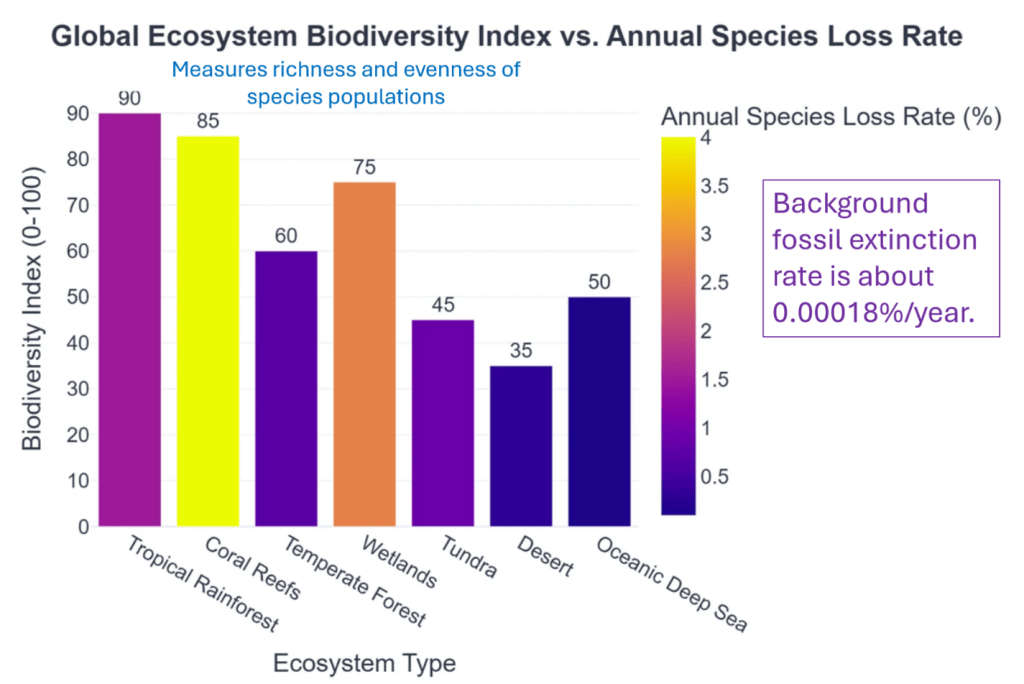
Let’s first consider some of the species and ecosystems at greatest immediate risk. Figure V.2 shows a biodiversity index that measures both the richness and the evenness of species populations within seven distinct types of ecosystems on Earth. Tropical rainforests, coral reefs, and wetlands host the most diverse species. The color-coding of the bars in the figure represents the annual rate of species loss from each ecosystem type. The ecosystems at greatest extinction risk are coral reefs and wetlands, both of which are among the most biodiverse ecosystems on the planet. Reef species are disappearing at an alarming average rate of 4% per year and wetlands species at about 3% per year.
Barnosky, et al. have noted the challenges involved in comparing today’s extinction rates to those estimated from prehistoric fossils as both rates suffer from sampling problems and possible bias. “The fossil record usually includes only species that possess identifiable anatomical hard parts that fossilize well…Analyses of fossils are often done at the level of genus rather than species…This can result in lumping species together that are distinct, or, if incomplete fossil material is used, over-splitting species…Fossil extinction is recorded when a taxon permanently disappears from the fossil record and underestimates the actual number of extinctions (and number of species) because most taxa have no fossil record. The actual time of extinction almost always postdates the last fossil occurrence.”
In contrast, “[m]odern extinction is recorded when no further individuals of a species are sighted after appropriate efforts. In the past few decades designation as ‘extinct’ usually follows IUCN criteria, which are conservative and likely to underestimate functionally extinct species. Modern extinction is also underestimated because many species are unevaluated or undescribed.” Despite these comparison problems, all the extinction rates in Fig. V.2 are enormously higher than the average background rate determined from fossils for periods in between mass extinctions. For the most complete fossil record for mammals, the average background rate used by Barnosky, et al. corresponds to 1.8 extinctions per million species-years (E/MSY), or a species extinction rate of 0.00018% per year. The current species loss rates for the ecosystems considered in Fig. V.2 range from 0.5% to 4% per year. Even the smallest of the current species loss rates in Fig. V.2, then, is nearly 3,000 times the average background rate for extinctions deduced from the fossil records.
Clearly, the drivers discussed in Section III are producing extinction rates far beyond the prehistoric background. But how do today’s rates compare to those seen during the prehistoric mass extinctions? That comparison is again very difficult because the resolution with which prehistoric extinctions are timed is too coarse to determine the duration of each mass extinction event with any meaningful precision. Barnosky, et al. then make the comparison attempt in Fig. V.3. Here they consider the extinctions that have been recorded among vertebrate species over the past 500 years (see Fig. I.1), as well as the species that are today judged to be critically endangered or threatened (see Fig. I.4). If one counts all these species as extinct during a 500-year period, they suggest a cumulative vertebrate extinction rate (the vertical scale in Fig. V.3) around 100-300 E/MSY, i.e., about two orders of magnitude higher than the fossil background rate. They would account for a total extinction magnitude (the horizontal scale in Fig. V.3) of about 30% of all vertebrate species, a sizable fraction of the way toward the 75% required for characterization as a mass extinction event.
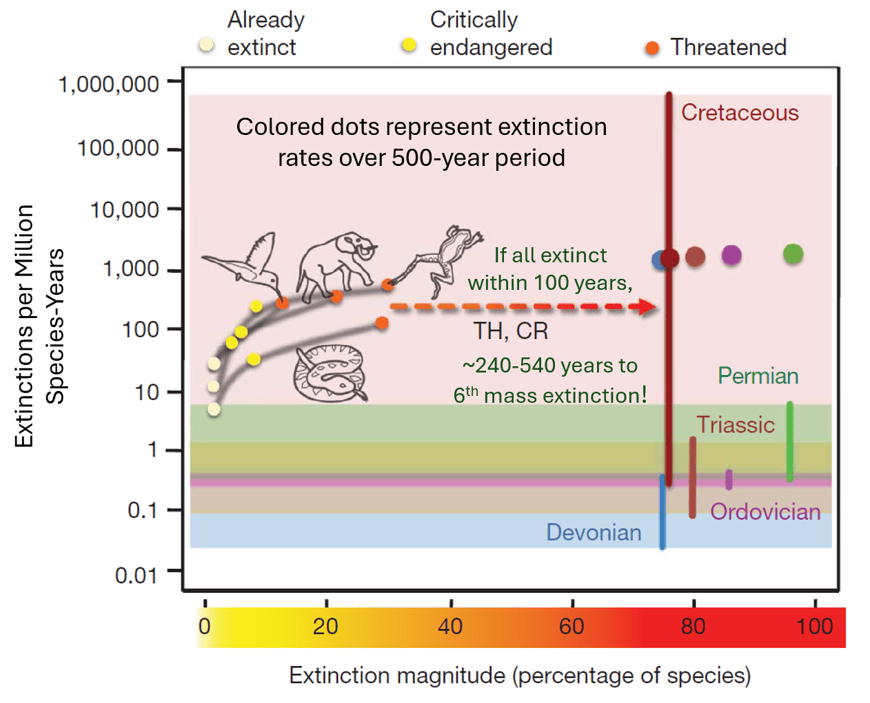
If the recorded extinction magnitudes for the five prehistoric mass extinctions had occurred over a 500-year period, they would have represented extinction rates around 1,000 E/MSY, as indicated in Fig. V.3 by the large colored dots at the right side of the figure. If their duration had been shorter – a possibility likely only for the end Cretaceous event – the rates would have been even higher. If the duration had been longer, the rates would be lower and closer to the rates estimated for the most recent 500-year period.
Barnosky, et al. also estimate the time duration over which current extinctions might reach the 75% extinction magnitude threshold for mass extinction: “if all ‘threatened’ species became extinct in 100 years, and that rate of extinction remained constant, the time to 75% species loss—that is, the sixth mass extinction—would be 240 to 540 years for those vertebrates shown here that have been fully assessed (all but reptiles). [S]imilarly, if [only] all ‘critically endangered’ species became extinct in 100 years, the time to 75% species loss would be 890 to 2,270 years for these fully assessed terrestrial vertebrates.”
The bottom line is that the five primary drivers of biodiversity loss discussed in Section III are leading us toward a Sixth Mass Extinction. But there is still time for humans to take positive actions to cut this already significant extinction episode short of the “Big Five.”
VI. Global Agreements About Biodiversity
The countries of the world have been aware for several decades now of the need to take global actions to preserve biodiversity. To date, the efforts have met with only limited success and the U.S. has refused to endorse many of the agreements.
The United Nations-sponsored Convention on Biological Diversity (CBD) is a multi-lateral treaty aimed at developing national strategies for the conservation and sustainable use of biodiversity. It recognized for the first time in international law that conservation of biodiversity is “a common concern of humankind.” The Convention was opened for signatures at an Earth Summit in Rio de Janeiro in June 1992 and went into effect at the end of 1993. As of 2016 there are 196 government parties to the Convention, with the U.S. as the only UN member that has not ratified the treaty. The U.S. did not agree with Convention rules about sharing of genetic resources and benefits obtained from them, such as biotechnology and pharmaceuticals, among countries.
The Convention requires participating countries to develop National Biodiversity Strategies and Action Plans, along with national reports on implementation progress. These are discussed and evaluated, along with scientific reports and priorities, at periodic Conferences of the Parties (COPs), the 17th of which is scheduled for October 2026 in Yerevan, Armenia.
Over the years the CBD has developed supplementary agreements and strategic plans. The most important among these are the 2000 Cartagena Protocol, the 2010 Nagoya Protocol, the Strategic Plan for Biodiversity 2011-2020, featuring the Aichi Biodiversity Targets discussed further below, and the Kunming-Montreal Global Biodiversity Framework Goals adopted in December 2022.
The Cartagena Protocol on Biosafety “is an international agreement which aims to ensure the safe handling, transport and use of living modified organisms (LMOs) resulting from modern biotechnology that may have adverse effects on biological diversity, taking also into account risks to human health.” The Nagoya Protocol “is an international agreement which aims at sharing the benefits arising from the utilization of genetic resources in a fair and equitable way.” Its implementation is facilitated by the CBD’s Access and Benefit-Sharing Clearing-House.
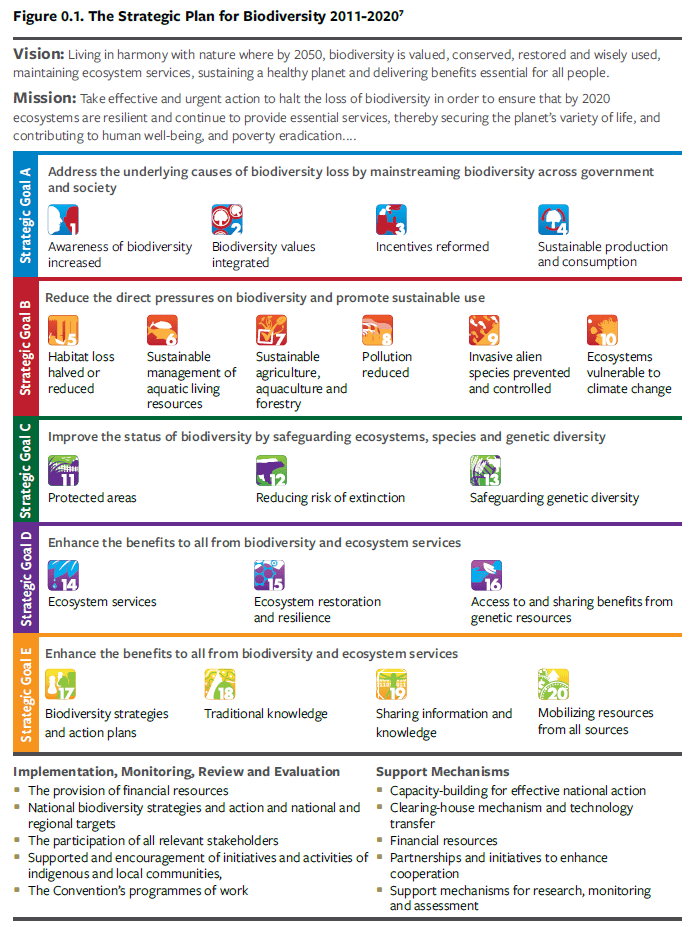
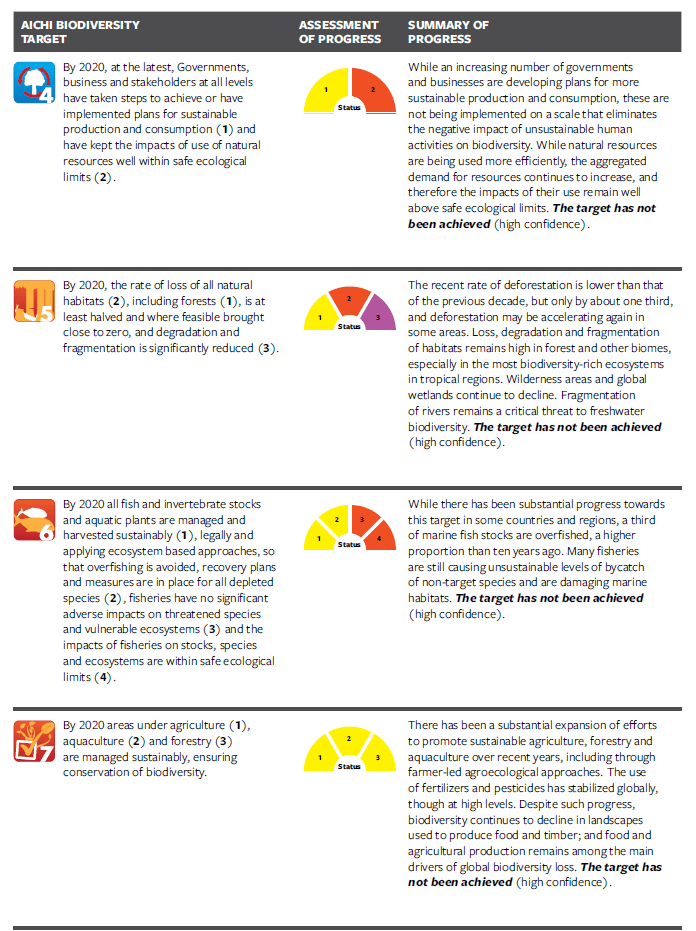
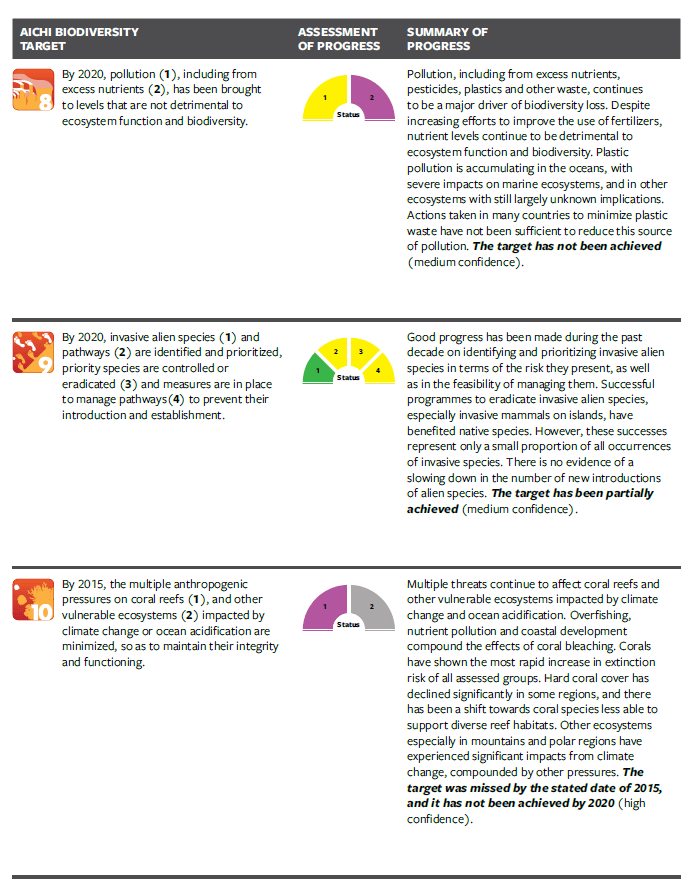
The heart of the 2011-2020 Strategic Plan is the 20 Aichi Biodiversity Targets, across 5 strategic goals, summarized in Fig. VI.1. The plan’s stated mission is to “Take effective and urgent action to halt the loss of biodiversity in order to ensure that by 2020 ecosystems are resilient and continue to provide essential services, thereby securing the planet’s variety of life, and contributing to human well-being, and poverty eradication…” The CBD also publishes occasional editions of a Global Biodiversity Outlook that assess the status of achieving the Convention’s goals. The Fifth Edition, published in 2020, provides a detailed report card on progress in meeting the 20 Aichi Biodiversity Targets. The overall assessment was that 14 of the 20 targets “have not been achieved,” while the remaining 6 targets “have been partially achieved.” A flavor of the assessments can be attained from Figs. VI.2 and VI.3, evaluating progress on 7 of the Aichi targets.
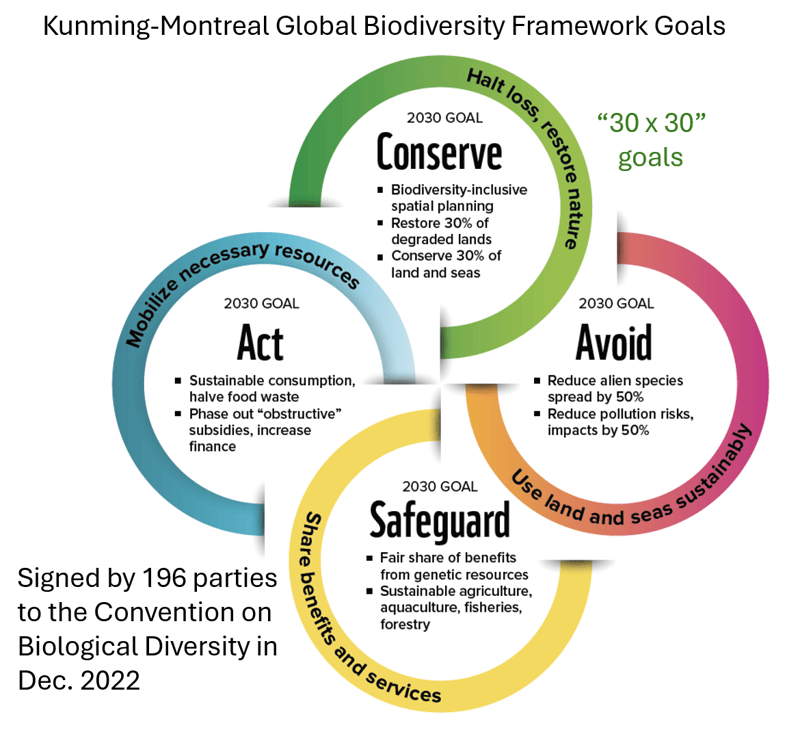
The limited progress on the Aichi targets led to the adoption in 2022 of a new set of strategic goals under the Kunming-Montreal Global Diversity Framework. The Framework established 4 goals for 2050 and 23 targets for 2030, designed to “reach the global vision of a world living in harmony with nature by 2050.” Among the targets for 2030 are so-called “30×30” goals aiming to restore 30% of degraded lands and conserve 30% of land and seas by 2030. Some of the 2030 targets are displayed in Fig. VI.4. The targets are laudable but one can only hope that when assessments of progress are made in 2030, the status will look more optimistic than the 2020 evaluation of progress toward the Aichi targets.
In addition to the CBD, the UN helped to set up an independent intergovernmental panel more similar to the Intergovernmental Panel on Climate Change (IPCC), with the intention of strengthening the interface between ongoing scientific research and governmental policy-making on biodiversity. The Intergovernmental Science-Policy Platform on Biodiversity and Ecosystem Services (IPBES) was established in April 2012 by 94 governments. In January 2026 Donald Trump announced his intention to withdraw the U.S. from IPBES, as well as from other international organizations he deemed “contrary to the interests of the United States.”
IPBES groups its work into four areas:
- Assessments: On specific themes (e.g. “Pollinators, Pollination and Food Production”); methodological issues (e.g. “Scenarios and Modelling”); and at both the regional and global levels (e.g. “Global Assessment of Biodiversity and Ecosystem Services”).
- Policy Support: Identifying policy-relevant tools and methodologies, facilitating their use, and catalyzing their further development.
- Building Capacity & Knowledge: Identifying and meeting the priority capacity, knowledge and data needs of our member States, experts and stakeholders.
- Communications & Outreach: Ensuring the widest reach and impact of our work.
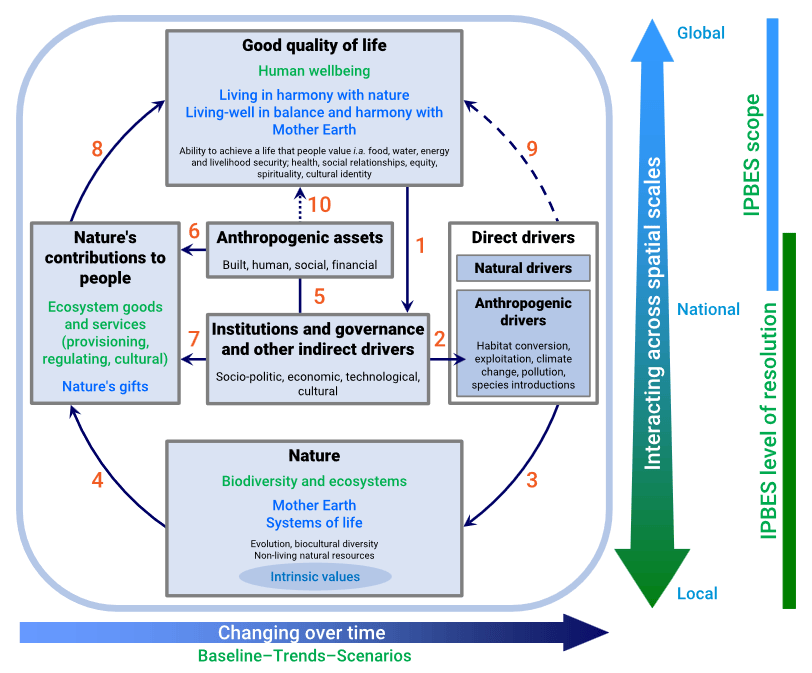
IPBES characterizes the conceptual framework for their efforts through the sketch in Fig. VI.5. All avenues lead from and to the overarching goal of humans achieving a good quality of life by living in harmony with nature. That goal influences institutions, governance, and other indirect drivers of change (arrow 1), which in turn affect anthropogenic drivers of biodiversity loss (arrow 2, the five primary drivers discussed in Section III), anthropogenic assets (arrow 5), and ecosystem goods and services (arrow 7). The anthropogenic and natural drivers cause changes to biological and ecosystem diversity (arrow 3), which in turn affect Nature’s contributions to people (arrow 4). The direct impacts on humans’ quality of life from the direct drivers of biodiversity change (dashed arrow 9) and anthropogenic assets (dashed arrow 10) are not a main focus of IPBES.
IPBES has won major awards for its work. The 2022 Gulbenkian Prize for Humanity was awarded jointly to IPBES and IPCC, recognizing “the role of science on the front line of tackling climate change and the loss of biodiversity.” The Jury for the Prize noted specifically that the joint award “recognising these two organisations serves to emphasise the need to look at the climate crisis and biodiversity in conjunction, with concerted approaches making recourse to nature-based solutions.” IPBES also received a 2024 Blue Planet Prize, which recognized the platform as “the leading global authority on the state of knowledge and science about biodiversity, ecosystem services and nature’s contributions to people. Their landmark Reports facilitate better science-informed policy and action across scales, sectors, and knowledge systems.”
Rewilding:
Not all international efforts toward increasing ecosystem health are being managed by governments. Many individuals, small land owners, and non-governmental organizations are involved in rewilding efforts aimed at restoring natural ecosystems free from human influence. A primary focus of these efforts is to establish large core protected areas, such as national parks and wildlife reserves, into which large keystone mammal species will be introduced or re-introduced. The large mammals serve various essential functions. By moving through the landscape and grazing, they promote nutrient cycling and seed distribution, providing healthy soils and plant growth. Both herbivores to consume vegetation and carnivorous predators to regulate the ecosystem are viewed as essential.
A group of 33 international leaders of the movement published Guiding Principles for Rewilding in a 2021 issue of the journal Conservation Biology. In response to a request from the IUCN the authors included in that paper a consensus definition of rewilding efforts, which includes the following excerpts:
“Rewilding is the process of rebuilding, following major human disturbance, a natural ecosystem by restoring natural processes and the complete or near complete food web at all trophic levels as a self-sustaining and resilient ecosystem with biota that would have been present had the disturbance not occurred…The ultimate goal of rewilding is the restoration of functioning native ecosystems containing the full range of species at all trophic levels while reducing human control and pressures. Rewilded ecosystems should—where possible—be self-sustaining.”
Rewilding can be passive – as in areas abandoned by human management and later reclaimed by nature – or active. Active rewilding includes human interventions at the start, for example, to “include species reintroductions or translocations and/or habitat engineering and the removal of man-made structures and Introduced [invasive] species that cause trouble.” In addition to reintroducing extant species, there are some plans to use de-extinction biotechnology to introduce modern facsimiles of extinct Pleistocene megafauna, such as woolly mammoths. In a previous post we briefly discussed efforts by Sergey Zimov of the Russian Academy of Sciences Northeast Science Station to create a Pleistocene Park in an existing 160 square kilometer wildlife preserve in Siberia. Zimov is eagerly awaiting the eventual release of resurrected woolly mammoths, and possibly other Ice Age animals, to populate his park and help to convert tundra to grasslands and a self-sustaining ecosystem.
But many less exotic rewilding efforts are making headway around the world. In the U.S. Illinois has recently become the first state to adopt rewilding as a habitat restoration strategy in state law. The American Prairie is a private habitat comprising more than 520,000 acres in the Missouri Breaks region of Montana, where bison are being reintroduced. Significant rewilding projects have been introduced in Argentina and Brazil, which have suffered substantial loss of biodiversity over the past half-century. In Argentina, part of the Iberá Wetlands has been converted to a national park covering 482,000 acres, into which “species such as the giant anteater, pampas deer, collared peccary, red and green macaw, giant river otter, and the jaguar,” which all became extinct in the region for several decades, “have now been reintroduced.” In Brazil, “[t]he red-rumped agouti, Yellow-footed tortoise, brown howler monkey, and Blue and gold macaw were reintroduced in Tijuca National Park.”
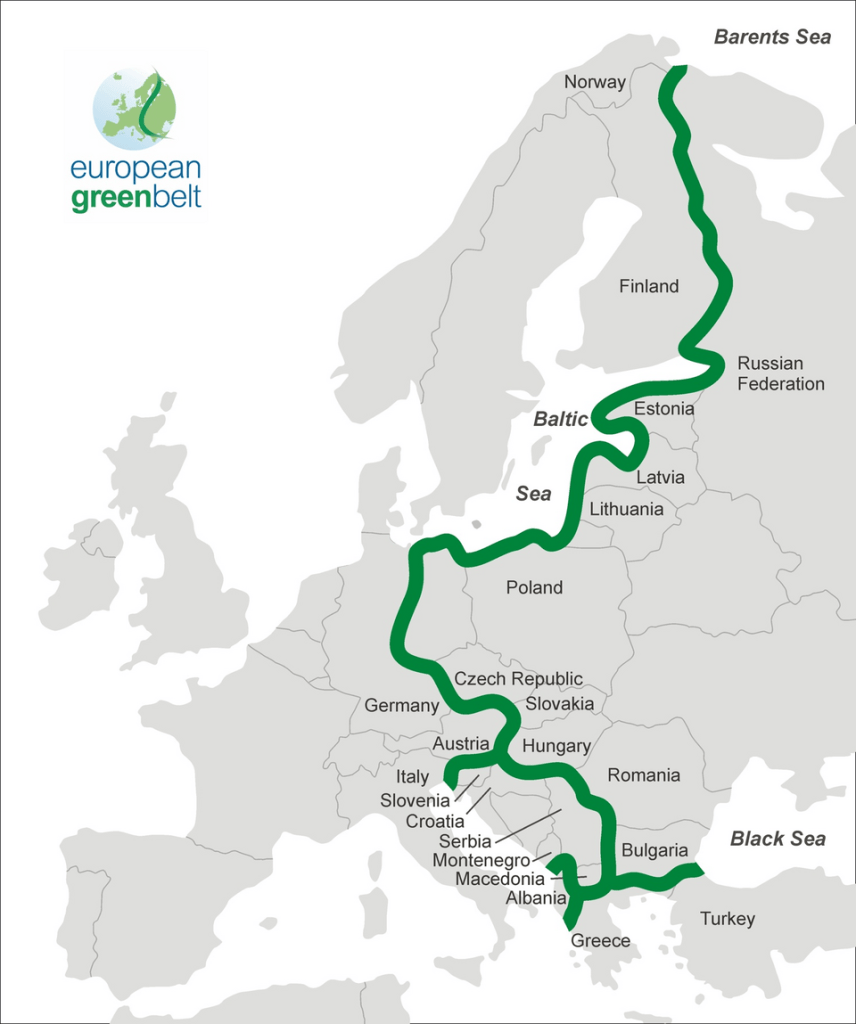
In Europe, the IUCN has helped to coordinate an especially ambitious grassroots rewilding project known as the European Green Belt, which aims to convert the areas of the former Iron Curtain separating western Europe from the USSR and its satellite countries into an ecological network that runs from the Barents Sea north of Norway down to the Black and Adriatic Seas (Fig. VI.6). The Green Belt would run through more than a dozen European countries, connecting national parks and core wildlife reserves in a chain of natural ecosystems. In Africa several multi-nation rewilding projects have been proposed to connect national parks, wildlife reserves, and other protected areas, often with the primary aim of protecting elephants and expanding their grazing areas. One of these projects, the Kavango-Zambezi Transfrontier Conservation Area, created in 2012 the second largest nature and landscape conservation area in the world, spanning the borders of five countries in South Africa and nearly 200,000 square miles, including more than 110,000 square miles of protected areas, and providing a home to about 250,000 African elephants. Several additional rewilding efforts are under way in Australia and Asia.
The efforts of the CBD, the IBPES, and rewilding groups are aimed at restoring entire healthy ecosystems. In addition to these, there are many continuing conservation efforts to prevent the extinction of individual currently endangered species. We reviewed a number of these in a previous post.
VII. Conclusions
Measures of biodiversity health, such as that in Fig. V.2, include not just a count of species in an ecosystem, but also consider the evenness of different species populations. An ecosystem is unhealthy when a single dominant species is allowed to exhaust much of the available resources. As those resources run out – as apex predators kill off most of their prey – even the dominant species suffers and the ecosystem loses its resilience. Over the past couple of centuries, Homo sapiens have become the dominant species over much of the Earth, with often insatiable appetites for more land, more food, more energy, more dominance. The consequence of those appetites is nature out of balance, with a warming climate and a dwindling biodiversity, both of which will come back to bite humans.
Human activities have currently put the Earth on a path to a Sixth Mass Extinction via five primary drivers of biodiversity loss: habitat destruction, over-exploitation, climate change, pollution, and the introduction of invasive species. Resulting population losses among animal species have been large and remarkably widespread over the past 50 years. Extinction rates are currently much higher than prehistoric background rates deduced from fossil records. Serious ongoing threats to pollinator species, coral reefs, wetlands, and forests jeopardize food and medicine supplies for humans. In order to avoid a sixth extinction episode that would severely impact human health and well-being, humans must now make concerted worldwide efforts to save endangered species and restore natural habitats that will be undisturbed by human encroachment.
The 196-country (excluding the U.S.) Convention on Biological Diversity has set ambitious “30×30” goals for 2030 to put us on a path toward restoration. These call for restoring 30% of degraded lands and setting up conservation areas covering 30% of land and sea. In addition, the Kunming-Montreal Global Biodiversity Framework calls for reducing invasive species spread, pollution impacts, and human food waste each by 50% by 2030. Those changes require investments in sustainable agriculture, aquaculture, fisheries, and forestry, as well as a commitment to sustainable human consumption. The Intergovernmental Science-Policy Platform on Biodiversity and Ecosystem Services (now also excluding the U.S.) is providing science-based tools and methodologies to governments to work toward these goals. In addition, many grassroots rewilding efforts around the globe are trying to establish large functioning and self-sustaining native ecosystems.
Simultaneously, humans must commit themselves to substantial reductions in the use of fossil fuels for energy production, heat, and transportation in order to mitigate the worst impacts of climate change. All of these goals require substantial changes in human behavior. But they also require replacement of obstructive governments, like that of Donald Trump, who believes that climate change and a sixth mass extinction are “hoaxes” that only get in the way of unfettered industrial, commercial, and economic growth (to say nothing of personal enrichment). “Harmony with nature” is not in Trump’s vocabulary.
For now, the jury is out regarding humans’ ability to save themselves over the long run.
References:
The IUCN Red List of Threatened Species, https://www.iucnredlist.org/en
World Wildlife Fund, Living Planet Report 2024, https://livingplanet.panda.org/en-US/
E. Kolbert, The Sixth Extinction: An Unnatural History (Picador, 2015), https://www.amazon.com/dp/1250062187
World Health Organization, Biodiversity, https://www.who.int/news-room/fact-sheets/detail/biodiversity
M.R. O’Connor, Resurrection Science (St. Martin’s Press, 2015), https://www.amazon.com/Resurrection-Science-Conservation-Extinction-Precarious/dp/113727929X
Convention on Biological Diversity, Global Biodiversity Outlook 5 (2020), https://www.cbd.int/gbo5
Wikipedia, Biodiversity, https://en.wikipedia.org/wiki/Biodiversity
DebunkingDenial, Climate Tipping Points: Coming Soon to a Planet Near You?, https://debunkingdenial.com/climate-tipping-points-coming-soon-to-a-planet-near-you/
DebunkingDenial, Super El Niño Events are on the Rise, https://debunkingdenial.com/super-el-nino-events-are-on-the-rise/
AP Environmental Science, Biodiversity Loss and Species Extinction, https://www.slideserve.com/tyra/biodiversity-loss-and-species-extinction
Ramsar, Global Wetland Outlook 2025, https://www.global-wetland-outlook.ramsar.org/
T. Cornelisse, et al., Elevated Extinction Risk in Over One-Fifth of North American Pollinators, Proceedings of the National Academy of Sciences 122, e2418742122 (2025), https://www.pnas.org/doi/10.1073/pnas.2418742122
Xerxes Society, Pollinator Conservation Program: What’s at Stake?, https://xerces.org/pollinator-conservation/whats-at-stake
UN Environment Programme, This New Report Paints a Worrying Picture About the Future of Coral Reefs, https://www.unep.org/news-and-stories/story/new-report-paints-worrying-picture-about-future-coral-reefs
Wikipedia, Biodiversity and Drugs, https://en.wikipedia.org/wiki/Biodiversity_and_drugs
IUCN, European Red List of Medicinal Plants, https://portals.iucn.org/library/node/45215
Wikipedia, Georges Cuvier, https://en.wikipedia.org/wiki/Georges_Cuvier
Wikipedia, Charles Lyell, https://en.wikipedia.org/wiki/Charles_Lyell
Wikipedia, Uniformitarianism, https://en.wikipedia.org/wiki/Uniformitarianism
Wikipedia, Chicxulub Crater, https://en.wikipedia.org/wiki/Chicxulub_crater
M.W. Browne, The Debate Over Dinosaur Extinctions Takes an Unusually Rancorous Turn, New York Times, Jan. 19, 1988, https://www.nytimes.com/1988/01/19/science/the-debate-over-dinosaur-extinctions-takes-an-unusually-rancorous-turn.html
Wikipedia, Alvarez Hypothesis, https://en.wikipedia.org/wiki/Alvarez_hypothesis
Wikipedia, Cretaceous-Paleogene Extinction Event, https://en.wikipedia.org/wiki/Cretaceous%E2%80%93Paleogene_extinction_event
Wikipedia, Christmas Island Shrew, https://en.wikipedia.org/wiki/Christmas_Island_shrew
Aussie Animals, Lost Forever – Seven Australian Mammals Declared Extinct in 2025, https://aussieanimals.com/wildlife/extinct/mammals-extinct-2025/
Wikipedia, Great Auk, https://en.wikipedia.org/wiki/Great_auk
Wikipedia, Passenger Pigeon, https://en.wikipedia.org/wiki/Passenger_pigeon
Intergovernmental Science-Policy Platform on Biodiversity and Ecosystem Services, https://www.ipbes.net/
Our World in Data, Biodiversity, https://ourworldindata.org/biodiversity
Wikipedia, Allee Effect, https://en.wikipedia.org/wiki/Allee_effect
Wikipedia, Steller’s Sea Cow, https://en.wikipedia.org/wiki/Steller%27s_sea_cow
Wikipedia, Pleistocene, https://en.wikipedia.org/wiki/Pleistocene
Wikipedia, White Rhinoceros, https://en.wikipedia.org/wiki/White_rhinoceros
General Knowledge 360, Top 7 Fish Species Threatened by Overfishing, https://generalknowledge360.com/top-7-fish-species-threatened-by-overfishing/
Our World in Data, Fish and Overfishing, https://ourworldindata.org/fish-and-overfishing
Wikipedia, List of Endangered Fishes, https://en.wikipedia.org/wiki/List_of_endangered_fishes
J. Murray, What Fish are Going Extinct Because of Overfishing?, IERE, Nov. 22, 2025, https://iere.org/what-fish-are-going-extinct-because-of-overfishing/
American Oceans, Most Endangered Species in the Ocean, https://www.americanoceans.org/facts/most-endangered-marine-species/
DebunkingDenial, Why You Should Care About Climate Change: What the Data Tell Us, Parts I and II, https://debunkingdenial.com/our-presentations-powerpoint/
E. Greenfield, The Impact of Climate Change on Species Migration: How Warming Earth is Redrawing Nature’s Maps, SigmaEarth, May 1, 2025, https://sigmaearth.com/the-impact-of-climate-change-on-species-migration-how-warming-earth-is-redrawing-natures-maps/
Science News Today, 10 Polar Animals Endangered by Climate Change, Oct. 7, 2025, https://www.sciencenewstoday.org/10-polar-animals-endangered-by-climate-change
World Wildlife Fund, Australian Bushfires, https://wwf.org.au/what-we-do/australian-bushfires
I-C. Chen, et al., Rapid Range Shifts of Species Associated with High Levels of Climate Warming, Science 333, 1024 (2011), https://www.science.org/doi/10.1126/science.1206432
D. Carrington, Climate Change: Global Reshuffle of Wildlife Will Have Huge Impacts on Humanity, The Guardian, Mar. 30, 2017, https://www.theguardian.com/environment/2017/mar/30/climate-change-global-reshuffle-of-wildlife-will-have-huge-impacts-on-humanity
Centers for Disease Control and Prevention, About Alpha-gal Syndrome, https://www.cdc.gov/alpha-gal-syndrome/about/index.html
D.M. Ethier and G.W. Mitchell, Effects of Climate on Fall Migration Phenology of Monarch Butterflies Departing the Northeastern Breeding Grounds in Canada, Global Change Biology 29, 2122 (2023), https://onlinelibrary.wiley.com/doi/full/10.1111/gcb.16579
Animalia-Life Club, Monarch Butterfly Migration Map, https://animalia-life.club/qa/pictures/monarch-butterfly-migration-map
IERE, How Does Pollution Affect the Biodiversity?, June 6, 2025, https://iere.org/how-does-pollution-affect-the-biodiversity/
Fidra, Chemical Pollution in Wildlife, https://fidra.org.uk/chemical-pollution-wildlife/
DebunkingDenial, Case Studies on Toxic Product Defense, https://debunkingdenial.com/part-ii-case-studies-in-toxic-product-defense/
Plastic Pollution Coalition, How Microplastics are Changing the Oceans, June 26, 2025, https://www.plasticpollutioncoalition.org/blog/2025/6/26/how-microplastics-are-changing-the-oceans
M. Eriksen, et al., A Growing Plastic Smog, Now Estimated to Be Over 170 Trillion Plastic Particles Afloat in the World’s Oceans – Urgent Solutions Required, PLoS ONE 18, e0281596 (2023), https://journals.plos.org/plosone/article?id=10.1371/journal.pone.0281596
MAWeb, Invasive Species and Biodiversity Loss Explained, https://maweb.org/how-can-invasive-species-result-in-biodiversity-loss/
Defenders of Wildlife, How Do Invasive Species Affect Biodiversity and How Can They Be Controlled?, Aug. 25, 2023, https://defenders.org/blog/2023/08/how-do-invasive-species-affect-biodiversity-and-how-can-they-be-controlled
The Wildlife Society, TWS Issue Statement: Feral and Free-Ranging Domestic Cats, Mar. 21, 2025, https://wildlife.org/tws-issue-statement-feral-and-free-ranging-domestic-cats/
Wikipedia, Cane Toads in Australia, https://en.wikipedia.org/wiki/Cane_toads_in_Australia
National Oceanic and Atmospheric Administration, Why Are Coral Reefs Important?, https://oceanservice.noaa.gov/education/tutorial_corals/coral07_importance.html
L. Plaisance, M.J. Caley, R.E. Brainard, and N. Knowlton, The Diversity of Coral Reefs: What Are We Missing?, PLoS ONE 6, e25026 (2011), https://journals.plos.org/plosone/article?id=10.1371/journal.pone.0025026
National Oceanic and Atmospheric Administration, How Does Climate Change Affect Coral Reefs?, https://oceanservice.noaa.gov/facts/coralreef-climate.html
Great Barrier Reef Foundation, Climate Change, https://www.barrierreef.org/the-reef/threats/climate-change
National Oceanic and Atmospheric Administration, What Is Coral Bleaching?, https://oceanservice.noaa.gov/facts/coral_bleach.html
S.B. Tebbett, S.R. Connolly, and D.R. Bellwood, Benthic Composition Changes on Coral Reefs at Global Scales, Nature Ecology & Evolution 7, 71 (2023), https://www.nature.com/articles/s41559-022-01937-2
R.L. Parry, et al., Book Sent to Schools Contains Misleading Climate Change Claims, AFP Fact Check, Feb. 22, 2023, https://factcheck.afp.com/doc.afp.com.339G4NM
Intergovernmental Panel on Climate Change, Sixth Assessment Report, https://www.ipcc.ch/assessment-report/ar6/
NOAA Coral Reef Watch, Current Global Bleaching: Status Update & Data Submission, https://coralreefwatch.noaa.gov/satellite/research/coral_bleaching_report.php
K.V. Rosenberg, et al., Decline of the North American Avifauna, Science 366, 120 (2019), https://www.science.org/doi/10.1126/science.aaw1313
S. Milius, Cats Kill More Than One Billion Birds Each Year, ScienceNews, Jan. 29, 2013, https://www.sciencenews.org/article/cats-kill-more-one-billion-birds-each-year
S. Milius, Windows May Kill Up to 988 Million Birds a Year in the United States, ScienceNews, Jan. 27, 2014, https://www.sciencenews.org/article/windows-may-kill-988-million-birds-year-united-states
U.S. Geological Survey, North American Breeding Bird Survey Dataset (1966-2025), https://www.usgs.gov/data/2026-release-north-american-breeding-bird-survey-dataset-1966-2025
Audubon Society, Audubon Christmas Bird Count, https://www.audubon.org/community-science/christmas-bird-count
Manomet Conservation Sciences, International Shorebird Survey, https://www.manomet.org/project/international-shorebird-survey/
Audubon Society, U.S. Bird Populations Continue Alarming Decline, New Report Finds, Mar. 13, 2025, https://www.audubon.org/press-room/us-bird-populations-continue-alarming-decline-new-report-finds
U.S. Fish and Wildlife Service, 2022 National Survey of Fishing, Hunting, and Wildlife-Associated Recreation, https://www.fws.gov/sites/default/files/documents/Final_2022-National-Survey_101223-accessible-single-page.pdf
The Central Grasslands Roadmap Initiative, https://www.grasslandsroadmap.org/
Audubon Society, Survival by Degrees: 389 Bird Species on the Brink, https://www.audubon.org/climate/survivalbydegrees
J.A. Luedtke, et al., Ongoing Declines for the World’s Amphibians in the Face of Emerging Threats, Nature 622, 308 (2023), https://www.nature.com/articles/s41586-023-06578-4
Extinct Animals, Amphibians, https://www.extinctanimals.org/category/amphibians
Wikipedia, Chytridiomycosis, https://en.wikipedia.org/wiki/Chytridiomycosis
Wikipedia, Batrachochytrium dendrobatidis, https://en.wikipedia.org/wiki/Batrachochytrium_dendrobatidis
Wikipedia, Batrachochytrium salamandrivorans, https://en.wikipedia.org/wiki/Batrachochytrium_salamandrivorans
BsalEurope, Mitigating Batrachochytrium salamandrivorans in Europe, http://bsaleurope.com/wp-content/uploads/2021/03/Bsal-Action-Plan.pdf
Our World in Data, There Have Been Five Mass Extinctions in Earth’s History, https://ourworldindata.org/mass-extinctions
Britannica, What Happened to the Dinosaurs?, https://www.britannica.com/story/what-happened-to-the-dinosaurs
A.D. Barnosky, et al., Has the Earth’s Sixth Mass Extinction Already Arrived?, Nature 471, 51 (2011), https://www.nature.com/articles/nature09678
Science Insights, What is a Biodiversity Index and How is it Calculated?, Nov. 5, 2025, https://scienceinsights.org/what-is-a-biodiversity-index-and-how-is-it-calculated/
M. Sterling, Ecosystem Diversity: Crucial for Life on Earth, Clover Chronicle, Apr. 22, 2025, https://cloverchronicle.com/ecosystem-diversity/
Wikipedia, Convention on Biological Diversity, https://en.wikipedia.org/wiki/Convention_on_Biological_Diversity
Convention on Biological Diversity, Conference of the Parties, https://www.cbd.int/cop
Convention on Biological Diversity, The Cartagena Protocol on Biosafety, https://bch.cbd.int/protocol
Convention on Biological Diversity, The Nagoya Protocol on Access and Benefit-Sharing, https://www.cbd.int/abs
Convention on Biological Diversity, Strategic Plan for Biodiversity 2011-2020, https://www.cbd.int/sp
Convention on Biological Diversity, Quick Guides for the Aichi Biodiversity Targets, https://www.cbd.int/nbsap/training/quick-guides
Convention on Biological Diversity, Kunming-Montreal Global Biodiversity Framework, https://www.cbd.int/gbf
Convention on Biological Diversity, Global Biodiversity Outlook, https://www.cbd.int/gbo
Wikipedia, Intergovernmental Science-Policy Platform on Biodiversity and Ecosystem Services, https://en.wikipedia.org/wiki/Intergovernmental_Science-Policy_Platform_on_Biodiversity_and_Ecosystem_Services
The White House, Withdrawing the United States from International Organizations, Conventions, and Treaties that Are Contrary to the Interests of the United States, Jan. 7, 2026, https://www.whitehouse.gov/presidential-actions/2026/01/withdrawing-the-united-states-from-international-organizations-conventions-and-treaties-that-are-contrary-to-the-interests-of-the-united-states/
Calouste Gulbenkian Foundation, 2022 Gulbenkian Prize for Humanity Distinguishes IPBES and IPCC, Oct. 13, 2022, https://gulbenkian.pt/en/news/2022-gulbenkian-prize-for-humanity-distinguishes-ipbes-and-ipcc/
Asahi Glass Foundation, 2024 Blue Planet Prize Laureates, https://www.af-info.or.jp/en/blueplanet/list_2024.html
Wikipedia, Rewilding, https://en.wikipedia.org/wiki/Rewilding
C. Wolf and W.J. Ripple, Rewilding the World’s Large Carnivores, Royal Society Open Science 5, 172235 (2018), https://pmc.ncbi.nlm.nih.gov/articles/PMC5882739/
S. Carver, et al., Guiding Principles for Rewilding, Conservation Biology 35, 1882 (2021), https://conbio.onlinelibrary.wiley.com/doi/10.1111/cobi.13730
DebunkingDenial, Reviving Extinct Species, Part I: Background and Saving Endangered Species, https://debunkingdenial.com/reviving-extinct-species-part-i-background-and-saving-endangered-species/
DebunkingDenial, Reviving Extinct Species, Part II: De-extinction Biotechnology and Projects, https://debunkingdenial.com/reviving-extinct-species-part-ii-de-extinction-biotechnology-and-projects/
J. Cole, Rewilding Takes Hold in Illinois, Sierra Magazine, July 7, 2026, https://www.sierraclub.org/sierra/rewilding-takes-hold-illinois
Wikipedia, American Prairie (Nature Preserve), https://en.wikipedia.org/wiki/American_Prairie_(nature_reserve)
Wikipedia, European Green Belt, https://en.wikipedia.org/wiki/European_Green_Belt
Wikipedia, Kavango–Zambezi Transfrontier Conservation Area, https://en.wikipedia.org/wiki/Kavango%E2%80%93Zambezi_Transfrontier_Conservation_Area

