
January 20, 2024
I. the challenge
In several of our previous posts (for example, here and here) we have presented the evidence that the burning of fossil fuels is the primary contributor to ongoing global warming and the dangerous climate change the warming causes. Several skeptics and deniers of human-caused climate change have argued that it is unfair to deny developing countries the opportunity to grow their economies by burning fossil fuels, regardless of the greenhouse gases such energy production emits into Earth’s atmosphere. For example, in his book Unsettled? Steven Koonin argues that “the developing world has a host of far more immediate and pressing problems [than climate change] facing it…it’s natural to ask ‘Who will pay the developing world not to emit?’” In our review of Koonin’s book we suggested “that the proper answer to Koonin’s question is that it is in the self-interest of the prosperous nations to adopt policies and commit resources to accelerate the development of reliable and cost-competitive renewable energy production and electric vehicles, so that developing countries find these alternatives to be the preferred options as their population and GDP grow.” Indeed, there is rapid worldwide research and development going on, in both industry and government-funded research laboratories, to improve the efficiency, availability, and cost of solar and wind power and the batteries to store energy from such intermittent sources. In this post we survey some of these recent developments.

It is useful for calibration to first lay out how daunting the challenge is for renewable energy development. Worldwide electricity demand in 2021 totaled 28.4 petawatt-hours (PWh), or 28.4 million gigawatt-hours (GWh). [One gigawatt-hour corresponds to one billion watt-hours, or the energy that could be delivered by a megawatt power source operating for 1000 hours.] Various models for increases in human population and standard of living in highly populated countries project that total to rise, even accounting for improvements in the efficiency of electricity usage, to somewhere between 50 and 100 PWh by 2050. Figure I.1 is based on one such model of population and standard of living growth. In 2021 roughly half of that demand was met by fossil fuel burning plants that must be getting phased out by 2050 if the planet is to avoid the most devastating impacts of climate change. About a third of the 2021 demand was met via nuclear and hydropower, neither of which is currently projected to increase in capacity by mid-century: hydropower is pretty much optimally exploited already around the world, while many aging nuclear power plants will be retired by 2050, and will have only begun to be replaced by new small modular power reactors. Nuclear fusion may become a major source of worldwide energy production during the second half of this century but is unlikely to be a significant factor yet by 2050.
Thus, as indicated in Fig. I.1, newly developed renewable energy sources will have to supply 70% or more of worldwide electricity demand by 2050, requiring an order of magnitude increase in worldwide renewable energy capacity, or an average annual growth rate of 9% between now and mid-century. The good news is that solar and wind power are still undergoing rapid research and development. In order to meet the mid-century demand, one will need to see very substantial increases in:
• Access to materials and manufacturing capacity for solar and wind power
• Worldwide installations of solar and wind power
• Continuing reductions in cost of solar and wind power
• Improvements in the efficiency of converting solar and wind power to electrical and/or thermal power
• Increased storage capacity for these variable energy sources
We will review recent developments on multiple fronts that provide reasons for optimism that these daunting demands on renewable energy can be met. An excellent resource for readers who want a broader introduction to the underlying science of energy production and usage is The Physics of Energy by Robert Jaffe and Washington Taylor, which contains a chapter on renewables.
II. increased implementation of existing technology
New installations of solar and wind power are proceeding at healthy rates, despite difficult financial conditions in many countries over the past few years. In 2023 alone the International Energy Agency (IEA) projected that more than 440 gigawatts (GW) of renewable power capacity would be added worldwide by year’s end. To put that number in perspective, it is greater than the total installed power capacity in Germany and Spain, combined. It is comparable to the total power of the world’s operating nuclear power plants. However, fossil fuel and nuclear power plants have the capability to maintain continuous output over each day and all year, while solar and wind power are variable during the day and during the year, so that the nuclear power contribution to total electric energy consumption is still somewhat larger than the current contribution from wind and solar, as indicated in Fig. I.1.
China added about 200 GW of solar power installations in 2023, covering great swaths of land with solar panels (see Fig. II.1). Europe added 58 GW. The price of photovoltaic solar panels in Europe fell between 40 and 53% between Dec. 2022 and Nov. 2023. Solar power is now the cheapest source of electricity in a majority of the world’s countries. In the U.S. the fraction of annual electricity demand met by solar power grew by a factor of 50 from 2010 to 2021, greatly aided by federal and state financial incentives. Solar power contributions to electricity demand now exceed or approach 20% in California, Hawaii, and several other U.S. states. The Inflation Reduction Act passed by Congress in 2022 is already reaping benefits in the solar manufacturing sector: more than 60 new U.S. solar manufacturing facilities were announced in 2023.

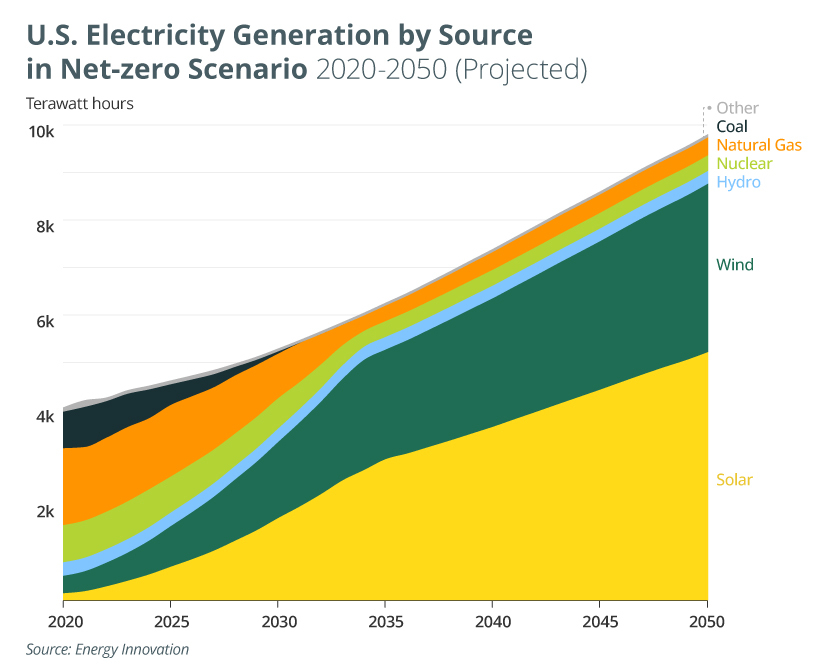
In 2022 the U.S. had more than 300 GW of electricity-generating capacity from renewable sources. As shown in Fig. II.2, projections that have the U.S. meeting energy demand through 2050 while phasing out fossil fuels will require the addition of wind power installations capable of delivering more than 3 PWh per year and of solar power installations producing nearly 5 PWh per year. (While the U.S. federal government has declared a non-binding goal for all electric generation to be provided from clean resources by 2035, it includes among “clean” resources a substantial role for natural gas production with carbon capture.) In order to come anywhere near that solar power goal, for example, more than 30 GW of new solar installations will have to be made each year within the country from now through mid-century. But that annual demand is still much smaller than what China added in 2023 alone. The demands on wind and solar power may be slightly ameliorated if new small modular nuclear reactors make a significant dent in the energy sector.
Wind power grew less aggressively than solar power during 2023, largely as a result of high inflation, material costs, and interest rates in many countries. Still, China managed to add more than 58 GW of wind turbine installations and is well on track to comfortably surpass the country’s 2030 target of 1200 GW of installed utility-scale solar plus wind power capacity. Worldwide, the wind power industry “celebrated passing 1 terawatt [= 1000 GW] of installed wind energy worldwide. It took more than 40 years to reach that milestone, but it could take less than seven years for the second terawatt, at the pace the industry is on now.” Analysts are currently predicting that, with financial headwinds dissipating (no pun intended), worldwide wind energy capacity should grow by about 12% in 2024.
In the U.S., as suggested in Fig. II.2, rapid growth in wind power is anticipated by 2035 as installations expand to new parts of the country on land and the country’s first commercial-scale offshore wind farms come online. The first installed turbine of the South Fork Wind Farm off the shore east of Montauk, Long Island is now producing power. Meanwhile, large offshore wind farms have been producing electricity for Europe for three decades and for Asia more recently.
III. advances in solar power technology
Photovoltaic efficiency:
In order to meet the aggressive projections for solar power expansion in the figures above, it will be necessary to supplement implementation growth with efficiency improvements. Photovoltaic panels operate on the basis of the photoelectric effect: light incident from the Sun has energy carried by photons, and when a photon is absorbed by certain semiconductor materials, it can excite initially bound electrons across a material-dependent “band gap” in energy into the conduction band of those materials, where the electrons become free to flow and thereby become accessible for electricity production.

The operation of the most prevalent photovoltaic cells is illustrated in Fig. III.1. Two semiconductor samples are joined across a single junction. The upper layer is called “n-type” because current flowing through it is carried by negatively charged electrons excited to the conduction band. The lower layer is called “p-type” because current is carried through it effectively by the migration of positively charged holes created by the absence of electrons in states below the band gap. When solar photons are absorbed, electrons from the p-type layer can be excited across the junction into the conduction band of the n-type layer, where they can flow toward the upper terminal. Meanwhile, the holes left behind in the p-type layer get successively filled by electrons eventually drawn from the lower terminal; effectively, the holes in the p-type layer migrate to the lower terminal. The excess of negative charge built up on the upper terminal and of positive charge built up on the lower terminal produces a voltage difference that can continue to drive a current external to the cell.
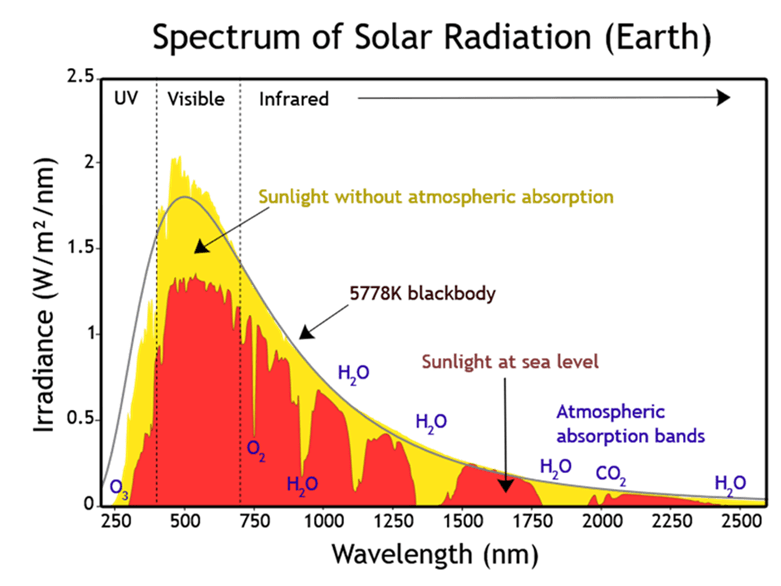
But sunlight reaching Earth’s surface (see Fig. III.2) comprises a broad spectrum of light wavelengths or photon energies and the photovoltaic effect works well for a given material only over a restricted range of those photon energies, tied to the band gap energy of the semiconductor material used. The vast majority of commercial solar panels in use today use silicon as the semiconductor material, which is most efficient near the red end of the visible light spectrum. The theoretical maximum conversion efficiency of sunlight to electrical power for silicon is 29% and the best commercial cells reach about 24.5%. Small research cells in the laboratory have reached 27%.
The best way to improve solar panel efficiency is to manufacture cells which combine silicon with another semiconductor material whose photovoltaic efficiency is optimized for blue light. The most promising alternative materials for the near future are perovskites, materials first discovered in Russia in 1839, with a distinctive crystal structure containing molecules with atoms from various elements. (The original perovskite, calcium titanate, is mined in Switzerland, Italy, and Arkansas, in addition to Russia.) Today, perovskites refer to a broad class of chemical compounds whose properties can be tuned to some extent. “There are three main reasons perovskites are so interesting to solar researchers:
- They are relatively easy to make without special high-heat processes [unlike crystalline silicon]
- They can be deposited onto surfaces in simple ways via liquid or vapor
- They can be ‘tuned’ to produce electricity from various wavelengths of light, meaning they can capture photons that silicon cells cannot”
The most interesting perovskites for the solar industry are crystals built from organic and inorganic molecules connected to atoms of lead or tin. One example is shown in Fig. III.3: it represents a lead halide perovskite crystal, comprising an 8-sided grid of lead halide molecules (one lead atom bonded with six halogen atoms of iodine, bromine, or chlorine) surrounding an organic molecule called a methylammonium cation. Despite the apparently complex crystal structure, the material is relatively straightforward to make in the laboratory.

One could imagine substituting an appropriate perovskite material for silicon in a thin film solar cell, as illustrated on the left-hand side of Fig. III.4, but that would not by itself lead to much gain in overall conversion efficiency. The better approach being pursued in research today is the manufacture of tandem cells (right side of Fig. III.4), in which a layer of perovskite can be deposited onto a crystalline silicon-based cell, thereby expanding the range of light wavelengths that contribute to the output electrical current. This design of a tandem cell containing two junctions is one example of a broader class of so-called heterojunction cells containing different layers of semiconductor material sandwiched together. In the future, one can anticipate research also on tandem cells containing two perovskite layers chemically tuned to be optimized for different regions of the sunlight spectrum.
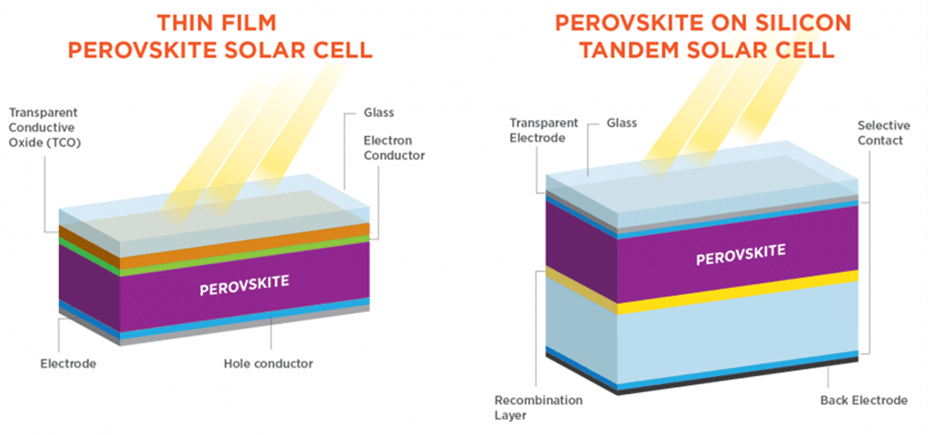
Figure III.5 from the National Renewable Energy Laboratory in Golden, Colorado summarizes the history of solar cell development, showing research results for the solar conversion efficiency of small cells of a wide array of structures. The results to date for tandem cells made from perovskite and crystalline silicon are indicated by a solid red line joining right-side-up solid black triangles representing measurements and rising rapidly since a 2017 onset. These results show that several groups worldwide have by now attained efficiencies clearly exceeding 30% for these small (typically about 1 cm square) tandem cells. In particular, “Chinese company LONGi, the world’s biggest producer of solar cells, announced in June they had reached 33.5% in their research.”
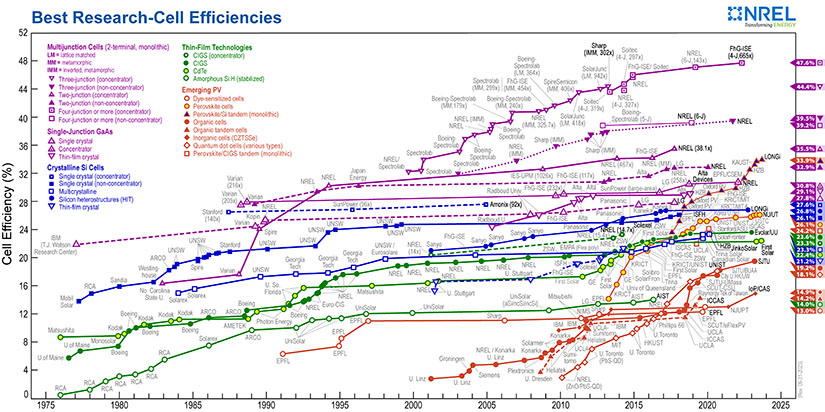
Research on the tandem cells continues, and the practical limit to their efficiency probably exceeds 35%. But several important challenges remain to be overcome before this technology can be applied commercially. First, one needs to manufacture cells of commercial scale, which are typically about 15 cm squares. The UK company Oxford PV has already attained an efficiency of 28.6% in a commercial-sized photovoltaic tandem cell. Experience in other laboratories with smaller cells suggests that efficiency can be improved by cleaning up tiny surface defects on the perovskite layer. The more critical issue is longevity. Today’s commercial panels retain 80-90% of their efficiency after 25 years of operation. However, perovskites tend to break down after long exposure to oxygen and moisture. But, as summarized in an article in Solar Reviews, “advancements have been made in recent years that have greatly improved the stability of perovskite solar cells, and companies are very close to bringing commercial perovskite products to the market,” probably within the next five years.
As seen in Fig. III.5, there are alternative technologies, mostly involving multi- (more than two-) junction cells, that have generated solar conversion efficiencies as high as 47%. But these are small research cells that are, unlike perovskite-silicon tandem cells, quite expensive to produce. They are therefore unlikely to affect the commercial market for solar panels, but may be of interest for “niche uses such as on space satellites or when sunlight is highly concentrated on to the cells.” Nonetheless, there is a lot of research continuing on solar cell technology and additional significant efficiency improvements may well come over the next decade.
Solar land use:
Another area of anticipated rapid expansion in deployment of solar power involves land use. Figure III.6 illustrates the total land use that will be required to meet the U.S. goals for solar power by 2050, in comparison with the fractions of U.S. surface area occupied by several sectors. While contaminated land suitable for photovoltaic installations is nearly enough to meet the substantial need, major expansion is expected into unshaded agricultural lands and bodies of water.

The use of solar panel farms covering parts of agricultural farms, as illustrated schematically in Fig. III.7 – constituting agrivoltaics– is already rapidly expanding. Raised solar panels covering either planting or grazing fields or greenhouses have the potential to enhance farming revenues in a few ways, while also addressing climate change. Solar power can reduce the costs of electricity needed to operate the farm, while also bringing in additional revenue from energy sold to local users or provided to the electrical grid. The solar panels can furthermore provide shade to crops that benefit from it, such as tomatoes and corn, thereby reducing water evaporation from the soil. In turn the growing plants do their own part in a symbiotic relationship by giving off water vapor that cools the solar panels from below, increasing photovoltaic efficiency. Solar panels installed in grazing areas, for example for sheep, can use the animals to replace the need to mow rapidly growing grasses in between the rows of panels, so that the panels don’t become shaded by grasses.

The first agrivoltaic installations have been in operation in Europe and Asia for about a decade now. The largest existing site in the U.S. is a 10-acre, 4.2-megawatt installation on a blueberry farm in Rockport, Maine. A number of solar grazing pastures are installed around the country. Research to optimize the advantages of agrivoltaics is being managed in the U.S. by the National Renewable Energy Laboratory (NREL), with support from the U.S. Department of Energy. There is also a substantial amount of ongoing research overseas. For example, “In Switzerland, the company Insolight is developing translucent solar modules with an integrated tracking system that allows the modules to remain static. The module uses lenses to concentrate light onto solar cells and a dynamic light transmission system to adjust the amount of transmitted light and adapt to agricultural needs.”
The solar industry also anticipates rapid growth in the installation of floating solar panel arrays – so-called floatovoltaics – in bodies of calm water such as drinking water reservoirs, quarry lakes, and irrigation canals, where surface area can be considerably cheaper than on land. A photo of the largest floatovoltaic installation in the U.S., atop a water treatment reservoir in New Jersey, is shown in Fig. III.8. These arrays are mounted to float and also provide symbiotic advantages with the bodies of water beneath them. Shade from the solar arrays can reduce algal blooms and evaporation from the body of water – especially important in drought-prone areas — while the water provides cooling that increases the photovoltaic efficiency.

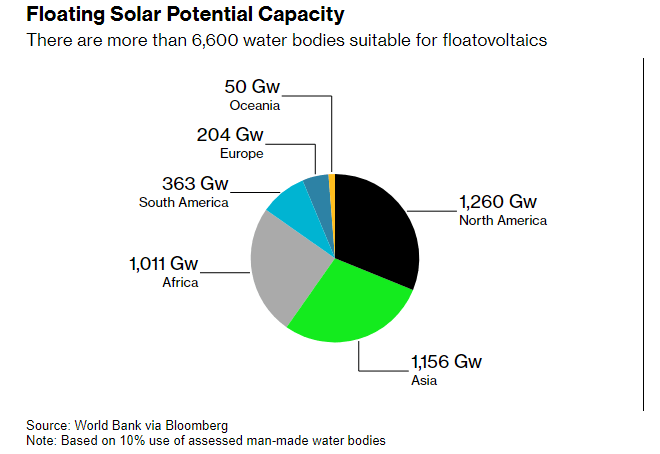
The market for floatovoltaics has been expanding rapidly worldwide since 2016, as shown in Fig. III.9. By 2022 there were 13 GW of floatovoltaic power installed and operating worldwide. Furthermore, the World Bank estimates that if 10% of the water surface in 6,600 suitable worldwide water bodies were covered with floating solar arrays of current design (i.e., not even counting on efficiency improvements from new cell design), one could generate more than 5.2 PWh/year of electricity — more than the current total annual consumption of electricity in the U.S. and about 25% of the world’s need for solar energy by 2050, as indicated in Fig. I.1. The installed floatovoltaic power capacity would then be distributed among continents as illustrated in Fig. III.10.

Concentrating solar power:
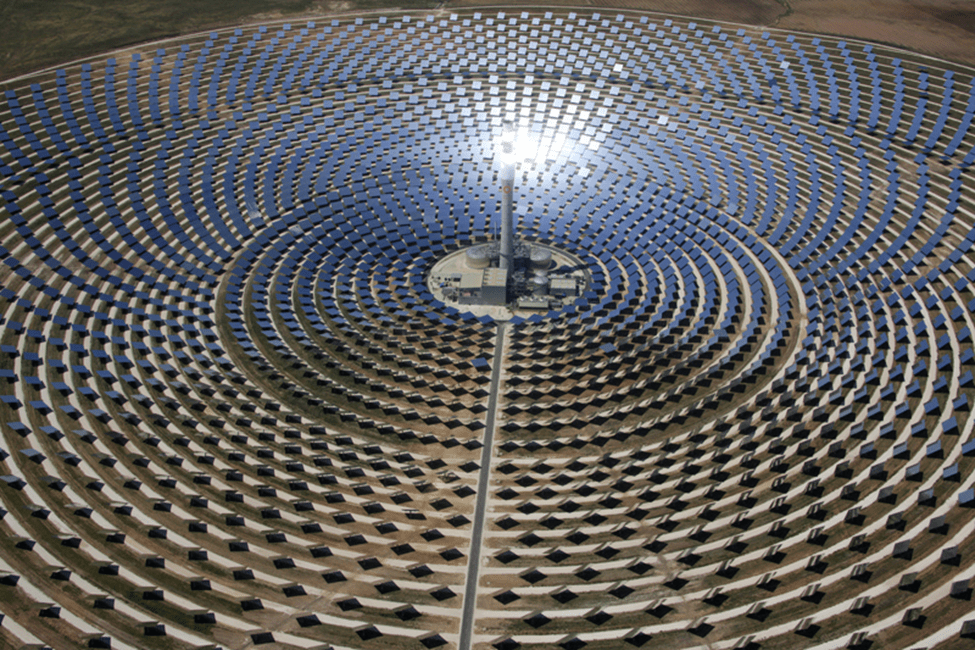
Although photovoltaics dominate today’s solar power market, they are not the sole technology for harnessing energy from the Sun. Concentrating solar power (CSP) plants use large arrays of mirrors, called heliostats, to focus reflected sunlight onto a receiver in a central tower, as shown in the photo (Fig. III.11) of a plant near Seville, Spain. The concentrated heat from the Sun can then be used to produce electricity via steam-driven turbines or to heat a liquid such as a molten salt capable of retaining the heat for many hours, thereby delivering energy at night as well as during the daytime to overcome the main drawback of solar energy’s usual variability. The stored heat can also be used to provide thermal power directly to industries that can use energy in this form. A large CSP plant can deliver about 250 megawatts of electrical power. Within the EU, for example, existing CSP plants delivered 16.6 TWh (trillions of watt-hours) of electricity during the year 2020, or about 1.4% of the total EU usage of renewable energy sources. In Spain alone, with its abundant sunlight exposure, CSP plants accounted for 20% of the country’s total electricity generation in 2019.
Improvements in mirror coatings, solar collectors, and heat storage, together with the introduction of tracking systems that rotate the mirrors to track the Sun’s movements during a day, have already increased CSP efficiency in power production by about 40% and reduced the cost of produced energy by about 60% over the past decade. Ongoing research within the U.S. to yield a third generation of CSP is aimed at lowering “the cost of CSP systems to approximately $0.05 per kilowatt-hour [down from current $0.091 per kWh] to help make solar baseload configurations cost competitive with other dispatchable power generators throughout the sunny, southern half of the United States.”
A major focus of ongoing CSP research in the U.S. is the use of new materials to raise the temperature at which thermal energy is stored from 565°C — characteristic of today’s most advanced CSP plants, and limited by breakdown in the molten nitrate salts used for heat storage — to 700°C, where the efficiency of converting thermal to steam-driven electrical energy would be significantly higher. For example, one advance being developed with funding from the U.S. Department of Energy is substituting a curtain of tiny solid ceramic particles falling continuously through the solar receiver for the more conventional molten salt liquid. The particles can be heated directly by the concentrated sunlight (see Fig. III.12), without the need to also heat tubes that contain a liquid, and are capable of reaching temperatures of 1000°C.

With existing technology the CSP market is projected to grow by about 16% annually between now and the end of this decade. With Gen3 advances available commercially by 2030 the growth rate should be further enhanced during the decades leading up to 2050.
IV. advances in wind power
Expansion of land-based wind farms:
As is the case with concentrating solar power, wind power is expected to increase rapidly from incremental improvements to existing technology within the 2020s and will likely benefit from novel technology developments in the decades beyond. In the U.S., for example, the majority of existing land-based wind farms have been installed in the Great Plains, where winds are strong at relatively low heights. But ongoing developments facilitate expanding both the tower height and blade length of conventional wind turbines, in order to gain access to winds at somewhat higher altitude in the Southeast, Gulf Coast, and parts of the East Coast. The anticipated expansion in land coverage by about 2030 is indicated in Fig. IV.1. The regions of the U.S. where wind power will be accessible complement well the sunny Southwestern regions where solar power (including CSP) will dominate renewable sources.

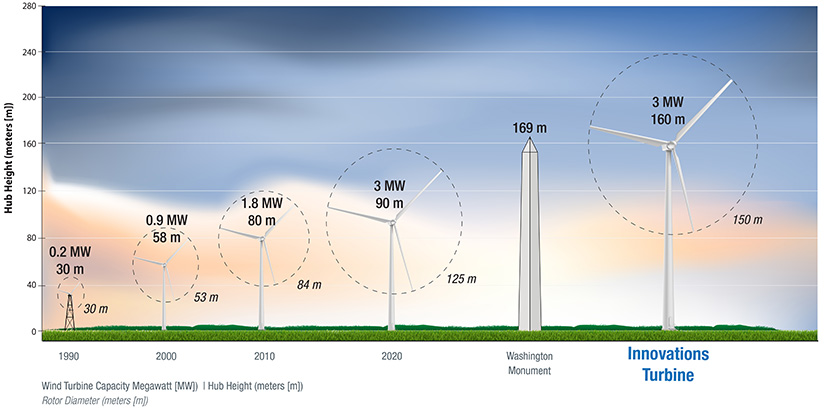
As NREL researchers have found, near-commercial improvements have made it possible to build wind turbines of 160 m tower height (comparable to that of the Washington Monument) and 150 m rotor diameter, both scaled up considerably in comparison with historical turbine developments (see Fig. IV.2). The increased size gives access to wind at higher elevations, where air density is lower, but wind velocity is higher. The power produced by a wind turbine is proportional to the air density times the square of the blade length and the cube of the wind velocity. Thus, the wind power increases significantly with these new, larger turbines, despite the loss in air density at higher elevations. These developments, in combination with more minor improvements in manufacturing and on-site assembly procedures and control over turbine orientation with respect to the ambient wind, should allow economically viable wind power in the U.S. to grow by 80% by 2030. Analogous growth should also be possible in other countries.
Offshore wind power:
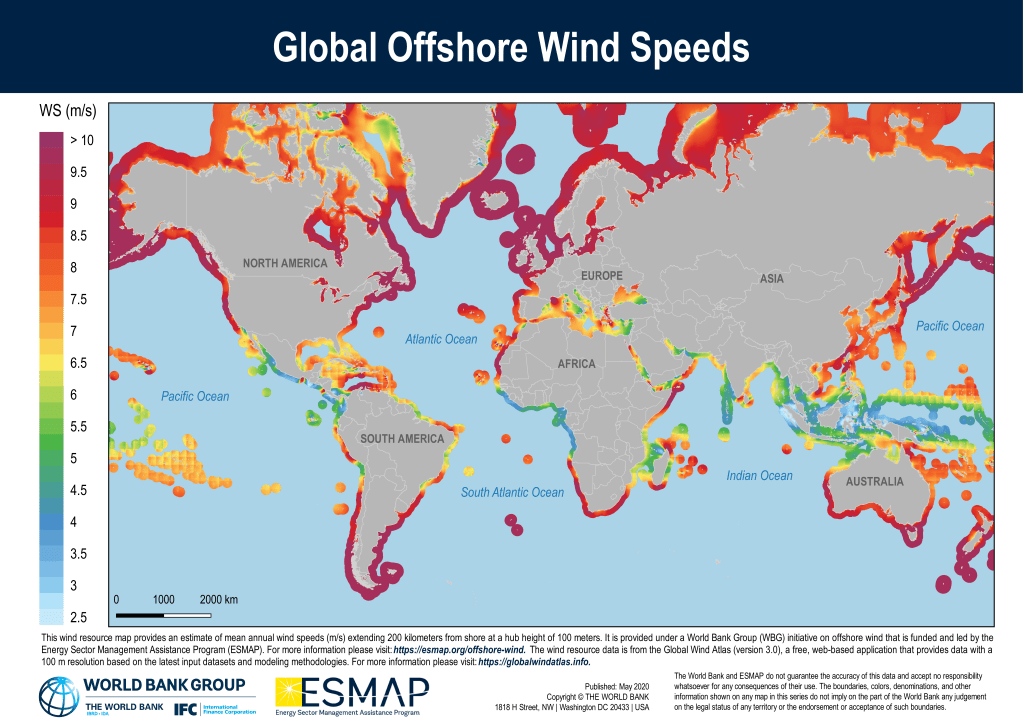
In addition to expanding wind farms over more land area, the coming decades are likely to see a major expansion of offshore wind farms, incorporating advances in technology. The strong advantage of offshore farms is that wind velocities are typically greater and more consistent than over land. A world map of average wind speeds in near offshore locations (where existing wind farms have been installed) is shown in Fig. IV.3. The main disadvantage that needed to be overcome before offshore farms could advance was the higher cost of installation. But, “offshore wind power in Europe became price-competitive with conventional power sources in 2017.” As the costs came down, offshore wind grew at 30% per year during the 2010s. As of 2022, the total worldwide capacity of offshore wind farms was 64 GW, with China, the UK, and Germany accounting for more than 75% of that total. Beginning in 2018 a number of US states on the Atlantic Coast began planning for significant offshore wind farms. The U.S. Department of Energy expects U.S. offshore wind capacity to grow to 22 GW by 2030.
Nearly all existing offshore farms are installed in shallow waters using the conventional apparatus with large blades rotating about a horizontal axis at the top of a very tall tower, as pictured in Fig. IV.4. The reason for this is that such horizontal-axis turbines have the generator, which converts the rotational motion of the rotor to electrical energy, and gearbox mounted near the blades, yielding a top-heavy turbine that needs a counter-weighted foundation to be fixed for stability to the sea floor. Maintenance on the blades, generator and gearbox at high altitude is a challenge offshore. Furthermore, the near-shore locations have led to many protests by coast dwellers who object to the disturbance of their views. Such protests have been a significant contributor to delays in the U.S. adoption of offshore farms.

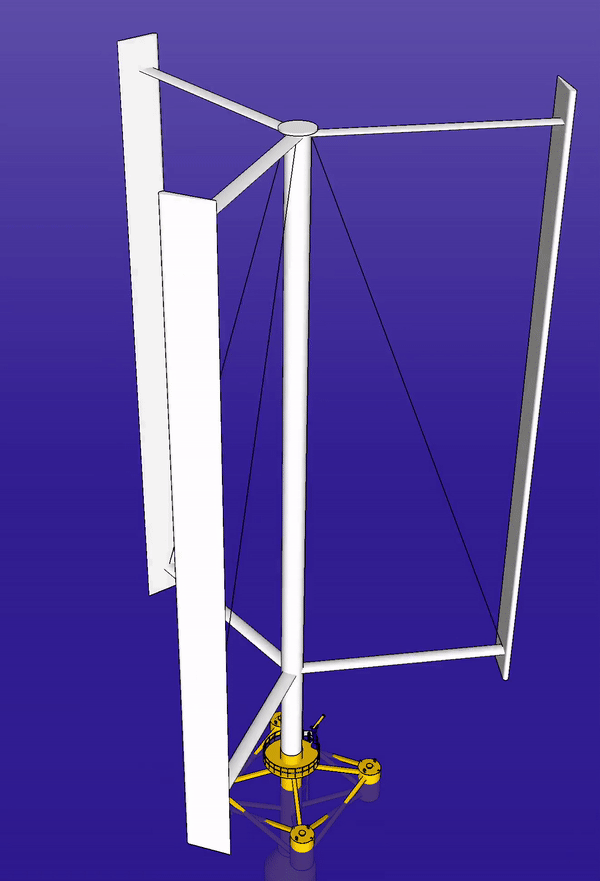
In order to expand wind capacity further from shores, where wind speeds are even greater and “visual pollution” is no longer a problem, one needs to use floating wind turbines to avoid the need to fix the foundations to the sea floor. At present there are only four floating wind farms installed worldwide, providing a cumulative power capacity of 193 MW. In the future, floating wind farms may benefit greatly from an alternative turbine design, in which blades rotate about the vertical tower axis, rather than around a horizontal axis sitting atop the tower. A schematic of a simple vertical-axis turbine design is shown in Fig. IV.5. Since the shaft rotates with the blades in this design, the generator and gearbox can be located near the base of the tower, facilitating maintenance and repair work and mitigating the demand for a heavily counter-weighted foundation.
A more conventional horizontal-axis turbine can be optimized by allowing for sensing of the wind direction and reorientation of the horizontal axis direction to make optimal use of the prevailing wind. These operations are not necessary with vertical axis rotation, since the blades can catch wind coming from any direction. However, this creates a different problem. The wind velocity points in the same direction as the orbital velocity of a vertical-axis turbine blade at only one point during its rotation; at other points the two velocities point in different directions. This means that the velocity of the wind relative to the rotating blade varies in magnitude and direction throughout the rotation. This leads to torques on the central shaft that point upward or downward and that vary in strength during the rotation. This torque ripple was a serious drawback for earlier vertical-axis turbine designs.
Torque ripple has been largely overcome by changing the blade design in later iterations of vertical-axis turbines. A particularly promising new design for a floating vertical-axis wind turbine is currently being prototyped by the Norwegian startup company World Wide Wind (WWW). The design, illustrated in Fig. IV.6, uses two concentric vertical shafts that are connected to two sets of blades that rotate in opposite directions, each set sweeping out the surface of a cone as it rotates. The use of two counter-rotating turbines neutralizes the net torque on the shaft and effectively doubles wind power capacity for each installed generator. The heavy, high-maintenance, hardware located “near the base or underwater…should allow the device to be taller and the blades larger,” increasing power capacity. Furthermore, because the enormous towers float with the greatest weight at the bottom, they are free to tilt away from the strictly vertical with the wind, without becoming unstable, thereby optimizing conversion of wind energy to output energy. In contrast to horizontal-axis turbines, the blade configuration here minimizes air turbulence created in the wake of a turbine. That, in turn, allows turbines to be located closer to one another than is typical of a land-based wind farm.
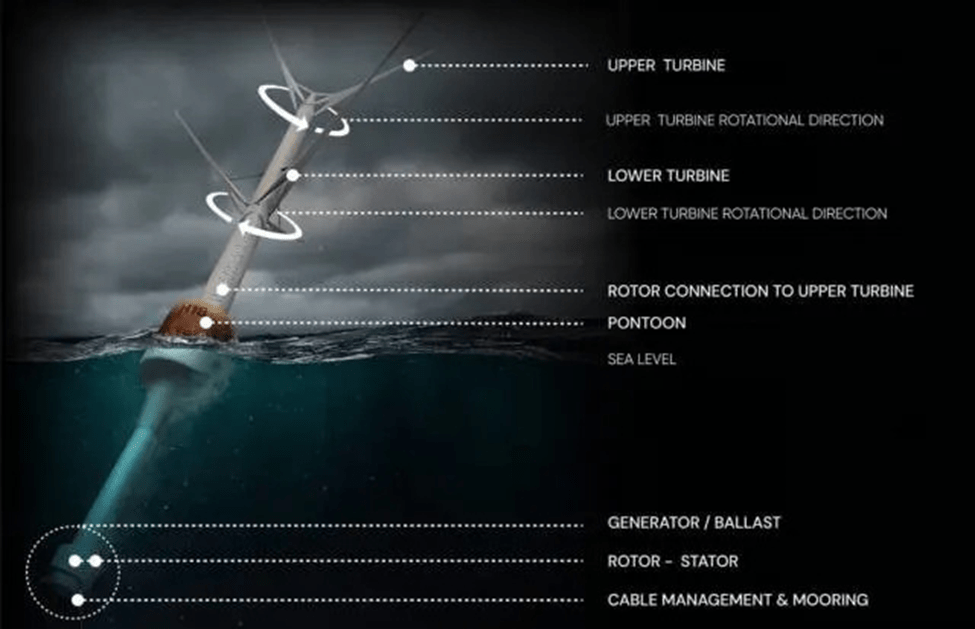
World Wide Wind’s test prototype of their floating, tilting, counter-rotating turbine is 62 feet tall with 30 kilowatt production capacity. The company plans to test a larger 1.5 MW prototype in 2025 and hopes to have a 24 MW version – more powerful than any current offshore turbine – commercially available by 2030. If these plans are accomplished, this new design has the potential to lead to a rapid expansion of worldwide offshore wind capacity beyond 2030.
V. advances in battery design
Despite the many new developments outlined above, wind and solar power remain intermittent sources of energy: the Sun only shines on a given solar panel for part of each day and wind strengths can vary substantially over days and seasons. To the extent that the energy mix retains some portion from natural gas and nuclear power, those sources can contribute to filling in for renewable variations. But in order to make optimal use of these renewable sources, one wants to efficiently store their surplus output energy when production is high to make it available to electrical grids when production is low. Concentrating solar power plants address the diurnal storage need by use of multi-hour heat storage in molten salts or possible ceramic particle streams. Some longer-term approaches for electric grid energy storage rely on using excess energy to store pressurized hydrogen, or pump water to higher elevation (where it could be used later to provide hydroelectric power), or compress air for underground storage until the air is released as needed to drive turbines. But photovoltaic and wind farms can also benefit greatly from improvements in the energy storage capacity of batteries. Ongoing battery improvements are being driven mostly by the needs of electric vehicles (EVs), which are on track to become the dominant part of new vehicle sales over the coming decades.
EV batteries:
Most EVs today, as well as solar panel storage batteries, are based on lithium-ion chemistry. The basic elements of a lithium-ion cell are illustrated schematically in Fig. V.1. A liquid or gel electrolyte capable of conducting electricity is sandwiched between solid anode and cathode, which are each connected to current collectors that attach to the external circuit. Lithium is stored alternately within the anode or cathode. Positive lithium ions flow between the anode and the cathode, crossing a porous thin polymer film that serves to keep the anode and cathode separated. When the battery is discharging, the anode releases lithium ions to the cathode, and this flow generates a current of electron flow in the opposite direction in the external circuit. But lithium-ion batteries are rechargeable by applying an external power source to drive lithium ions back from the cathode to the anode.

Lithium-ion technology has been developed over decades to make its cost moderate. But it has limitations in energy storage capacity (hence, in EV driving ranges), recharging times, battery lifetimes, and concerns about material supplies in the future, especially, lithium and the cobalt and nickel used in the most prevalent cathode construction. In particular, lithium mining is environmentally hazardous, as sulfuric acid and sodium hydroxide used in the extraction penetrate the soil and water, potentially poisoning ecosystems. Furthermore, when lithium-ion batteries overheat, they become dangerously flammable, as can be attested to by users of various exploding e-scooters and e-bikes, or by owners of recalled smart phones, computers, and hoverboards powered by lithium-ion batteries. The rapid growth anticipated over the next three decades in EV sales and renewable energy supply will therefore require parallel advances in battery technology. In the U.S. battery research and development has been boosted by the Inflation Reduction Act passed by Congress in 2022 which, through a combination of incentives and new funding opportunities, has supplied several billion dollars for U.S. battery development and production.
A major theme of ongoing battery R&D is work on solid-state batteries, which replace the liquid electrolyte used to transport charges in lithium-ion batteries or the polymer gel electrolyte in lithium polymer batteries with very thin solid electrolytes sandwiched between solid anode and cathode, as illustrated in Fig. V.2. Materials under study for the electrolytes include ceramics and solid polymers, while the most widely used anode material to date is metallic lithium (which is unsafe when used in combination with a liquid electrolyte) and cathode material is a metal oxide or sulfide. The solid electrolyte acts as a thin separator that allows only lithium ions to pass through. Proponents argue that solid-state batteries have the potential to “solve many problems of … Li-ion batteries, such as flammability, limited voltage, unstable solid-electrolyte interphase formation, poor cycling performance, and strength.” The unstable interphase formation refers primarily to the formation of dendrites, tree-like metal filaments that tend to form on the metal electrode during battery charging, which can eventually penetrate a liquid or gel electrolyte and short-circuit the battery.

One of the new companies developing solid-state batteries is the Silicon Valley startup QuantumScape, which attracted many hundreds of millions of investment dollars before going public in 2020. The company has a joint venture with Volkswagen to install long-lasting solid-state batteries in their EVs within this decade. At the end of 2022, QuantumScape announced that it had supplied prototype 24-layer lithium-metal solid-state batteries, with proprietary thin ceramic electrolytes in each layer, to EV manufacturers, including VW, for testing. Tests carried out by the VW subsidiary PowerCo have found that the QuantumScape cell “retained 95% of its range capacity after 1,000 charging cycles, or the equivalent of roughly 300,000 miles.” This is a substantial improvement over the current EV industry standard of 20% storage capacity loss over 700 charging cycles. Furthermore, QuantumScape claims that their technology “enables <15-minute fast charge (10-80%) by eliminating lithium diffusion bottleneck in anode host material.”
A competitor company, Solid Power, based in Colorado, has its own proprietary technology to make solid-state batteries with both lithium metal and silicon-based anodes and sulfide-based solid electrolytes. They aim to produce high energy density (i.e., high storage capacity packed into a small volume), fast-charging, and long-lasting batteries to automotive partners, including BMW and Ford, “to power 800,000 electrified vehicles using our all-solid-state battery cells annually by 2028.”
A number of other worldwide companies are taking a more incremental approach to improving the performance of batteries similar in philosophy to the lithium-ion standard. One approach seeks to reduce costs by replacing the expensive materials in the standard nickel-manganese-cobalt (NMC) cathodes with a low-cost alternative material, lithium iron phosphate (LFP). LFP market share in the global EV sector has risen rapidly from about 10% in 2018 to about 40% in 2022, despite their somewhat lower energy density (hence, lower vehicle range) and longer charging times than NMC lithium-ion batteries. Tesla has adopted LFP batteries for some of their lower-cost models, although the early experience of consumers suggests that the batteries may be losing 2% or more in range per year of operation.
Another tweak being considered for conventional lithium-ion batteries is to replace graphite as the anode material with silicon, which may increase energy density and speed up charging, but has questions concerning degradation and lifetime. Another cost-saving tweak, being pursued particularly by the Chinese battery giant CATL, involves replacing lithium-ion chemistry in liquid electrolyte batteries with sodium-ion chemistry. Questions persist, however, about the storage capacity and charging time of sodium-ion batteries. In all these efforts aimed at improving EV performance, the U.S. Department of Energy is investing heavily in facilities at its national laboratories to advance battery research, development, system analysis, and testing. The DOE labs coordinate their activities with those of the industry-run U.S. Advanced Battery Consortium.
Electrical grid storage:
While industry goals for EV batteries are to produce smaller (but higher energy density), lighter, and faster-charging batteries, these are not primary considerations for storage batteries to work with solar and wind electricity production. For those applications, the goal is to increase storage capacity and achieve multi-day storage times while cutting costs dramatically and minimizing degradation over time, but size and weight of the batteries are not a concern. Materials much heavier than, but also much more abundant than, lithium (the lightest metal) can be used. Thus, while battery R&D aimed at EVs may sometimes be adopted for several hour stationary electric grid energy storage, it is not likely to be optimal.
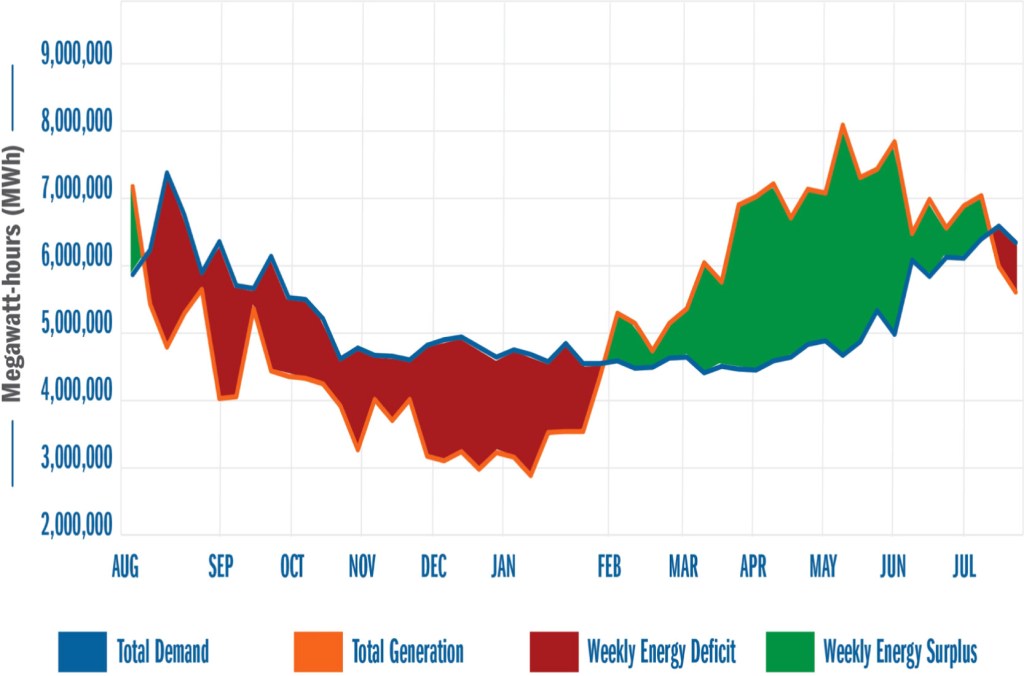
Two classes of long-duration energy storage needs have been defined and illustrated in an analysis by Twitchell, et al. They illustrate the needs by considering energy supply and demand in California, based on data from 2021 but assuming that wind and solar generation in the state would each be increased from present availability by a factor of 4.6 in order to replace generation that would be ineligible or unavailable in a future carbon-free scenario. Figure V.3 shows the daily electricity supply and demand in the month of July in this carbon-free scenario with California’s mix of solar, wind, and hydroelectric generation (the latter assumed constant at its present level). Because a renewable generation mix in California would be dominated by solar power, there is then a strong surplus of electricity produced during daylight hours and a strong deficit, compared to demand, at night. In order to meet the demand around the clock in such a scenario, one would need energy storage technology for at least 10 hours and up to 100 hours to compensate for multi-day weather events that limit solar and wind power output.

However, there is also a need for much longer energy storage to compensate for seasonal production surpluses and shortfalls. This need is illustrated for California under the above scenario in Fig. V.4. Renewable electricity production in California would greatly exceed demand in February through July but fall short during August to January. To compensate for such seasonal variations one needs energy storage that lasts for months. Technologies currently envisioned for seasonal grid storage involve hydrogen, pumped water, or compressed air storage. Battery storage, if relevant to the grid at all, is intended to meet the 10-100 hour need.
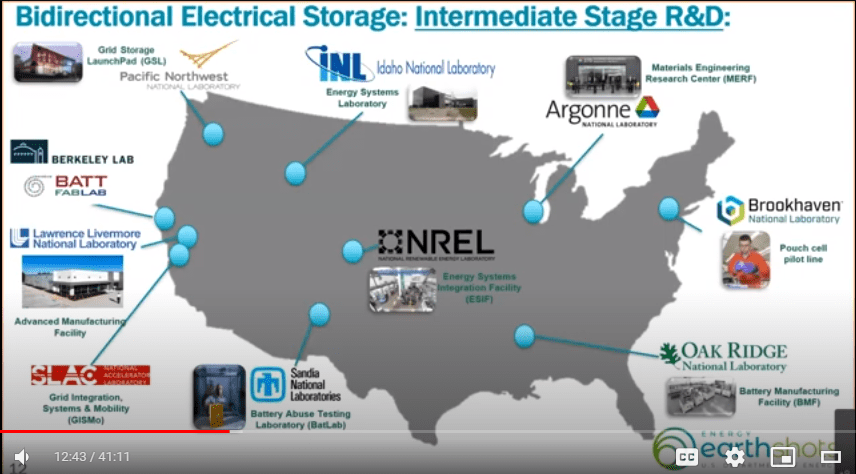
Toward the above ends, the U.S. Department of Energy is investing billions of dollars in a Long Duration Storage Energy Earthshot whose aim is to “reduce the cost of grid-scale energy storage by 90% for systems that deliver 10+ hours of duration within the decade” by considering “all types of technologies – whether electrochemical, mechanical, thermal, chemical carriers, or any combination that has the potential to meet the necessary duration and cost targets for grid flexibility.” The project is aimed at encouraging commercial partners to exploit facilities available at DOE’s national laboratories, especially for aiding every step of battery R&D; some of those facilities are labeled in Fig. V.5.
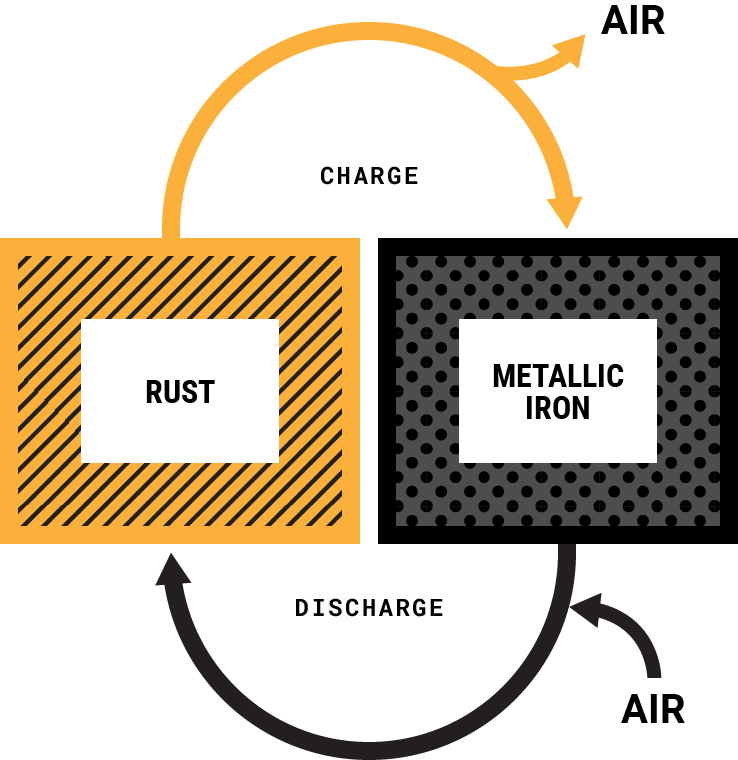
In the industry sector, two companies – Form Energy in Weirton, West Virginia and ESS in Wilsonville, Oregon – are developing novel, but quite different, iron-based batteries –using inexpensive and abundant materials — for stationary storage applications. The Form Energy project, for example, is an iron-air battery that uses a water-based, non-flammable liquid electrolyte and stores energy using “reversible rusting.” As illustrated in Fig. V.6, the battery discharges by taking in oxygen from the air (which serves effectively as one electrode) and uses the oxygen and contact with the water electrolyte to convert iron metal (the other electrode) to rust (iron oxide); it charges when an electric current is applied to convert the rust back to iron, while giving off oxygen. Form Energy claims that their battery technology stores energy for days (as might be needed when extended weather events limit solar and wind production) at less than 10% of the cost per watt-hour of lithium-ion batteries. But, in dramatic contrast to the demands of EVs, “each individual battery module is about the size of a side-by-side washer/dryer set and contains a stack of approximately 50 one meter-tall cells.” These modules can be grouped together in large “farms” to enable grid energy storage for intermittent renewable sources. Form Energy is currently working to supply iron-air systems capable of storing hundreds of MWh by 2026 in partnership with utilities in Virginia, Minnesota, Colorado, Georgia, and New York.
EOS Energy Storage is developing zinc-powered batteries capable of storing energy for 3 – 12 hours, using highly abundant materials. A carbon-felt cathode and conductive plastic anode are separated by a proprietary aqueous electrolyte, combining water, halides, additives, and buffering agents. The electrolyte is designed to enhance the solubility of zinc ions and their ability to be plated onto either anode or cathode. The batteries store energy by building up zinc deposition on the cathode; during discharge the zinc ions are released from the graphite felt and move through the electrolyte to form deposits on the plastic anode. In addition to lengthening storage durations and lowering cost, the technology appears to have several other advantages over lithium-ion batteries: the aqueous-based systems are non-flammable and experience very low degradation. EOS claims their zinc batteries can last for 20 years or more. In addition the zinc batteries can operate over a very wide temperature range. As of November 2023, the company has $1.5 billion in signed letters of intent to install their systems.
Energy Vault is proposing, together with California’s Pacific Gas & Electric utility, an all-purpose long duration hybrid storage solution (H-Vault) based on combining lithium-ion batteries with electrolysis and storage of green hydrogen, to be used when needed to produce electricity in hydrogen fuel cells. The hybrid system can then provide energy storage for anywhere from 4 hours to seasonal durations. However, there is still a long way to go in building up the infrastructure at grid sites to store hydrogen safely and exploit it subsequently. For now, Energy Vault is offering H-Vault systems “as a standard solution for 24, 50, and 100 hours, as well as any customizable size.”
The number of worldwide efforts to produce better batteries, while not yet mature, are likely to yield significant benefits for both EVs and grid energy storage in the 2030s and beyond.
VI. summary
In the background behind political dickering and delicate multi-national negotiations over how (or even whether) to address climate change, both industry and research laboratories in many countries are investing heavily in research and development that will allow rapid ramp-up in renewable electricity production over the next few decades. With incremental improvements already far along in solar panel and wind turbine technology, the deployment of both sources is expected to expand rapidly to new areas and new regions. Solar power installations are already being deployed on agricultural land and in floating arrays over bodies of water, and such installations will grow rapidly during the rest of this decade. Offshore wind turbine farms are expanding worldwide, while construction of new taller and larger-rotor turbines will facilitate expansion to new land areas where wind velocities become suitable at somewhat higher altitudes than at existing wind farms.
In parallel, R&D on novel technologies promise substantial improvements in efficiency and reductions in cost beyond 2030 or so. Tandem solar cells combining crystalline silicon with perovskites are already producing significant enhancements in the efficiency of converting sunlight energy to electrical energy, and performance is improving rapidly. Novel designs for floating, counter-rotating, vertical-axis wind turbines, with heavy generator and gearbox equipment near the bottom for easier maintenance, promise to combine efficiency enhancements with expansion of offshore wind farms further from coastlines, where wind velocities are still higher and disruption of coastal views no longer a problem. Research on new thermal heat storage materials offers the potential to raise the temperature, and hence the efficiency of converting thermal to electrical energy, of energy storage from concentrating solar plants.
The intermittency of power production from solar and wind sources requires improvements in energy storage systems. Battery storage up to several hours is benefiting greatly from R&D aimed at improving electric vehicle batteries, in many cases with alternatives such as solid-state batteries to conventional lithium-ion chemistry. Novel battery ideas are being pursued to provide the longer duration storage needed to meet electricity demand all day and all week in spite of production spikes and dips in solar and wind power, and to do so at the greatly reduced costs that will be demanded for grid-scale installations. Energy storage to compensate for seasonal variations in solar and wind power will most likely be addressed not with batteries, but rather with long-term storage of hydrogen, pumped water, or compressed air, any of which can be used later to convert their stored energy back to electricity.
There is reason for great encouragement by these developments. But one should not lose sight of the daunting demands imposed on these advances. If fossil fuels are truly to be phased out for electricity production by 2050, as needed to avoid the most disastrous impacts of climate change, electricity production from solar and wind power installations will have to grow by an order of magnitude worldwide between now and then. Fortunately, industry and the energy research community are serious about meeting this challenge, even while politicians dither.
references:
R.L. Jaffe and W. Taylor, The Physics of Energy (Cambridge University Press, 2018), https://www.amazon.com/Physics-Energy-Robert-L-Jaffe/dp/1107016657
https://debunkingdenial.com/ten-false-narratives-of-climate-change-deniers-part-i/
S. Koonin, Unsettled: What Climate Science Tells Us, What It Doesn’t, and Why It Matters (BenBella Books, 2021), https://www.amazon.com/Unsettled-Climate-Science-Doesnt-Matters/dp/1950665798/
https://debunkingdenial.com/debunked-a-review-of-steven-koonins-book-unsettled/
Renewables Produce 85% of Global Power, Nearly 50% of Energy in 2050, https://renewablesnow.com/news/renewables-produce-85-of-global-power-nearly-50-of-energy-in-2050-582235/
N.M. Haegel, et al., Photovoltaics at Multi-Terawatt Scale: Waiting Is Not an Option, Science 380, 39 (2023), https://www.science.org/doi/10.1126/science.adf6957
https://debunkingdenial.com/the-future-of-nuclear-power-part-iii-modular-nuclear-reactors/
https://debunkingdenial.com/the-future-of-nuclear-power-part-iv-progress-toward-fusion-power/
I. O’Malley, J. McDermott, and A. St. John, The Year in Clean Energy: Wind, Solar, and Batteries Grow Despite Economic Challenges, Associated Press, Dec. 27, 2023, https://apnews.com/article/solar-wind-batteries-clean-energy-fossil-fuels-3bbcbc555b6ff2af27e0ceeb76eb782e
Inflation Reduction Act Guidebook, https://www.whitehouse.gov/cleanenergy/inflation-reduction-act-guidebook/
EIA Projects That Renewable Generation Will Supply 44% of U.S. Electricity by 2050, U.S. Energy Information Administration, March 18, 2022, https://www.eia.gov/todayinenergy/detail.php?id=51698
S. Sattler, The EIA Just Released a 30-Year Energy Outlook. It’s…Not Great, Union of Concerned Scientists, March 16, 2022, https://blog.ucsusa.org/sandra-sattler/eia-energy-outlook-2022/
G. Bhutada, Animated: 70 Years of U.S. Electricity Generation by Source, National Public Utilities Council, March 13, 2023, https://decarbonization.visualcapitalist.com/animated-70-years-of-u-s-electricity-generation-by-source/
Solar Explained: Photovoltaics and Electricity, U.S. Energy Information Administration, https://www.eia.gov/energyexplained/solar/photovoltaics-and-electricity.php
D. Carrington, ‘Revolutionary’ Solar Power Cell Innovations Break Key Energy Threshold, The Guardian, July 6, 2023, https://www.theguardian.com/environment/2023/jul/06/revolutionary-solar-power-cell-innovations-break-key-energy-threshold
Perovskite, American Chemical Society Molecule of the Week, https://www.acs.org/molecule-of-the-week/archive/p/perovskite.html
B. Zientara, Perovskite Solar Cells: Why They’re the Future of Solar Power, Solar Reviews, Sept. 6, 2022, https://www.solarreviews.com/blog/are-perovskite-solar-cells-the-future-of-solar-power
Perovskite Solar Cells, U.S. Department of Energy, https://www.energy.gov/eere/solar/perovskite-solar-cells
Best Research-Cell Efficiency Chart, National Renewable Energy Laboratory, https://www.nrel.gov/pv/cell-efficiency.html
LONGi Announces New Conversion Efficiency of 33.5% for its Silicon-Perovskite Tandem Solar Cells at Intersolar Europe 2023, LONGi, June 14, 2023, https://www.longi.com/en/news/new-conversion-efficiency/
Oxford PV Sets New Solar Cell World Record, Oxford PV, May 24, 2023, https://www.oxfordpv.com/news/oxford-pv-sets-new-solar-cell-world-record
B. Zientara, Exciting New Solar Technologies That Actually Matter (and Why They Matter), Solar Reviews, Oct. 20, 2023, https://www.solarreviews.com/blog/solar-panel-technologies-that-will-revolutionize-energy-production
Solar Futures Study, U.S. Department of Energy, https://www.energy.gov/eere/solar/solar-futures-study
Wikipedia, Agrivoltaics, https://en.wikipedia.org/wiki/Agrivoltaics
Agrivoltaics: Coming Soon to a Farm Near You?, U.S. Department of Agriculture, https://www.climatehubs.usda.gov/hubs/northeast/topic/agrivoltaics-coming-soon-farm-near-you
New Project in Rockport Combines Solar Power and Agriculture, News Center Maine, https://www.youtube.com/watch?v=t6c9_KYnQWY
Agrivoltaics, National Renewable Energy Laboratory, https://www.nrel.gov/solar/market-research-analysis/agrivoltaics.html
Wikipedia, Floating Solar, https://en.wikipedia.org/wiki/Floating_solar
J. Tirone, Floating Solar Panels Turn Old Industrial Sites Into Green Energy Goldmines, Bloomberg News, Aug. 3, 2023, https://www.bloomberg.com/news/articles/2023-08-03/floating-solar-panels-turn-old-industrial-sites-into-green-energy-goldmines
B. Ludt, New Jersey Town Keeps Its Water Clean with the Country’s Largest Floating Solar System, Solar Power World, Jan. 29, 2020, https://www.solarpowerworldonline.com/2020/01/new-jersey-town-keeps-its-water-clean-with-the-countrys-largest-floating-solar-system/
The Future of Concentrated Solar Power Engineering Advances in Renewable Energy, Utilities One, Nov. 7, 2023, https://utilitiesone.com/the-future-of-concentrated-solar-power-engineering-advances-in-renewable-energy
Generation 3 Concentrating Solar Power Systems, National Renewable Energy Laboratory, https://www.nrel.gov/csp/generation-3-concentrating-solar-power-systems.html
Raising Temperatures with Next-Generation Concentrating Solar-Thermal Power, U.S. Department of Energy, https://www.youtube.com/watch?v=QdiaYKY59WM
Concentrating Solar Power Market is Expected to Reach USD 119.52 Billion by 2028, Fortune Business, Dec. 15, 2023, https://www.globenewswire.com/news-release/2023/12/15/2796853/0/en/Concentrating-Solar-Power-Market-is-Expected-to-Reach-USD-119-52-billion-by-2028.html
C. Laurie, Technology Advancements Could Unlock 80% More Wind Energy Potential During This Decade, National Renewable Energy Laboratory, Sept. 22, 2023, https://www.nrel.gov/news/program/2023/technology-advancements-could-unlock-80-more-wind-energy-potential-during-this-decade.html
Levelized Cost of Energy LCOE, Grey Cells Energy, https://www.youtube.com/watch?app=desktop&v=mkNUTemjWHA
Thunder Said Energy, Windy Physics: How is Power of a Wind Turbine Calculated?, https://thundersaidenergy.com/downloads/wind-power-impacts-of-larger-turbines/
Wikipedia, Offshore Wind Power, https://en.wikipedia.org/wiki/Offshore_wind_power
After a Decade of Dithering, the US East Coast Went All In on Offshore Wind Power This Week, Key Energy, May 28, 2018, https://web.archive.org/web/20180929155638/https:/en.keyenergy.it/key-energy/info/news/key-energy-news/after-a-decade-of-dithering-the-us-east-coast-went-all-in-on-offshore-wind-power-this-week.n8604504.html
Global Wind Atlas, https://globalwindatlas.info/en
Offshore Wind Technical Potential/ Analysis and Maps, Energy Sector Management Assistance Program, https://www.esmap.org/esmap_offshorewind_techpotential_analysis_maps
Wikipedia, Alpha Ventus Offshore Wind Farm, https://en.wikipedia.org/wiki/Alpha_Ventus_Offshore_Wind_Farm
Wikipedia, Floating Wind Turbine, https://en.wikipedia.org/wiki/Floating_wind_turbine
Wikipedia, Vertical-Axis Wind Turbine, https://en.wikipedia.org/wiki/Vertical-axis_wind_turbine
B. Raker, New Wind Turbine Design with ‘Surprising Twist’ Could Revolutionize Energy Production: ‘The World Needs Them Yesterday’, Yahoo Finance, Dec. 26, 2023, https://finance.yahoo.com/news/wind-turbine-design-surprising-twist-113000621.html
World Wide Wind, https://worldwidewind.no/pages/company
L. Blain, Contra-Rotating Floating Turbines Promise Unprecedented Scale and Power, New Atlas, Aug. 30, 2022, https://newatlas.com/energy/coaxial-vertical-floating-wind-turbines/
L. Blain, A Deeper Dive Into World Wide Wind’s Colossal, Contra-Rotating Turbines, New Atlas, Sept. 2, 2022, https://newatlas.com/energy/world-wide-wind-interview/
What Are Lithium-Ion Batteries?, UL Research Institutes, Sept. 14, 2021, https://ul.org/research/electrochemical-safety/getting-started-electrochemical-safety/what-are-lithium-ion
The Cost of Green Energy: Lithium Mining’s Impact on Nature and People, Mining Technology, Oct. 30, 2023, https://www.mining-technology.com/analyst-comment/lithium-mining-negative-environmental-impact/?cf-view
S. Murphy Kelly, Lithium-Ion Battery Fires Are Happening More Often. Here’s How to Prevent Them, CNN Business, March 19, 2023, https://www.kcra.com/article/lithium-ion-battery-fires-how-to-prevent-them/43266541
S. Huang, How the Inflation Reduction Act Is a Victory for U.S. EV Battery Manufacturers, Forbes, July 26, 2023, https://www.forbes.com/sites/forbestechcouncil/2023/07/26/how-the-inflation-reduction-act-is-a-victory-for-us-ev-battery-manufacturers/?sh=1f2e42ec7891
Wikipedia, Solid-State Battery, https://en.wikipedia.org/wiki/Solid-state_battery
C.D. Fincher, et al., Controlling Dendrite Propagation in Solid-State Batteries with Engineered Stress, Joule 6, 2794 (2022), https://www.sciencedirect.com/science/article/pii/S2542435122005207
QuantumScape, https://www.quantumscape.com/technology
J. Temple, This Super-Energy-Dense Battery Could Nearly Double the Range of Electric Vehicles, MIT Technology Review, Dec. 8, 2020, https://www.technologyreview.com/2020/12/08/1013357/quantumscape-vw-litihium-metal-battery/
QuantumScape Ships First 24-Layer Prototype Battery Cells to Automotive OEMs, Dec. 20, 2022, https://ir.quantumscape.com/resources/press-releases/news-details/2022/QuantumScape-Ships-First-24-Layer-Prototype-Battery-Cells-to-Automotive-OEMs/default.aspx
E. Dreibelbis, No More EV Battery Replacements? VW’s Solid State Cell Holds Up for 300K Miles, PC Magazine, Jan. 3, 2024, https://www.pcmag.com/news/no-more-ev-battery-replacements-vws-solid-state-cell-holds-up-for-300k
A New Breed of Battery, Solid Power, https://www.solidpowerbattery.com/
C. Crownhart, What’s Next for Batteries, MIT Technology Review, Jan. 4, 2023, https://www.technologyreview.com/2023/01/04/1066141/whats-next-for-batteries/
S. Kothari, Tesla Model 3 Owners Get Candid About LFP Battery Health and Degradation, Inside EVs, Nov. 12, 2023, https://insideevs.com/news/695788/tesla-model-3-lfp-battery-tips-from-owners/
CATL, https://www.catl.com/en/
Batteries, U.S. Department of Energy, https://www.energy.gov/eere/vehicles/batteries
United States Advanced Battery Consortium, https://uscar.org/usabc/
J. Twitchell, K. DeSomber, and D. Bhatnagar, Defining Long Duration Energy Storage, Journal of Energy Storage 60, 105787 (2023), https://www.sciencedirect.com/science/article/pii/S2352152X22017753
Long Duration Storage Shot: An Introduction, U.S. Department of Energy, https://www.energy.gov/sites/default/files/2021-07/Storage%20shot%20fact%20sheet_071321_%20final.pdf
Long Duration Storage Shot Summit, U.S. Department of Energy, https://www.energy.gov/oe/long-duration-storage-shot-summit
National Labs as Storage Technology Boosters: The Facilities and Capabilities Navigator, U.S. Department of Energy, https://www.youtube.com/watch?v=6BheTJ_y1M0&t=757s
Form Energy, https://formenergy.com/
ESS, https://essinc.com/
Battery Technology, Form Energy, https://formenergy.com/technology/battery-technology/
EOS Z3TM: Zinc-Powered Aqueous Liquid Battery Module, https://www.eose.com/technology/
K. Balaraman, The Energy Storage Space is Heating Up. Here Are Some of the Technologies Making a Dent, Utility Dive, Dec. 5, 2023, https://www.utilitydive.com/news/energy-storage-long-duration-hydrogen-iron-air-zinc-gravity/698158/
H-Vault, https://www.energyvault.com/products/h-vault
Wikipedia, Fuel Cell, https://en.wikipedia.org/wiki/Fuel_cell
