
February 16, 2026
IV. electric vehicles
In the transportation sector, the biggest production of greenhouse gases comes from automobiles and trucks that use internal combustion engines. So a major contribution to mitigating GHGs could come through conversion to hybrid or battery electric vehicles. Indeed, in much of the world there has been significant progress in the adoption of hybrid or electric vehicles. Figure IV.1 shows the growth of global plug-in hybrid vehicles (PHEV) and battery electric vehicles (BEV) from 2014 to 2023. The sales of PHEV (in thousands) are shown in blue, while sales of BEV are in green. The solid red line shows the percentage of all vehicles that are electric powered. The fraction rises from 0.4% in 2014 to 15.8% in 2023. Numbers at the bottom of the chart show the percentage growth in electric vehicles from the preceding year. For every year except 2018 – 2019, the annual growth was at least 35%.
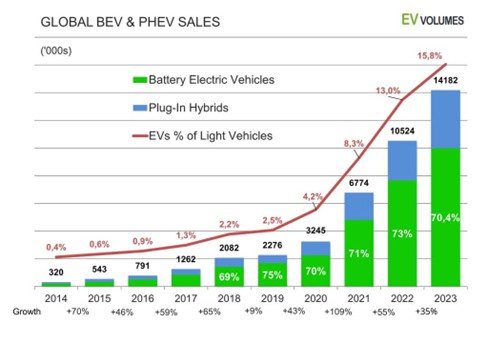
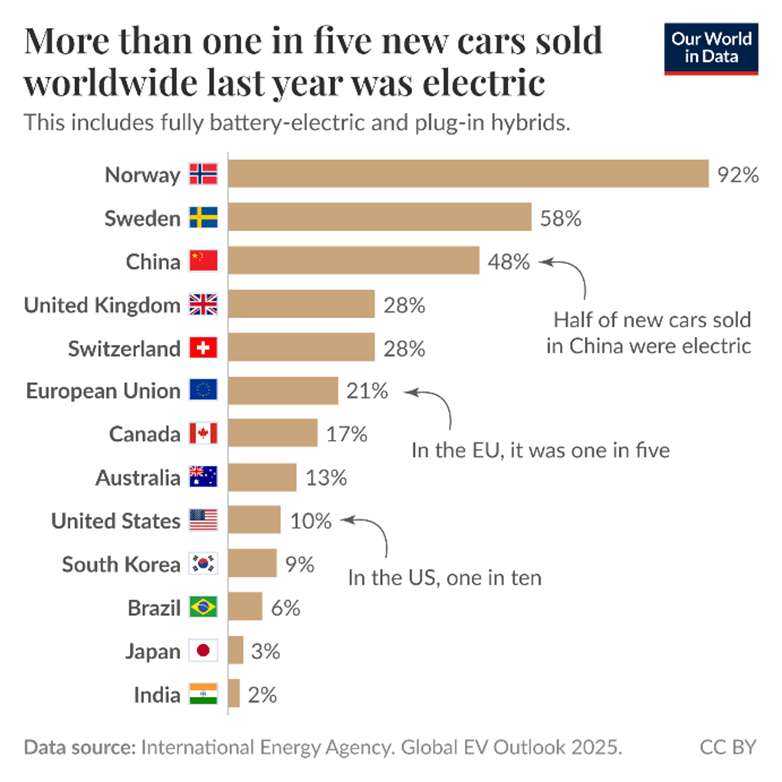
Figure IV.2 shows for 13 countries the fraction of new cars sold in 2024 that were either plug-in hybrid or battery electric vehicles. In that year, over 20% of all new car sales globally were electric. The Scandinavian countries led the way, with 92% of car sales in Norway being electric. Nearly half the cars sold in China were electric, while 21% of cars sold in the European Union were electric. The U.S. lagged behind many developed countries with only 10% of car sales being electric vehicles. And EV production in the US is being scaled back. Because of declining demand, Ford has recently made significant reductions in its electric vehicle production. In India, only 2% of car sales were electric.
Electric Car Batteries:
A significant fraction of the cost of an EV car is the battery. The battery type for electric vehicles is a lithium-ion battery. This is also the battery that powers smartphones. Lithium is the best material for these batteries. First, lithium is one of the lightest elements. It is relatively easy to ionize a lithium atom. Lithium also has a high energy density; as a result of this, a lithium-ion battery can hold a significantly higher electric potential than a conventional battery. Because lithium ions have relatively little mass, the mass of the battery is relatively low. This is an important factor as batteries for an electric vehicle need to combine high power with low mass.
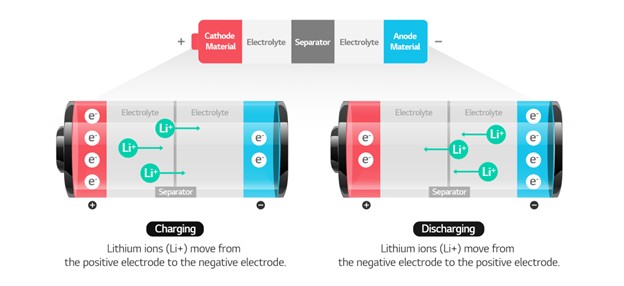
Figure IV.3 shows how a lithium-ion battery functions. The battery contains a negatively charged terminal called an anode, which is generally graphite. It has a positively charged terminal called a cathode, generally made from metals containing lithium oxides. (The nomenclature for the electrodes in a rechargeable battery is reversed from the normal association of a positive electrode with “anode,” because here the positive lithium ions are driven away from the negative terminal when the battery is discharging; hence, the negative electrode is here referred to as the anode.) The terminals are separated by a liquid chemical called an electrolyte, a substance that allows lithium ions to travel between the terminals. In the center of the battery is a separator that allows lithium ions to pass through it, but not electrons. When the battery is charging, positively charged Lithium ions Li+ move from the cathode to the anode. When the battery discharges, the cathode and anode are connected by a conductor. The Lithium ions then move from the anode back to the cathode within the battery. The separator prevents electrons from moving through the electrolyte, so the electrons move through the conductor, where the resulting electric current provides power. When all of the Lithium ions have left the anode, the battery is fully discharged.
The YouTube video below describes how lithium-ion batteries work, and it shows how they are used to power electric vehicles.
https://www.youtube.com/watch?v=VES1NLQpN-w&t=132s
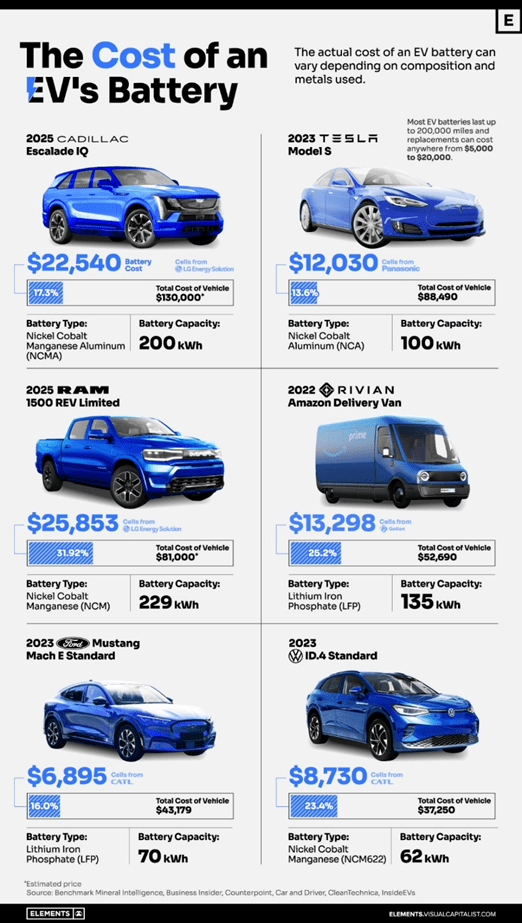
Figure IV.4 shows the type of battery, the cost of that battery, the energy capacity of the battery in kilowatt-hours (kWh), and the fraction of the total vehicle cost represented by the battery, for six different models of cars and trucks. The six vehicles are a 2025 Cadillac Escalade IQ (nickel cobalt manganese aluminum battery with 200 kWh capacity, costing 17.3% of the vehicle’s $130,000 pricetag); a 2023 Tesla Model S (nickel cobalt aluminum battery with 100 kWh capacity, costing 13.6% of the car’s $88,490 pricetag); a 2023 RAM 1500 REV Limited (nickel cobalt manganese battery with 229 kWh capacity, costing 31.92% of the truck’s $81,000 price); a 2022 Rivian Amazon delivery van (lithium iron phosphate battery with capacity 135 kWh, costing 25.2% of the van’s $52,690 price); a 2023 Mustang Standard (lithium iron phosphate battery with capacity 70 kWh, costing 16% of the car’s $43,179 price); and a VW ID.4 Standard (nickel cobalt manganese battery with capacity 62 kWh, costing 23.4% of the car’s $37,250 price).
At present, the cost of electric vehicles is slightly higher than for a vehicle with a conventional internal-combustion engine. There has been a great focus in increasing the capacity of the batteries, since this determines how far one can travel without needing battery recharging, and also in decreasing the price so that electric vehicles can compete with conventional vehicles. As a result of the research in EV batteries, their prices have decreased very rapidly. Figure IV.5 shows the average price of EV batteries, in dollars per kWh capacity, from 2010 to 2023. The red line is the battery price where EVs would reach parity in price with cars with internal combustion engines. By 2023, battery prices had nearly reached parity.
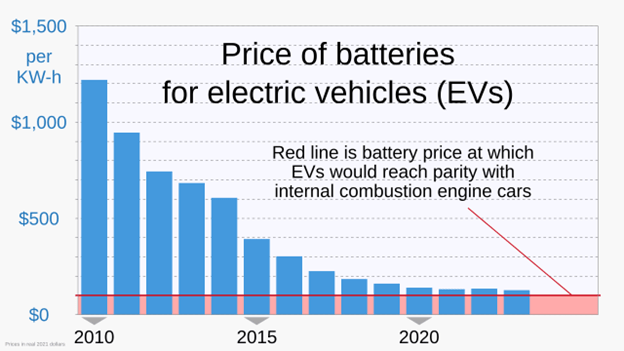
As lithium-ion batteries are rechargeable, EV batteries will generally last up to 200,000 miles or 12 – 15 years before replacement is necessary. If current improvements in battery technology continue, electric vehicles should become more cost-effective than vehicles with internal combustion engines.
The Range of Electric Vehicles:
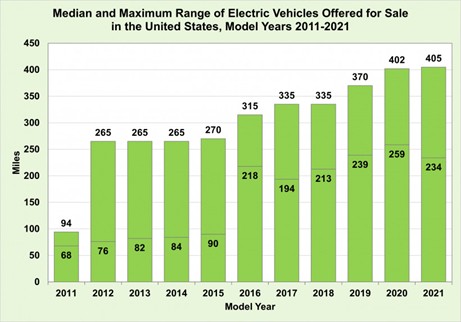
The range of an EV is the distance you can go (at least, theoretically) before you need to re-charge your battery. Figure IV.6 shows the increase in range of electric vehicles over time, from 2011 to 2021, for vehicles for sale in the U.S. Shown is the median range and the maximum range of EVs. There was a 3-fold increase in median range over this decade. The same is true if you took 2014 – 2024; here the median range increased from 84 miles to 283 miles. The increased range was due primarily to improved energy density and efficiency in batteries. During this period, the range of EVs has increased at a rate of about 10% per year. Note that 2017 showed a decrease in median range of EVs in the U.S. This was a result of heavier electric vehicles such as SUVs and trucks being offered for sale. At present, the best range for a commercially produced car has been achieved by the luxury Lucid Air Dream R. It achieved nearly 600 miles range and could be purchased in Europe but apparently is no longer available.
There are a number of factors that determine the range of an EV under real-world driving conditions. These include:
- Driving Conditions: The efficiency of an EV is reduced when the vehicle is operated at high speeds, over large changes in elevation, or during very hot or very cold temperatures. A number of EVs are now incorporating heat pumps which improve efficiency in very cold conditions.
- Vehicle Loads: Ranges are quite sensitive to the aerodynamic qualities of the vehicle. Carrying heavy loads or using add-ons like roof racks can decrease the range of the EV.
- Operating Conditions: The range is affected negatively by frequent acceleration, failure to use regenerative braking, or excessive use of climate control.
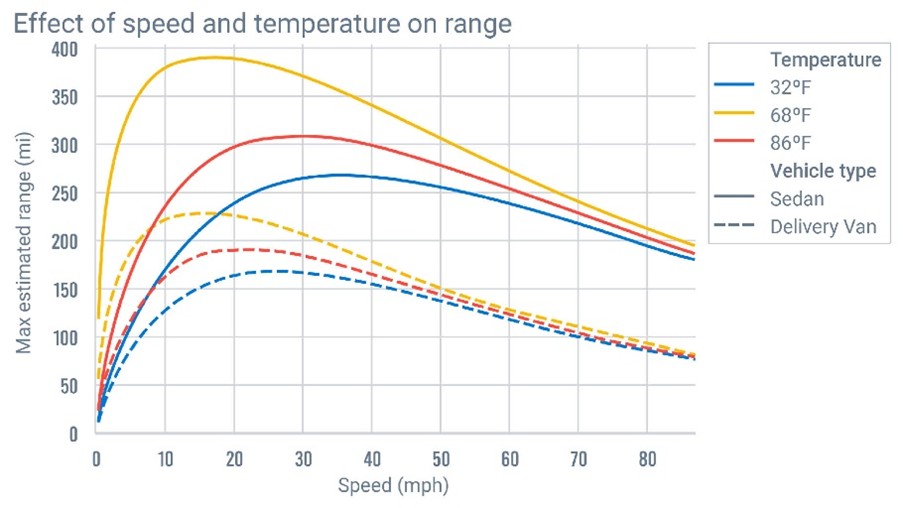
Figure IV.7 shows the effects of speed and temperature on the range of an electric vehicle. The solid curves are for sedans and the dashed curves for an electric delivery van, and are based on data for real-world conditions. The blue, yellow and red curves show the range vs. speed at 320F, 680F and 860F, respectively. At low speeds, the effects of temperature are greatest; it appears that use of air conditioning is important. Comparing these curves, it is obvious that, except at low speeds, vehicle speed generally has a more important effect on vehicle range than temperature. Note that at speeds greater than 60 miles/hr, temperature has almost no effect on the range of the delivery van. At high speeds, the aerodynamics of the van determine its range.
With improvements in battery efficiency and weight, we can expect the range of electric vehicles to increase with time. It is not clear whether we will continue to experience increases in range at the current level of 10% improvement per year.
Since electric vehicles are still more expensive than those with internal combustion engines, many countries provide financial incentives for their citizens to purchase EVs. One way is to provide direct rebates to reduce the purchase price. For example, Greece provides rebates of up to €9,000 to purchase an electric vehicle. Another incentive for EV purchases can be tax reductions, for example lower sales taxes or registration fees. Other ways to encourage EV sales are through free parking, waiver of road tolls, or access to bus lanes.
In most developed countries financial incentives are used to persuade consumers to purchase EVs. And in the U.S., the Biden administration provided a number of incentives through the Inflation Reduction Act of 2022. This extended a $7,500 tax credit for purchasing a new electric vehicle, which could be enabled at the point of sale. There was also a big investment in installing fast charging stations, and a tax credit for installing home charging stations. However, in the U.S. under Trump 2.0 the situation has been completely reversed. The $7,500 EV purchase credit expired on Sept. 30, 2025, and the credit for installing home charging equipment will end on June 30, 2026.
The Trump administration, through Executive Orders and the One Big Beautiful Bill act, rolled back emission standards and removed penalties for non-compliance with federal fuel economy standards. Any U.S. programs designed to encourage growth of EVs, to lower the costs of EVs and to encourage sales of EVs, have been ended or rolled back. On Feb. 12, 2026 Trump and EPA administrator Lee Zeldin announced that they were rescinding the 2009 “Endangerment Finding,” declaring that environmental regulations based on mitigating climate change were unnecessary and too costly. This statement will surely be challenged in court, but if upheld it would constitute a devastating setback to any environmental regulations in the U.S.
A severe blow against electric vehicles has been Trump’s tariffs. They have increased costs on battery packs, charger hardware and and other critical components of EVs. Trump implemented 25% tariffs on imported autos and auto parts. This led to increased costs for auto parts such as tires, engines and windshields and other auto parts such as engines, transmissions and powertrains. The net result is that new car prices are expected to surge. Figure IV.8 shows estimates of the increase in new car prices due to the Trump tariffs, which range from $6,200 for a small car to $12,000 for an EV crossover.
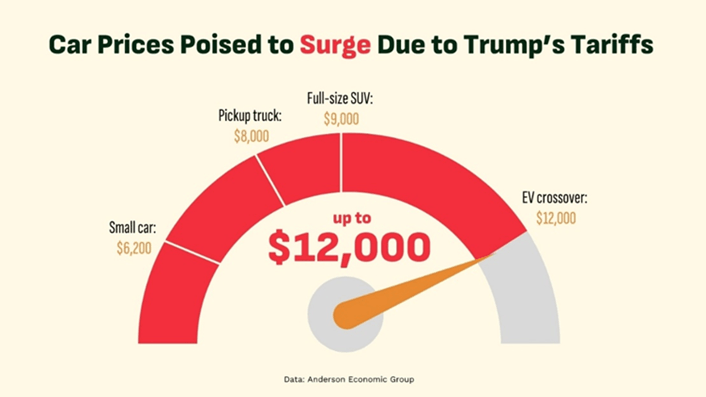
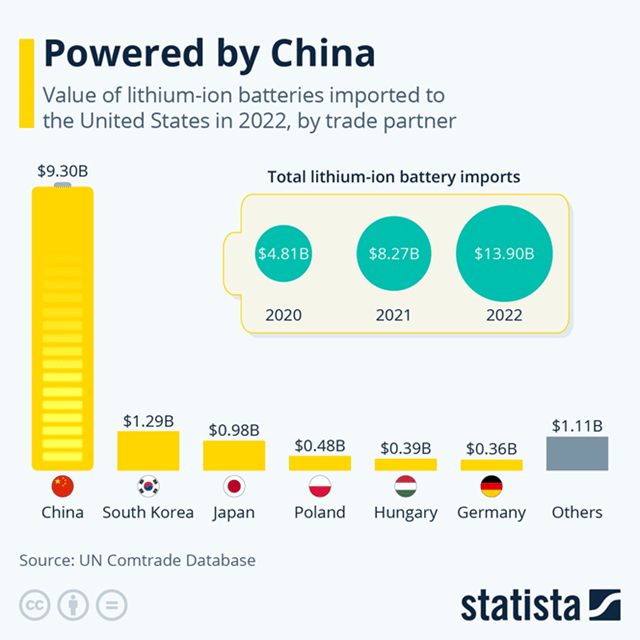
From Fig. IV.8 we see that all automobiles will increase in price because of the Trump tariffs. But electric vehicles will likely see the greatest price increase. About 75% of all lithium-ion batteries are made in China vs. 12% in the U.S. But even domestic lithium-ion battery production still relies heavily on imports for raw materials. Figure IV.9 shows the value of lithium-ion batteries imported by the U.S. in 2022. China accounted for nearly 70% of the batteries imported by the U.S. that year. The figure also shows the total value of imported lithium-ion batteries; from 2020 to 2022, the value of those imported batteries increased three-fold.
Much of the rest of the world is moving towards adoption of electric vehicles. By far the largest investments are coming in China. From 2009 to 2023, China invested over $230 billion in its domestic electric vehicle industry. At present, over 50% of new car sales in China are for new electric vehicles (NEVs). Recently China began exporting its electric vehicles. Figure IV.10 shows the growth in the value of China’s electric vehicle exports from 2019, when the export value was $0.44B, to 2023 when the value was $34.13B. As a result, the Chinese EV industry achieved a dominant position in both domestic and world markets. China’s EV exports achieved success in markets in Southeast Asia, the Middle East, Russia and Latin America, particularly in Brazil.
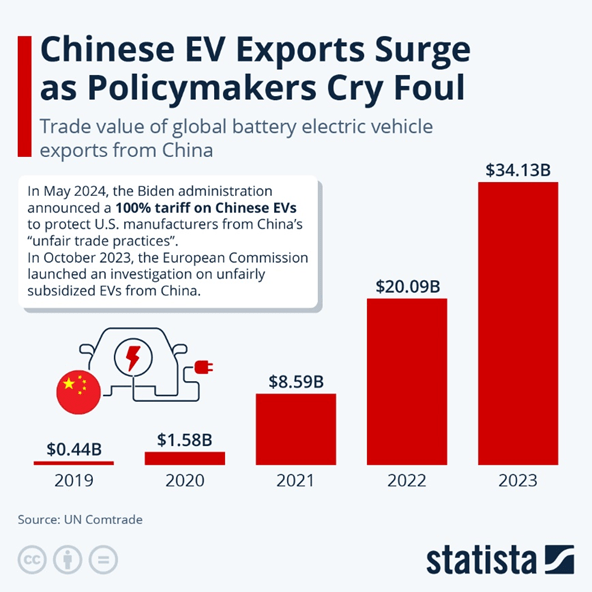
However, both the U.S. and the EU held that the prices of Chinese electric vehicles were unfairly low because of the heavy government subsidies to the Chinese EV industry. In June 2024 the Biden administration imposed 100% tariffs on Chinese EV imports; and in Oct. 2024 the EU imposed additional duties on Chinese BEV imports. The EU duties ranged from 8% to 35%, on top of regular 10% duties on imported cars. As a result, in 2025 for the first time China spent more on overseas investments for EVs and EV batteries ($16 billion) than on domestic investment ($15 billion). Reasons for this shift were that their domestic market was saturated, and that investment in foreign factories was a response to trade tariffs imposed on Chinese EV exports. In Jan. 2026 Canada reached an agreement where it would lower tariffs on Chinese EVs in return for China lowering its tariffs on Canadian farm goods. This marks one of the first examples of Canada’s reaching out to other countries as a means of decreasing its dependence on the U.S., as a result of Donald Trump’s unpredictable actions on tariffs, his willingness to breach long-established formal agreements between the U.S. and Canada, plus his bizarre focus on making Canada the “51st state” of the U.S.
At present, China is cementing its position as the global leader in electric vehicles and batteries, in installation of solar panels on a massive scale, and in production and installation of wind turbines. The U.S. under Trump 2.0 has turned its back on solar and wind power, while it slashes environmental regulations, opens up land for oil drilling, and perversely keeps open “beautiful clean coal” plants that are expensive to operate and produce harmful emissions. It is hard to imagine more destructive and short-sighted policies regarding energy production and environmental protection.
V. other improvements
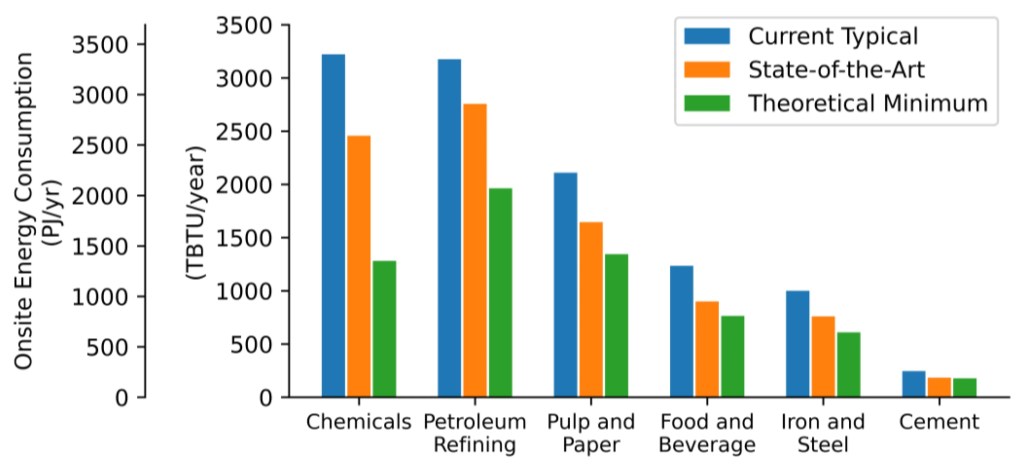
After energy production and transportation, the economic sector that emits the next most greenhouse gases internationally is manufacturing and construction. The emissions can certainly be reduced when industries switch to carbon-free energy sources. But in addition, the technology exists to reduce energy consumption in manufacturing by substantial factors. Various manufacturing sectors differ from one another in the gains possible. The U.S. Department of Energy’s Advanced Manufacturing Office carried out an exhaustive series of analyses of consumption gains that could be made in U.S. manufacturing sectors in 2015. A summary of results from those studies is given in Fig. V.1. The most optimistic assessments of consumption gains to be made with technology then under R&D amount to a 50% reduction in American manufacturing energy usage.
Among the recommended improvements are: the use of automation and robotics; adapting new, more efficient technologies in the manufacturing process; computer-aided monitoring of the manufacturing process to reduce wasteful usage of energy and materials; the introduction of next-generation raw materials from advanced materials science and engineering; recovery of waste heat to recycle energy; and conservation efforts to reduce energy use for facility heating, lighting, and onsite transportation. The DOE reports (see references here) list a large number of specific advances relevant to each manufacturing sector, with realistic estimates of the gains in efficiency achievable.
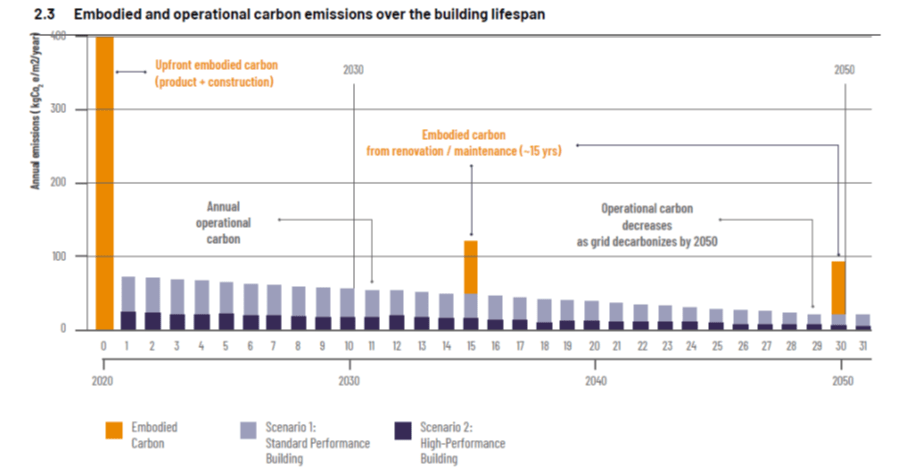
Construction and buildings represent another major contributor to global greenhouse gas emissions. The carbon emissions from a building throughout its life cycle are the sum of emissions embodied in the construction materials and practices, on the one hand, and the emissions that result from energy consumption associated with operations within the building, on the other hand. The embodied emissions currently account typically for about a quarter of life-cycle emissions from buildings worldwide, but by mid-century that portion is anticipated to grow, as indicated in Fig. V.2, to about half, as conservation approaches reduce energy demand within buildings and renewables account for a larger fraction of energy available from electrical grids.
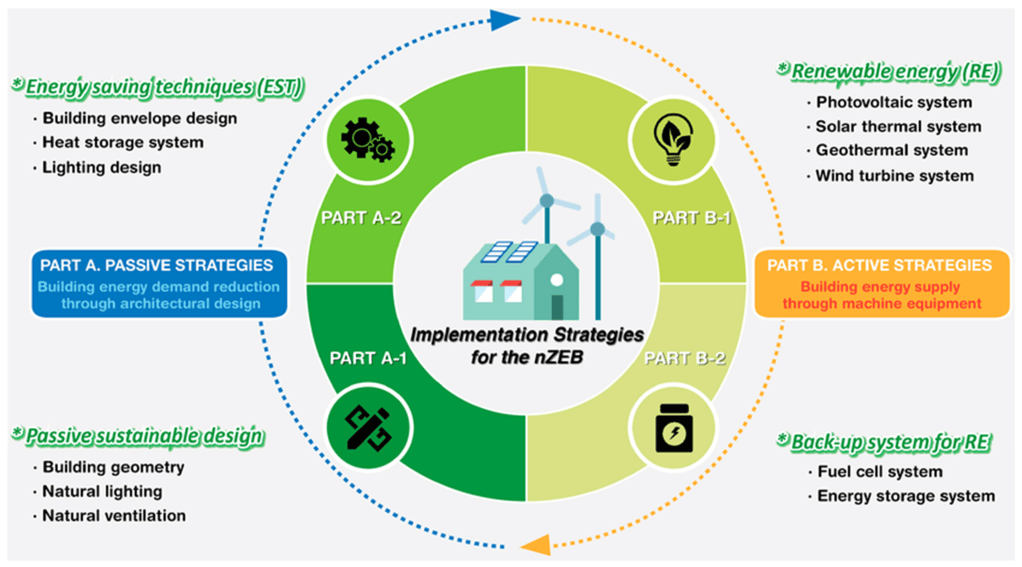
There is a great deal of development in progress on the design of energy-efficient buildings whose operational carbon emissions are reduced (see Fig. V.3) by both their architectural design and the inclusion of energy generation, for example, by solar panels. Favorable design features can include energy-efficient lighting and heating, access to natural lighting and ventilation, but also the inclusion of vegetation. For example, vegetation on roofs can reduce temperatures and urban heat island effects markedly, as illustrated by infrared photos in Fig. V.4.

Efforts to substantially reduce the embodied carbon emissions in current construction practices have received less attention to date. A 2023 United Nations report presents the most important changes to reduce greenhouse gas emissions in building construction. The most important opportunities to reduce emissions are summarized in Fig. V.5.
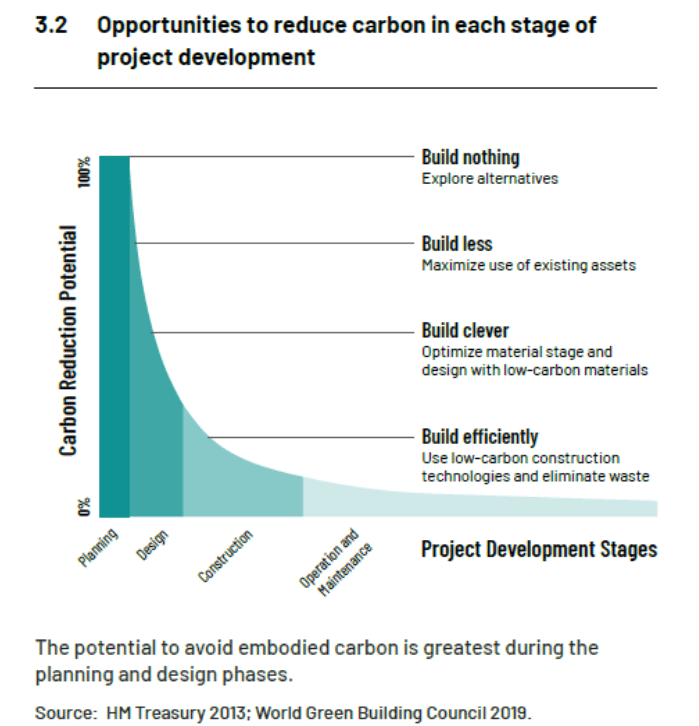
The first embodied emissions reduction noted in Fig. V.5 concerns using existing assets, including both existing buildings and components and natural structures. This suggestion is coupled to the importance of building circularity or recycling into construction design, so that by the time a building has exhausted its lifetime usage, elements of the building are retrieved for use in future projects, rather than being destroyed, as is the present norm. The difference is illustrated in Fig. V.6. The second reduction strategy in Fig V.5 concerns designing with low-carbon building materials. The greenhouse gas emissions associated with processing of the building materials most often used today are indicated in Fig. V.7, along with projections of the increases in emissions by 2060 if construction projects to supply growing populations and growing economies proceed along a business-as-usual trajectory.

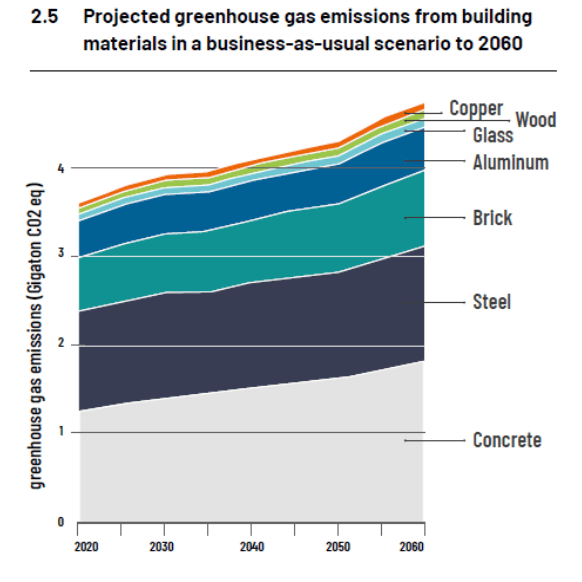
The alternative to the business-as-usual projected emissions growth in Fig. V.7 relies on reducing the carbon content of concrete and steel and/or replacing them, where possible, with bio-based materials: “The shift towards properly managed bio-based materials could lead to compounded emission savings in the sector of up to 40 per cent by 2060 in many regions, even when compared to savings from low-carbon concrete and steel.” The preferred bio-based materials include: timber and wood sourced from sustainable forestry; engineered bamboo assembled with non-toxic binders and glues; and “non-timber lignocellulosic materials generated from forestry, agriculture and biomass residues.” The latter biomass residues currently go primarily to waste but can be recuperated with sufficient investment. Using these bio-based materials requires overcoming a cultural attitude that currently favors concrete, steel, and glass as the materials of “modern” buildings.
The final strategy suggested by Fig. V.5 is to build efficiently. A suitable design taking the full life-cycle of a building into account can eliminate wasteful material usage. The use of renewable energy sources to power the construction, modular and prefabricated construction to minimize waste, and innovative construction techniques such as 3D printing of some elements can all contribute to construction efficiency. Careful quality assurance, together with continuous monitoring of energy and material usage, can minimize waste.
There are many ways that each individual can contribute to climate change mitigation, through conservation efforts, minimizing personal use of fossil fuels for electricity, heating, and transportation, healthy eating habits, planting trees, riding bikes, etc. But it is gains in the economic sectors we’ve considered here – electricity production, transportation, manufacturing, and construction – that can reduce human emissions of greenhouse gases most effectively.
VI. summary
We hope we have convinced you of the following points:
• Mitigating the most severe impacts of climate change is possible with existing and shortly expected technology. But it requires the political will to transform economies from fossil fuels to carbon-free technology.
• Renewable energy efficiency and costs are improving. These can provide for the majority of electrical power needs by mid-century. Rapidly improving battery storage and nuclear power (e.g., small modular reactors) can fill in source fluctuations. More speculative developments, such as thermonuclear fusion power reactors or space-based solar power stations, may make major contributions to worldwide energy needs in the second half of the 21st century.
• Electric vehicle costs and ranges are improving. They can provide the majority of global vehicle needs by mid-century if countries offer modest subsidies. They reduce both greenhouse gas and other noxious vehicle emissions. The U.S. is trailing well behind many other developed countries in adopting EVs and Trump tariffs will escalate their costs disproportionately.
• Technology exists to improve energy efficiency and limit carbon emissions of manufacturing and construction projects. Alternative materials to those used commonly today are a critical contributor to reducing carbon emissions from both of these sectors.
Many politicians, especially in the U.S., oppose these mitigation strategies because they claim that adaptation to a changed climate will cost less than the economic restructuring (away from fossil fuels) that mitigation implies. We have shown in our previous post on Climate Tipping Points that Earth’s climate is highly nonlinear; it can continue to change in dramatic and unexpected ways over centuries, even after humans reduce their greenhouse gas emissions, if they do so too late. The nonlinearity makes estimation of adaptation costs a fool’s errand. We believe that in the long run mitigation will prove far more cost-effective.
Furthermore, the necessary economic restructuring is under way, just not in the U.S. under the Trump administration. Trump has stated publicly several times that he views climate change as a hoax perpetrated by China to place American manufacturing at a disadvantage. For a purported perpetrator of a hoax, China appears to be taking climate change mitigation extremely seriously. The rate at which they are covering land and sea with photovoltaic panels and wind turbines is extraordinary and it dwarfs efforts by all other countries. They are also adding nuclear power faster than any other country. China is also leading the world in exporting EV batteries and battery materials. China is providing a global template for how to use technology to transform the energy economy with a sense of urgency. While Trump promotes increasing coal-powered plants and tries to take over Venezuela’s oil fields to claim dominance over 20th-century energy production, China is moving rapidly ahead toward dominating 21st-century energy production in space. Trump is making China great again!
references:
R. Rohde, Global Temperature Report for 2025, Berkeley Earth, Jan. 14, 2026, https://berkeleyearth.org/global-temperature-report-for-2025/
Intergovernmental Panel on Climate Change, https://www.ipcc.ch/2025/
DebunkingDenial, Ten False Narratives of Climate Change Deniers, https://debunkingdenial.com/portfolio/ten-false-narratives-of-climate-change-deniers/
DebunkingDenial, Will Happer, Climate Change Denier, https://debunkingdenial.com/will-happer-climate-change-denier/
DebunkingDenial, S. Fred Singer, All-Purpose Science Denier, https://debunkingdenial.com/s-fred-singer-all-purpose-science-denier/
DebunkingDenial, John Christy, Climate Change Denier, https://debunkingdenial.com/john-christy-climate-change-denier-part-i/
DebunkingDenial, Debunked? A Review of Steve Koonin’s Book ‘Unsettled?’, https://debunkingdenial.com/debunked-a-review-of-steven-koonins-book-unsettled/
Heartland Institute, https://heartland.org/
DebunkingDenial, The Heartland Institute Strikes Again, https://debunkingdenial.com/the-heartland-institute-strikes-again-part-i/
DebunkingDenial, The Science Denier’s Toolbox, https://debunkingdenial.com/the-science-deniers-toolbox/
Wikipedia, Regulation of Greenhouse Gases Under the Clean Air Act, https://en.wikipedia.org/wiki/Regulation_of_greenhouse_gases_under_the_Clean_Air_Act
DebunkingDenial, Climate Tipping Points: Coming Soon to a Planet Near You?, https://debunkingdenial.com/climate-tipping-points-coming-soon-to-a-planet-near-you/
H. Chatur, Why 100% Renewables Isn’t Feasible by 2050, Utility Dive, Aug. 15, 2019, https://www.utilitydive.com/news/why-100-renewables-isnt-feasible-by-2050/560918/
W.D. Budinger, Why Renewables Cannot Replace Fossil Fuels, Democracy, Feb. 16, 2024, https://democracyjournal.org/arguments/why-renewables-cannot-replace-fossil-fuels/
C. van Kooten, ‘Renewable’ Energy Can’t Replace Fossil Fuels, Fraser Institute, Dec. 13, 2021, https://www.fraserinstitute.org/commentary/renewable-energy-cant-replace-fossil-fuels
A. Betts, Trump Named ‘Undisputed Champion of Beautiful Clean Coal’ by Industry Group, The Guardian, Feb. 12, 2026, https://www.theguardian.com/us-news/2026/feb/12/trump-clean-coal-award
City of Richmond, Greenhouse Gas Emissions Inventory, https://www.rvagreen2050.com/ghg-inventory
IPCC, Emissions Trends and Drivers, 6th Assessment Report, Working Group III, Chapter 2, https://www.ipcc.ch/report/ar6/wg3/downloads/report/IPCC_AR6_WGIII_Chapter02.pdf
Center for Climate and Energy Solutions, Main Greenhouse Gases, https://www.c2es.org/content/main-greenhouse-gases/
2024 Worldwide Greenhouse Gas (GHG) Emissions, https://aqalgroup.com/wp-content/uploads/2025/09/2024-Worldwide-GHG-Emissions-per-capita-by-region-growth.pdf
Our World in Data, Per Capita Greenhouse Gas Emissions Including Land Use, https://ourworldindata.org/grapher/per-capita-ghg-emissions
List of Top 20 Products Imported from China to the USA, Gaia Dynamics, Jan. 5, 2026, https://www.gaiadynamics.ai/blog/top-20-products-imported-from-china-to-the-usa
Our World in Data, CO2 and Greenhouse Gas Emissions, https://ourworldindata.org/co2-and-greenhouse-gas-emissions#explore-data-on-co2-and-greenhouse-gas-emissions
A. Ali, Visualizing U.S. Greenhouse Gas Emissions by Sector, Visual Capitalist, Aug. 9, 2022, https://www.visualcapitalist.com/sp/visualizing-u-s-greenhouse-gas-emissions-by-sector/
Ember Energy, World Passes 30% Renewable Electricity Milestone, May 7, 2024, https://ember-energy.org/latest-updates/world-passes-30-renewable-electricity-milestone/
83% of Global Electricity Will Be Generated by RES in 2050 – Highlights from DNV GL’s Global Energy Transition Report, Oct. 19, 2022, https://uabio.org/en/materials/13819/
Visual Capitalist, Chart: The Plummeting Cost of Renewable Energy, https://licensing.visualcapitalist.com/product/chart-the-plummeting-cost-of-renewable-energy/
Wikipedia, Concentrated Solar Power, https://en.wikipedia.org/wiki/Concentrated_solar_power
K. Buchholz, Where Renewable Energy is Growing (and Where It is Stalling), Statista, June 24, 2025, https://www.statista.com/chart/31091/renewable-energy-capacity-by-region/
M. Don, How Many Nuclear Power Plants is China Currently Building?, Og Garden, June 30, 2025, https://oggardenonline.com/how-many-nuclear-power-plants-does-china-currently.html
U.S. Energy Information Administration, China Expected to Account for More Than Half of World Growth in Nuclear Power Through 2040, Sept. 28, 2016, https://www.eia.gov/todayinenergy/detail.php?id=28132
Wikipedia, Fukushima Nuclear Accident, https://en.wikipedia.org/wiki/Fukushima_nuclear_accident
B. Han and C.K.W. Chia, China’s Record Coal Capacity Approvals in 2022: Will Carbon Targets Still Be Met?, S&P Global, Apr. 27, 2023, https://www.spglobal.com/energy/en/research-analytics/chinas-record-coal-capacity-approvals-in-2022-carbon-targets
Millions of Solar Panels: How China is Covering Mountains and Seas with Solar Energy, https://www.youtube.com/shorts/rri5KZlA_q8
Insight Hub, The Unbelievable Engineering Behind China’s Mountain Solar Farms!, https://www.youtube.com/watch?v=kVPIZFG2i8g
Y. Zhu, S. Deng, and K. Selvaraju, China’s Wind and Solar Energy Additions Eclipse Coal in Historic First, Rystad Energy, Aug. 1, 2024, https://www.rystadenergy.com/news/china-wind-solar-coal
DebunkingDenial, What’s New with Renewables?, https://debunkingdenial.com/whats-new-with-renewables/
Wikipedia, Reason (short story), https://en.wikipedia.org/wiki/Reason_(short_story)
P.E. Glaser, Power from the Sun: Its Future, Science 162, 857 (1968), https://www.science.org/doi/10.1126/science.162.3856.857
Wikipedia, Space-Based Solar Power, https://en.wikipedia.org/wiki/Space-based_solar_power
China’s Space Project That Could Change Everything, https://www.youtube.com/watch?v=bI43F2tT99c
Wikipedia, Geosynchronous Orbit, https://en.wikipedia.org/wiki/Geosynchronous_orbit
Wikiwand, Medium Earth Orbit, https://www.wikiwand.com/en/articles/Medium_Earth_orbit
A. Jones, Record Launches, Reusable Rockets and a Rescue: China Made Big Strides in Space in 2025, Space.com, Dec. 24, 2025, https://www.space.com/space-exploration/launches-spacecraft/record-launches-reusable-rockets-and-a-rescue-china-made-big-strides-in-space-in-2025
Wikipedia, Tiangong Space Station, https://en.wikipedia.org/wiki/Tiangong_space_station
J. Le, China Tests “Death Star”-Like Microwave Weapon that Can Jam Satellites with Laser-Precision, Relationaire, May 13, 2025, https://relationaire.com/china-tests-death-star-like-microwave-weapon-that-can-jam-satellites-with-laser-precision/
D. Surender, T. Khan, F.A. Talukdar, and Y.M.M. Antar, Rectenna Design and Development Strategies for Wireless Applications: A Review, IEEE Antennas and Propagation Magazine 64, 16 (2022), https://ieeexplore.ieee.org/document/9512378
U.S. Naval Research Laboratory, Naval Research Laboratory Conducts First Test of Solar Power Satellite Hardware in Orbit, May 18, 2020, https://web.archive.org/web/20200519022252/https:/www.navy.mil/submit/display.asp?story_id=112989
Air Force Research Laboratory, Space Power Beaming, https://web.archive.org/web/20210428183529/https:/afresearchlab.com/technology/successstories/space-power-beaming/
CalTech, In a First, Caltech’s Space Solar Power Demonstrator Wirelessly Transmits Power in Space, June 1, 2023, https://www.caltech.edu/about/news/in-a-first-caltechs-space-solar-power-demonstrator-wirelessly-transmits-power-in-space
U.K. Space Energy Initiative, https://spaceenergyinitiative.org.uk/
Wikipedia, Solaris (solar power), https://en.wikipedia.org/wiki/Solaris_(solar_power)
JAXA Research and Development Directorate, About the SSPS, https://www.kenkai.jaxa.jp/eng/research/ssps/ssps-ssps.html
Shimizu Corporation, LUNA RING, Solar Power Generation on the Moon, https://www.shimz.co.jp/en/topics/dream/content02/
Global BEV and PHEV Sales, https://ev-volumes.com/wp-content/uploads/sites/19/2024/02/WW-K-12-2023.jpg
H. Ritchie, What Share of New Cars in Your Country are Electric?, Our World in Data, Aug. 4, 2025, https://ourworldindata.org/data-insights/what-share-of-new-cars-in-your-country-are-electric
N.E. Boudette, Ford Says Electric Vehicle Losses Will Continue for 3 More Years, New York Times, Feb. 10, 2026, https://www.nytimes.com/2026/02/10/business/ford-earnings-electric-vehicles.html
How Lithium-Ion Batteries Power EVs: Ion Flow and Charging Explained in 5 Steps [2025 Update], https://www.youtube.com/watch?v=VES1NLQpN-w&t=132s
B. Venditti, Visualized: What is the Cost of Electric Vehicle Batteries?, Visual Capitalist, Oct. 14, 2023, https://elements.visualcapitalist.com/cost-of-electric-vehicle-batteries/
Wikipedia, Electric Vehicle Battery, https://en.wikipedia.org/wiki/Electric_vehicle_battery
H. Ritchie, The End of Range Anxiety: How Has the Range of Electric Cars Changed Over Time?, Feb. 27, 2023, https://hannahritchie.substack.com/p/electric-car-range
Lucid Air Dream R, https://ev-database.org/car/1696/Lucid-Air-Dream-Edition-R
What Factors Affect the Range of an Electric Car?, https://www.soolutions.com/en/blog/what-factors-affect-the-range-of-an-electric-car/
The EV Report, Speed Outweighs Heat in EV Range Loss, July 2, 2025, https://theevreport.com/speed-outweighs-heat-in-ev-range-loss
S. Fleming, These Countries Offer the Best Electric Car Incentives to Boost Sales, World Economic Forum, June 29, 2021, https://www.weforum.org/stories/2021/06/electric-vehicles-financial-incentives/
Electrification Coalition,Inflation Reduction Act and EVs, https://electrificationcoalition.org/work/federal-ev-policy/inflation-reduction-act/
C. Domonoske, Trump Administration Rolls Back Fuel Economy Standards, NPR, Dec. 3, 2025, https://www.npr.org/2025/12/03/nx-s1-5630389/trump-administration-rolls-back-fuel-economy-standards
M. McGrath, Trump Revokes Landmark Ruling That Greenhouse Gases Endanger Public Health, BBC, Feb. 12, 2026, https://www.bbc.com/news/articles/cn0zdd7yl4vo
M.C. Anderson, Trump’s First Year Back: 2025 Actions Slowed US EV Momentum as China Accelerates, Battery Technology, Jan. 20, 2026, https://www.batterytechonline.com/automotive-mobility/11-trump-ev-policies-that-hurt-us-automaker-competitiveness
K. Breuninger, Trump’s New Auto Tariffs Will Likely Drive Up Car Prices by Thousands of Dollars, CNBC, Mar. 27, 2025, https://www.cnbc.com/2025/03/27/trump-auto-tariffs-car-prices-analysts.html
M. Winters, How Much Tariffs Could Drive Up Car Prices – and How to Tell if You Should Buy Now, CNBC, Mar. 24, 2025, https://www.cnbc.com/2025/03/24/how-much-tariffs-could-drive-up-car-prices.html
F. Richter, Powered by China, Statista, Mar. 10, 2023, https://www.statista.com/chart/29473/value-of-lithium-ion-battery-imports-to-the-united-states/
F. Richter, Charted: Where Does the US Lithium Battery Supply Come From?, World Economic Forum, Mar. 15, 2023, https://www.weforum.org/stories/2023/03/charted-where-does-the-us-lithium-battery-supply-come-from/
F. Richter, Chinese EV Exports Surge as Policymakers Cry Foul, Statista, May 15, 2024, https://www.statista.com/chart/32253/chinese-exports-of-electric-vehicles/
C. Domonoske, 5 Takeaways from Biden’s Tariff Hikes on Chinese Electric Vehicles, NPR, May 14, 2024, https://www.npr.org/2024/05/14/1251096758/biden-china-tariffs-ev-electric-vehicles-5-things
European Commission, EU Commission Imposes Countervailing Duties on Imports of Battery Electric Vehicles (BEVs) from China, Dec. 12, 2024, https://trade.ec.europa.eu/access-to-markets/en/news/eu-commission-imposes-countervailing-duties-imports-battery-electric-vehicles-bevs-china
K. Lo, The Great Chinese EV Exodus, Rest of World, Feb. 9, 2026, https://restofworld.org/2026/china-ev-exports-competition-price/
Associated Press, Canada Agrees to Cut Tariff on Chinese EVs in Return for Lower Tariffs on Canadian Farm Products, NPR, Jan. 16, 2026, https://www.npr.org/2026/01/16/nx-s1-5679469/canada-cut-tariff-chinese-evs-canadian-farm-products
S. Sundaramoorthy, et al., Energy Efficiency as a Foundational Technology Pillar for Industrial Decarbonization, Sustainability 15, 9487 (2023), https://www.mdpi.com/2071-1050/15/12/9487#sustainability-15-09487-f006
United Nations Environment Programme, Building Materials and the Climate: Constructing a New Future, Sept. 12, 2023, https://www.unep.org/resources/report/building-materials-and-climate-constructing-new-future
J. Oh, et al., Advanced Strategies for Net-Zero Energy Building: Focused on the Early Phase and Usage Phase of a Building’s Life Cycle, Sustainability 9, 2272 (2017), https://www.mdpi.com/2071-1050/9/12/2272
