
February 16, 2026
I. introduction
Global climate change is upon us. The signs of climate change are numerous, and they are ominous. The average temperature of the globe continues to increase, and there are signs in the past few years that global temperatures may be increasing more rapidly. Figure I.1 shows Berkeley Earth evaluations from 2015 through 2025 of the global mean temperature anomaly: differences in global mean temperatures vs. the average global temp from 1850 – 1900; this base period is used as an illustration of temperatures at the start of the Industrial Revolution. Not only have the past three years been the hottest on record, but global temperatures in the past three years have shown a significant jump over the roughly linear pattern of increasing temperatures since about 1970. It is quite likely that the past three years have seen the hottest global mean temperatures on Earth since the end of the last Ice Age.
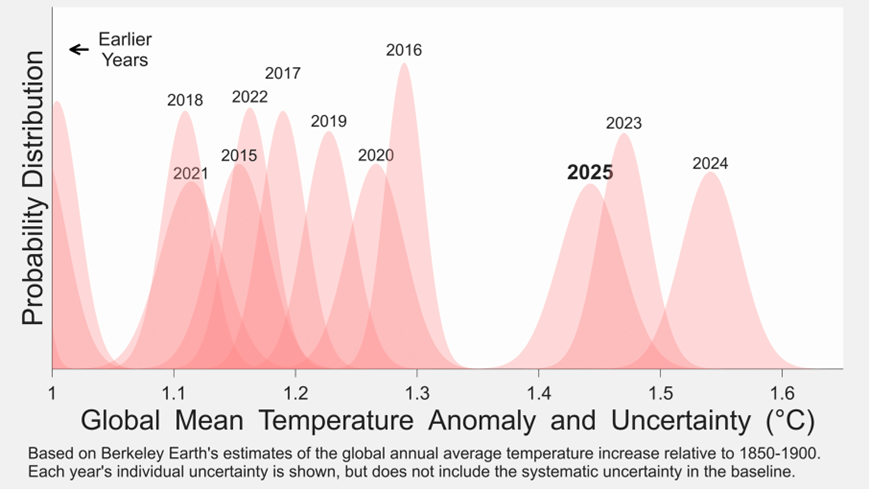
The global mean temperature anomaly is now about 1.5o C above the average from 1850 – 1900. This is the temperature increase that the Intergovernmental Panel on Climate Change (IPCC) warned would be accompanied by a series of serious impacts on the Earth’s climate systems. These impacts included heat waves and drought; excessive rain and flooding in some areas; rapid melting of ice sheets and glaciers, accompanied by rapid rise of sea levels; larger and more destructive wildfires; increased strength of hurricanes; and stress and damage to warm-water coral reefs. All of these have been described and measured in a series of exhaustive reports by the IPCC.
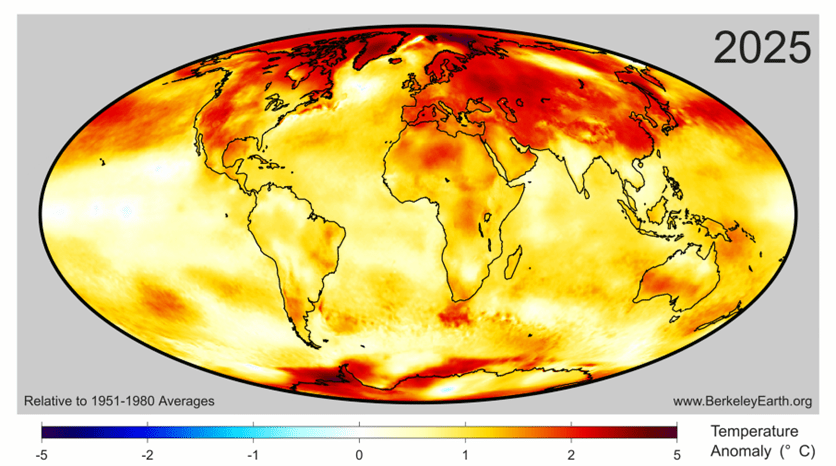
Figure I.2 shows the Berkeley Earth measurements of temperature anomalies around the globe in 2025, relative to the period 1951 – 1980. Although the global average temperature increase was about 1.43o C above the 1850 – 1900 average, temperature increases were much larger in polar regions. There was prominent warming in Asia, North America and northern Africa; 97% of the Earth’s surface was significantly warmer than in the 1951 – 1980 era; and only 0.1% of the Earth was colder than during that period. In 2025, no places on Earth experienced record or near-record cold temperatures.
Despite this clear evidence for a warming globe, throughout this period there has been a small but vocal community of climate change deniers. Many of them have denied that global warming exists, although the measurements by Berkeley Earth and others should have silenced these arguments. They have either denied the existence of the effects of global warming or they ‘explained’ them away as simply evidence of short-term weather patterns. We have exposed the flaws in many of the arguments of climate change deniers in posts on this website. In the post Ten False Narratives of Climate Change Deniers, we scrutinized and debunked several common claims by the deniers. We also posted reviews of prominent scientists who denied the reality or severity of climate change, including Will Happer, Fred Singer, John Christy, and Steve Koonin.
The Heartland Institute has been a consistent source of climate change denial for a few decades. Since their motto is “To discover, develop and promote free-market solutions to social and economic problems,” they reflexively oppose imposition of government regulations on any issue. But they reserve their most vehement criticism for global issues that can only be addressed through concerted efforts from many governments. In March 2017, the Heartland Institute sent a pamphlet called Why Scientists Disagree About Global Warming to 200,000 middle-school and high school science teachers. As we summarized in a blog post, Heartland intended to provide ‘alternative facts’ to promote climate denial in schools. We pointed out that this pamphlet relied on well-worn techniques from the “Science Denier’s Toolbox” used to create doubt about the scientific consensus on topics ranging from the dangers of smoking to the hazards of toxic chemicals to destruction of the ozone layer.
Yet now, the efforts of all these climate-change deniers have been overtaken by the climate denial emerging from the Trump administration. As just the most recent example, on Feb. 12, 2026, Trump and Environmental Protection Agency (EPA) administrator Lee Zeldin announced that the U.S. was repealing the Endangerment Finding. This was a 2009 declaration by the EPA that six greenhouse gases (GHGs) constituted “air pollution” under the Clean Air Act. The argument was that the proliferation of these GHGs threatens the public health and welfare of present and future generations. This announced repeal will be immediately challenged in court by a coalition of various environmental non-government organizations (NGOs) and state Attorneys General, and will eventually make its way to the Supreme Court. The repeal represents the Trump administration turning its back on one of the most important crises of the 21st century. Their inaction will only make it more likely that the globe might pass through one or more climate ‘tipping points,’ where non-linear instabilities move us into new dire climate scenarios.
Since our current climate crisis results from an excess of GHGs being emitted into our atmosphere as a result of human activity such as burning fossil fuels, we can mitigate some future effects of climate change by making a transition to renewable energy sources as soon as possible. For a few decades now, a popular topic among climate change deniers (they tend to call themselves ‘realists’) is to claim that it is not feasible to switch to renewables (for examples from a fairly long list, see here, here, and here). However, as we will show in this post, denials about the role of renewable energy fly in the face of ongoing events. Right now, we are seeing multiple concrete advances in mitigating climate change.
The structure of this post is as follows. In Section II, we will review the major sources of greenhouse gases and, hence, the major targets for mitigation. In Section III, we will discuss the replacement of fossil fuels with renewable energy sources, a transition where China is providing world leadership. In Section IV we will discuss the prospects for making a transition from traditional vehicles that rely on internal combustion engines burning fossil fuels to either hybrid electric or battery electric vehicles (EVs). In Section V we will review ways to reduce energy use and GHG emissions in the manufacturing and construction sectors of world economies.
With respect to mitigating climate change, the difference between the U.S. and China could not be more stark. The Chinese have already surpassed their goal for the current decade of installing 1,500 Gigawatts of solar and wind power, and they are planning a possible large solar array in Earth orbit that could beam solar energy to the Earth 24 hours a day. The Chinese are also leading the world in the supply and export of EVs and EV batteries. China is looking forward to dominate worldwide clean energy production and use in the 21st century. At the same time, the U.S. is looking backward: it has cancelled incentives to purchase electric vehicles, cancelled billions of dollars worth of solar and wind energy projects, and shut down research on renewables. Figure I.3 shows Donald Trump accepting an award from the coal industry for ordering the Defense Department to purchase billions of dollars worth of power from inefficient, costly and toxic coal-fired plants. At this same event, Trump announced that the Department of Energy would allocate $175 million to fund a number of projects that would continue the use of coal-fired plants that were due to be replaced by more efficient and less unhealthy power plants.

II. major greenhouse gas emitters
If we want to mitigate climate change, we should start by decreasing the amount of greenhouse gases (GHGs) that are emitted into the atmosphere. In this section we will begin by defining “CO2 equivalent;” this will allow us to calculate the climate change effects of all greenhouse gases by comparing them to the effects produced by the most common and most important GHG, CO2. Next we will identify the countries that emit the largest amounts of GHGs. After that, we will determine those sectors of the economy that emit the greatest GHGs. This will give us a handle on those regions and economic areas where mitigation efforts would be most effective.
CO2 Equivalents for Greenhouse Gases:
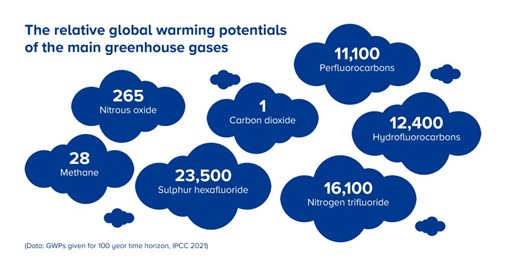
Carbon dioxide is the most important greenhouse gas (GHG) emitted into the atmosphere by human activity. This is because of the quantity released through such activities as fossil fuel burning or from agricultural activity. However, other greenhouse gases are also released. The effects of those gases on the climate are generally calculated in terms of their carbon dioxide equivalents or CO2e. The CO2 equivalent of a particular GHG represents the integrated temperature change that would be produced by the same amount of CO2 over a time horizon of 100 years (other GHGs don’t last as long in the atmosphere as CO2). The Intergovernmental Panel on Climate Change (IPCC) has calculated the global warming potential (GWP) of the seven main greenhouse gases. These seven greenhouse gases, and their GWPs, are: carbon dioxide (CO2: 1); methane (CH4: 28); nitrous oxide (N2O: 265); perfluorocarbons (PFCs: 11,100); hydrofluorocarbons (HFCs: 12,400); nitrogen trifluoride (NF3: 16,100); and sulfur hexafluoride (SF6: 23,500). The GWPs for the seven greenhouse gases are shown in Figure II.1. The GWP for carbon dioxide has been set to 1; thus, the CO2 equivalent of a given mass of a greenhouse gas is obtained by multiplying the mass of the gas by its GWP. For example, the CO2e of one metric ton (tonne) of methane would be CO2e = 1 tonne x 28 = 28 tonnes CO2 equivalent.
The amounts of greenhouse gases that are currently emitted into the atmosphere every year from human activities are:
- CO2: 37-40 billion metric tons (tonnes). Carbon dioxide is the GHG emitted in the greatest abundance, amounting to about 74% of total emissions from human activity. Carbon dioxide is emitted mainly from fossil fuel production and industrial processes.
- CH4: 360-400 million tonnes. When converted to CO2e, methane emissions represent about 17% of total global emissions.
- N2O: 10-12 million tonnes, mainly from agricultural and industrial activity. Nitrous oxide contributes about 5-6% of global emissions in CO2e.
- HFCs: hydrofluorocarbons are released mainly in refrigeration and air conditioning. They account for 2-3% of global emissions.
- PFCs: Perfluorocarbons are released mainly in semiconductor manufacturing and aluminum production. They account for about 0.1% of global emissions.
- SF6: Sulfur hexafluoride is used in electrical transmission equipment and accounts for about 0.1% of global emissions.
- NF3: Nitrogen trifluoride is used in electronics manufacturing and contributes less than 0.1% to global emissions.
So, what countries produce the most GHGs? Figure II.2 shows the GHG emissions, in CO2e, per capita per year as of 2024. This is plotted against the population of that region in billions of people. In addition to individual countries, various regions are also included. The largest per-capita GHG emissions in 2024 came from a group of oil-rich countries called Middle East A (Bahrain, Kuwait, Oman, Qatar and the United Arab Emirates); average per capita GHG emissions for this region were 32 tonnes CO2e/yr. The total GHG emissions from a given country or region are obtained by multiplying the emissions per capita times the population of that region; i.e., it is the area of that rectangle, in tonnes CO2e/yr.
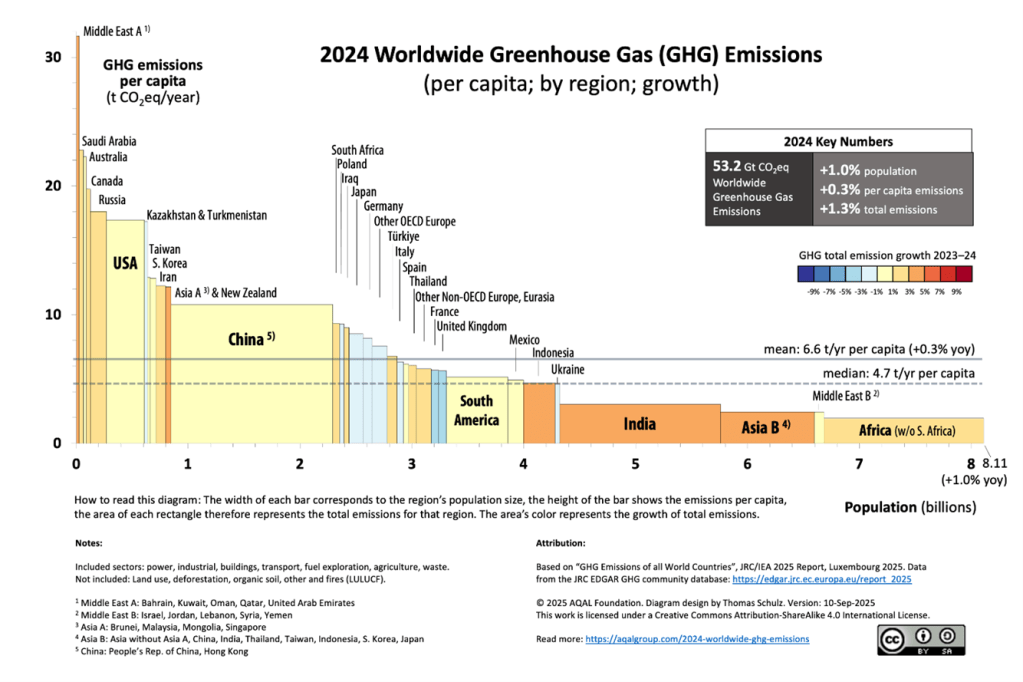
The U.S. produced about 18 tonnes GHG per person in 2024, roughly 6.1 billion tonnes of GHG released, or 11% of total global emissions. China produced about 10 tonnes GHG per capita, but when multiplied by the Chinese population of 1.4 billion, it produced a total of 14 billion tonnes of GHG in 2024, about 26% of global emissions, and the highest of any country (the U.S. was second). India produced about 5.5% of total global emissions. Globally, the mean per capita emissions of GHG were 6.6 tonnes/yr. Note that the 3.3 billion people living in the regions of the globe with the lowest per capita GHG released a total of about 0.7 tonnes of GHG, roughly 10% of the GHG released into the atmosphere by the U.S., and about 1% of total global GHG emissions.
Note that the GHG emissions from various countries may not reflect the sole effect of that country on global GHG emissions. For example, the U.S. imports many manufactured goods from China. Although those items are produced for the U.S. and later used there, the GHGs emitted in their production are assigned to China and do not appear in the total of GHG production for Americans. The top four categories of manufactured goods that are made in China but exported to the U.S. are:
- Electronics and Electrical Equipment: The largest import category from China to the U.S., valued at $127 billion in 2024, includes computers, laptops, smartphones and networking equipment.
- Mechanical Appliances: The second-largest import category totaling about $85 billion in 2024, this includes industrial machines, HVAC systems and data storage units.
- Toys and games: The third-largest category at about $32 billion worth of imports in 2024, this includes toys, video games, and sporting and exercise equipment.
- Plastics: The fourth-largest category in 2024 at about $21 billion, this includes plastic containers, storage items and food packaging.
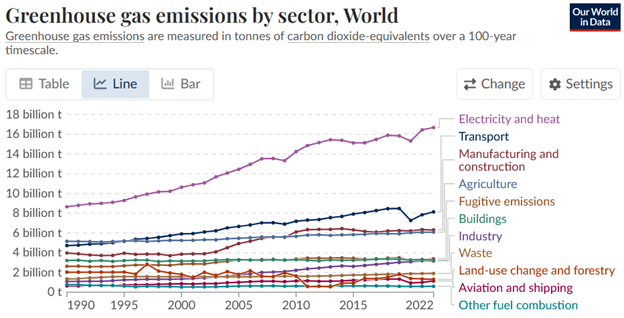
What sectors of the economy release the greatest amounts of GHGs? Figure II.3 shows the global amounts of GHG, in CO2e, released in several different segments of the economy. Globally, the largest GHG emissions are in the electricity and heat sector, with about 17 billion tonnes CO2e annually. The next largest sector is transportation, with about 8 billion tonnes CO2e, and manufacturing and construction, and agriculture, each with about 6 billion tonnes CO2e. Thus globally, focusing on reducing greenhouse gas emissions in electricity and heat production, mainly from burning of fossil fuels, would likely produce the greatest overall decrease in GHG emissions into the atmosphere.
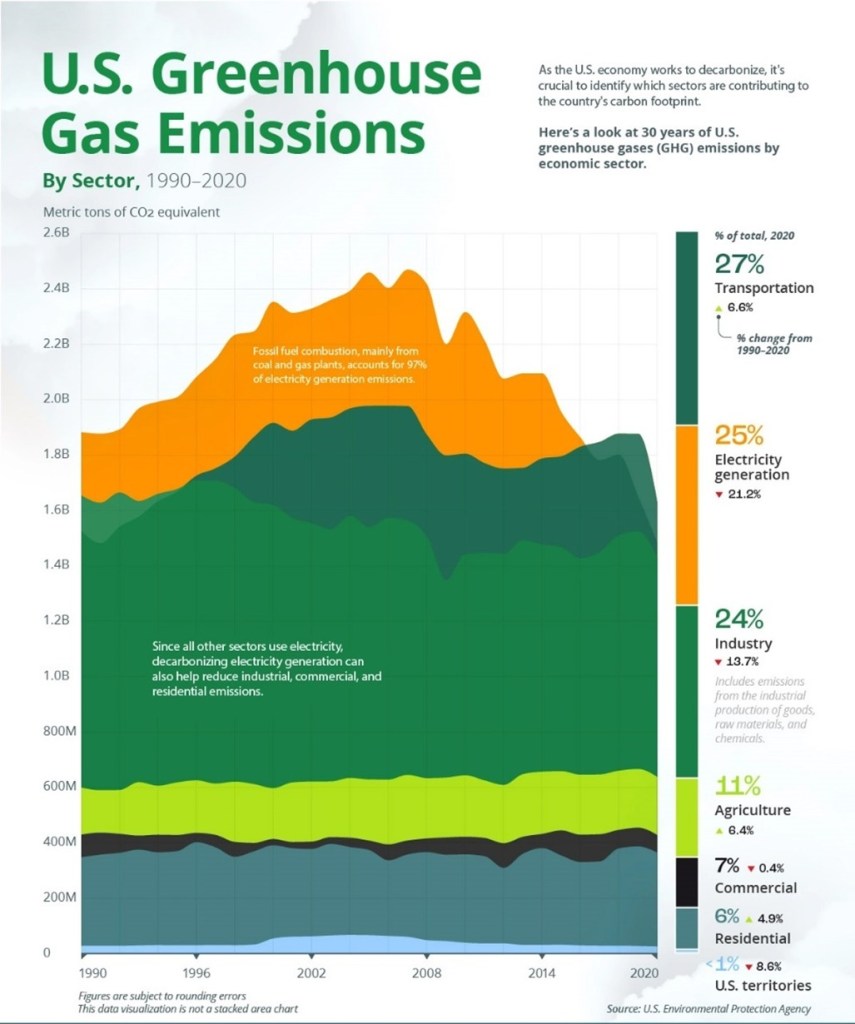
In the U.S., the production of greenhouse gases is distributed somewhat differently from the global average. Figure II.4 shows the release of GHGs over a 30-year span from 1990 to 2020. The GHG emissions are shown in billions of metric tons of CO2e. The percentage of each of the top 6 sectors of the economy is shown, as well as the percentage change in GHG emissions in that sector in 2020 relative to 1990. In 2020, the sector of the U.S. economy with the greatest release of GHGs was transportation, with 27% of total U.S. emissions. The second largest sector was electricity with 25%, followed by industry with 24%, agriculture with 11%, commercial with 7% and residential with 6%. It is interesting to note that in 1990, electricity was the largest sector; however, GHG emissions in that sector have declined by 21.2% in the past 30 years as coal-powered production has often been replaced by natural gas, while GHG emissions in the transportation sector have increased by 6.6% in that period. The increase in GHG emissions in the transportation sector reflects the fact that, relative to other developed countries, the U.S. has been very slow in converting from gasoline engines to hybrids or electric vehicles. In Section IV of this post we will discuss this in more detail.
III. replacing fossil fuels with renewable energy
Global rise in renewables:
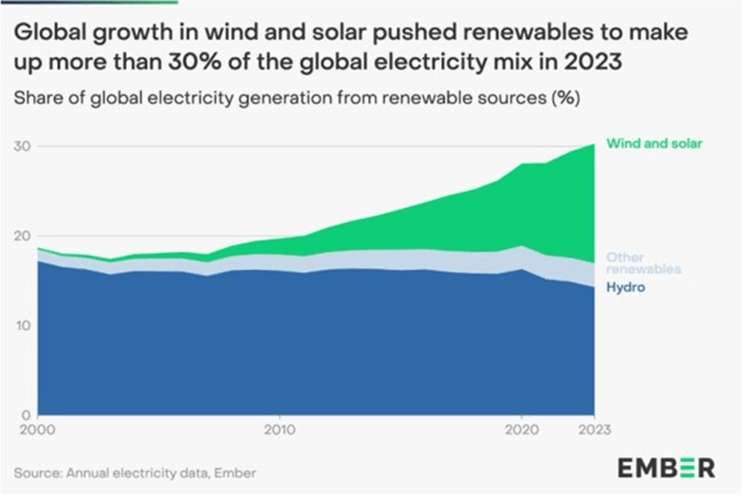
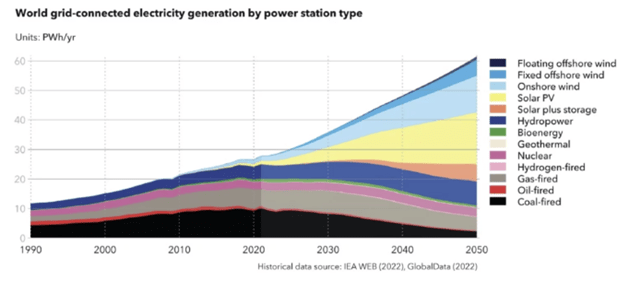
Since energy production is the economic sector that currently produces the most greenhouse gases, it is also the one most important to reform. Fossil fuel industry agents and supporters like to claim that renewable sources cannot meet the world’s energy demand, but this need not be true. Figure III.1 shows that the fraction of the world’s electricity production provided by renewables reached 30% in 2023 and is rapidly growing, thanks to the rapid rise in solar and wind power (the green band in Fig. III.1). The projections shown in Fig. III.2 indicate that the carbon-free combination of renewables and nuclear energy can provide over 90% of worldwide electricity demand by mid-century. That assumes that humans, and especially AI, can temper their growing appetite for more and more power.
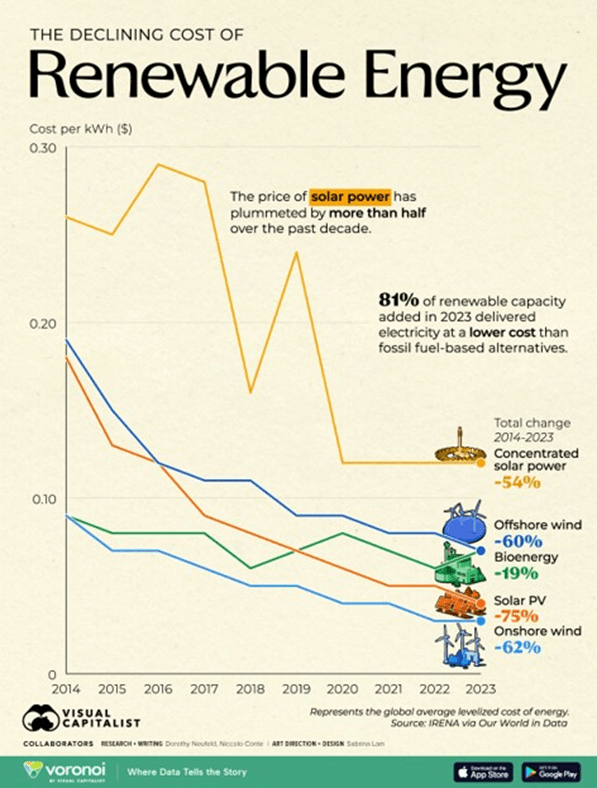
A major factor in the growth of renewables has been their dramatically decreasing costs. As indicated in Fig. III.3, the operating costs per kilowatt-hour for various types of wind and solar power production have decreased by factors between 2 and 4 over the past decade. The largest decrease has been for solar power from photovoltaic (PV) panels (down 75%), with onshore (62%) and offshore (60%) wind power not far behind in price decrease. Energy from concentrated solar power plants, where huge arrays of mirrors reflect sunlight to the top of collecting towers, has dropped in cost by 54%. These cost reductions already make renewable energy cost-competitive with fossil fuel energy. Indeed, 81% of renewable capacity added worldwide in 2023 delivered electricity at a lower cost than fossil fuel alternatives. Furthermore, ongoing research we have documented in a previous post will lead to significant efficiency improvements in both solar and wind power. In addition, reductions in the cost of storage batteries, which we document further in Sect. IV, enhance the storage of wind and solar energy for use when the sun isn’t shining and the wind isn’t blowing.
China’s renewable dominance:
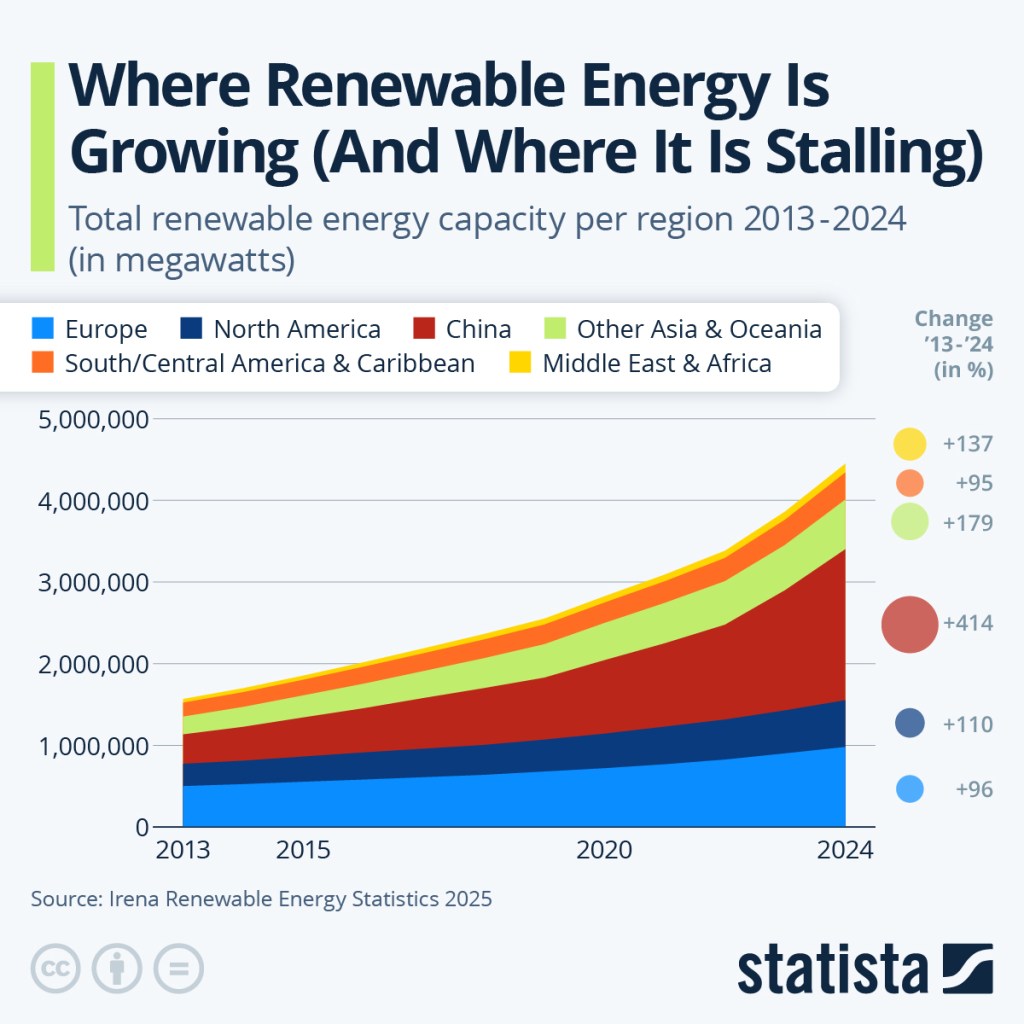
Which countries or regions are dominating the growth in renewable energy seen in Fig. III.1? In Fig. III.4, China (red band) is compared to other regions of the world, including Europe and North America. It is clear that China dominates not only the total amount of renewable power installed (about 1,800 GW by 2024, compared to about 500 GW in North America) but also the growth rate. China’s percentage growth in installed renewable power from 2013 to 2024 is more than four times that in Europe and nearly four times that in North America.
We often hear that China is doing little to reduce its enormous greenhouse gas emissions, but this is far from the truth. In addition to its rapid growth in renewables, China is the country that is adding nuclear power capacity most rapidly (see Fig. III.5), so that by 2040 it is projected to generate about a million GW-hours of electricity annually. That projection relies on 150 new nuclear power plants, each of these conventional fission reactors producing 1 GW or so of peak electric power. China is also investing heavily in research on nuclear fusion power and may conceivably host the world’s first commercial fusion power plant by mid-century.
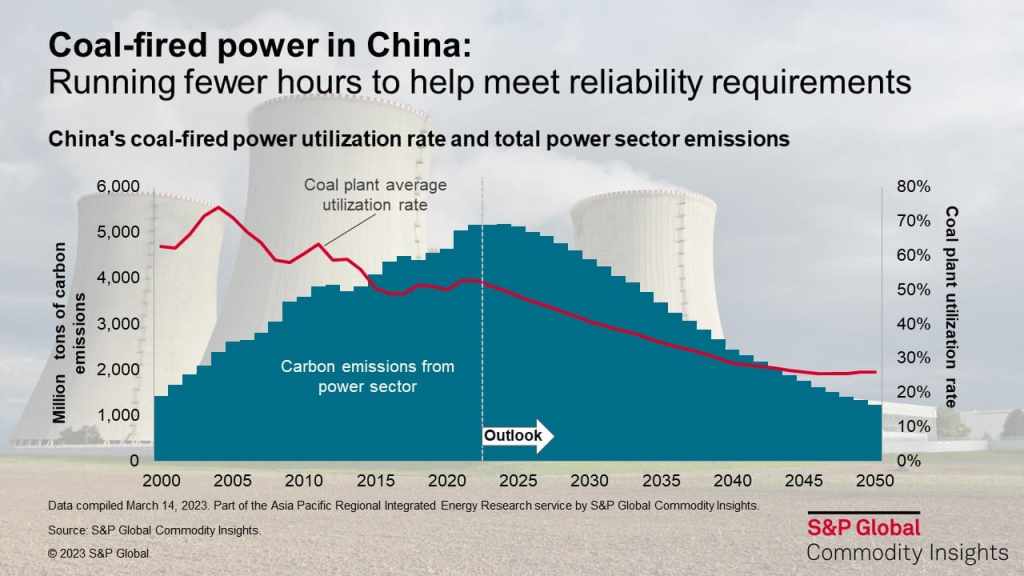
At the same time, China is continuing to build coal-fired power plants, though the number of operating plants is expected to peak during this decade as older plants are retired. The Chinese plan is to use coal plants to fill in gaps in carbon-free energy production as renewable and nuclear capacity grow. Coal plants still currently deliver the lion’s share of China’s energy, so that its energy sector’s greenhouse gas emissions have reached a peak of about 5 billion metric tons of carbon dioxide-equivalent per year, roughly 30% of the world’s current total from energy production. But, as indicated in Fig. III.6, the Chinese plan calls for reducing the number of coal plants and their average utilization rate to under 30%, so that by mid-century greenhouse gas emissions from its power sector will be reduced by a factor of five.
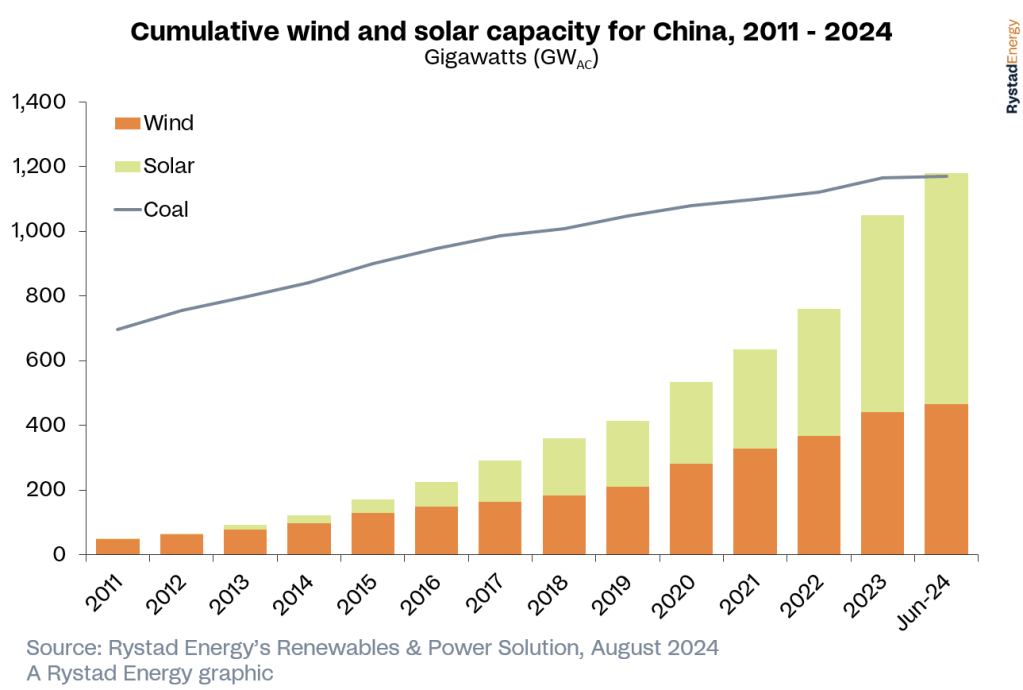
How is China managing to expand its renewable energy capacity at four times the rate of Europe and North America? By covering mountains, deserts, lakes, reservoirs, and coastal waters with many millions of photovoltaic panels, as illustrated in the short video in Fig. III.7. They have facilitated efficient installations by using armies of drones to transport the panels from staging areas to often inhospitable mountainside locations (see Fig. III.8) and robots to aid the installation. Solar-powered robots and drones are also used to clean the panels. China’s installations of wind power, both on land and sea, have been increasing almost as rapidly as their solar capacity. As shown in Fig. III.9, the total capacity of China’s wind and solar power equaled that of its coal plants in mid-2024. But the renewable installations are proceeding so rapidly that as of this writing China now has 1,100 GW of solar and 600 GW of wind power installed. Recall for calibration that a typical large conventional nuclear power plant produces about 1 GW of power.
Space-Based Solar Power:
While China’s installations of millions of solar panels is extremely impressive, these installations still are subject to the same limitations of all Earth-bound solar power: they produce energy only when they are exposed to sunlight. When one accounts for nights, seasons, weather, and cloud cover, Chinese PV panels are exposed to sunlight no more than 30% of the time in a typical year. Furthermore, PV panels typically average only about 75% of their peak power output capacity when they are exposed to sunlight. The current 1,100 GW reflects peak power output from the solar installations. Thus, the solar capacity currently installed in China will typically provide the equivalent of about 250 GW steady output if the energy produced is stored, still more than its planned nuclear power capacity. Furthermore, in the visible light portion of the electromagnetic spectrum to which current solar panels are most sensitive, 30% or more of the sunlight that reaches the top of Earth’s atmosphere is absorbed, reflected, or scattered within the atmosphere before reaching Earth’s surface. Thus, photovoltaic panels installed in space, above Earth’s atmosphere, would be exposed to 4—5 times as much annual sunlight as panels on Earth’s surface. By using next-generation photovoltaic technology with improved efficiency for converting sunlight to electricity, that factor of improvement over surface panels could be increased to 6-8.
The concept of space-based solar power was first mentioned in 1941 in a science fiction short story by Isaac Asimov. The idea of space-based solar power (SBSP) began to be taken seriously in 1968, when Peter Glaser published an article entitled Power from the Sun: Its Future. Detailed conceptual studies of SBSP by NASA and the U.S. Department of Energy throughout the last quarter of the 20th century ended up concluding that the technical challenges were sufficiently daunting and costly to overcome that SBSP could not compete economically with surface-based solar power. But in the 21st century the idea is being re-evaluated by the European Union, Japan, the commercial company Aetherflux, the U.S. military, and China. China has taken the worldwide lead by actually launching a project to install an orbital solar power station beginning in the 2030s.
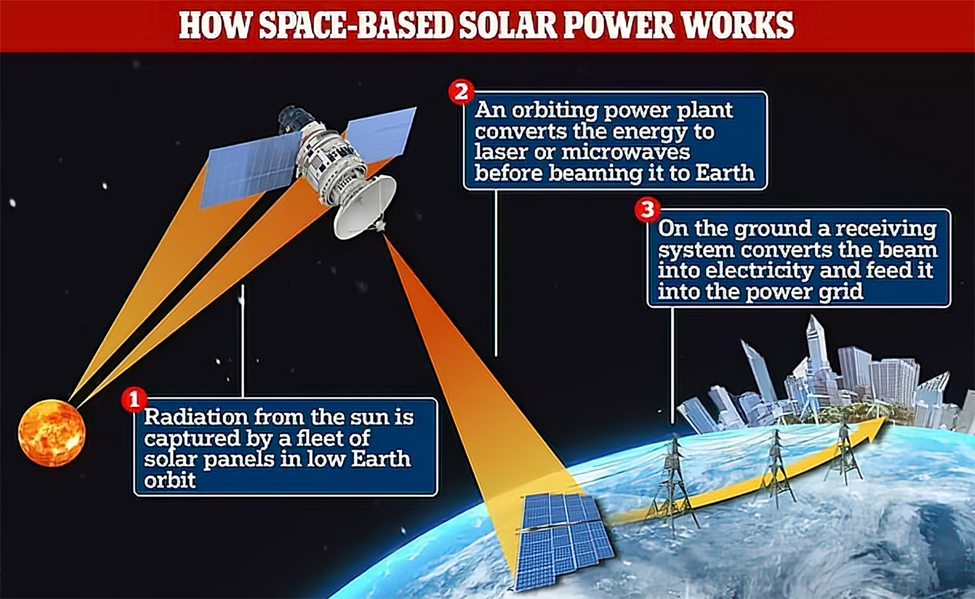
The basic concept of SBSP is illustrated in Fig. III.10. Solar radiation would be intercepted continuously, over day and night and year round, by orbiting photovoltaic panel arrays that rotate to always face the Sun. The electricity output from the panels would be converted within the orbiting station to microwaves or laser beams to transmit the energy wirelessly to ground-based arrays of receivers. Earth’s atmosphere is largely transparent to microwaves in the few gigahertz frequency range, with corresponding wavelengths of tens of centimeters. The receivers, in turn, would convert the energy back into electricity to feed into electrical grids. As long as the conversion efficiencies from electrical energy to microwaves or laser beams and back to electrical energy on Earth are not too low, space-based photovoltaic panels can certainly deliver more power than the same ones placed on the surface and can deliver it continuously day or night. But the costs of launching, assembling, and maintaining space-based arrays are certainly daunting.
China’s project involves a number of stages of technical demonstrations. In 2022, for example, a team from Xidian University built a 75-meter tall tower to demonstrate that solar power collected near the top could be successfully transmitted via microwaves to a receiver on the ground. A decade earlier a NASA research team had already demonstrated microwave transmission of solar power between a mountaintop in Maui and the island of Hawaii, 92 miles away. China now plans to launch a kilowatt-scale prototype into space by 2028 to demonstrate that the entire power collection and transmission chain can work from solar panels above Earth’s atmosphere. Their plan is to launch a megawatt-scale system by the middle of the next decade and gigawatt-scale systems by mid-century. A gigawatt SBSP would stretch over one or more kilometers, an order of magnitude larger in dimensions than the International Space Station. The staged approach facilitates learning what the problems are from each stage and designing solutions for the next stage.
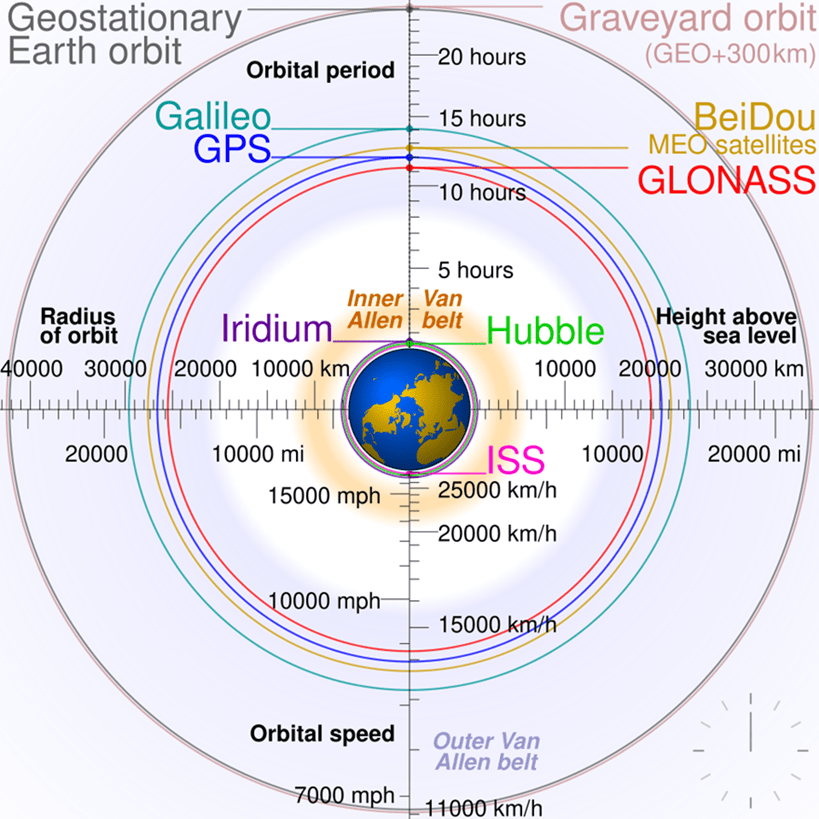
Various proposals have been suggested by different groups for the best orbit in which such SBSP stations would reside. The choice that offers the simplest ground-based receiver setup for the beamed energy is a geosynchronous or geostationary orbit (see Fig. III.11). This is an orbit in which a satellite or power station would circle the Earth in exactly one day, so that it follows Earth’s rotation. From the viewpoint of an observer on Earth, the station would then appear to be stationary in the sky. In this way, it could continuously transmit energy to a fixed set of antennae on the ground. A circular geosynchronous orbit maintains a constant altitude of 35,786 kilometers, or 22, 236 miles, above Earth’s surface, still less than a tenth of the distance to the Moon. When the station lies directly above Earth’s equator, the orbit is called geostationary. (Other geosynchronous orbits can be tilted with respect to the equatorial plane.) The orbital speed of an object in geostationary orbit is just under 11,000 kilometers per hour. The majority of broadcasting satellites are currently in geostationary orbits so that they can also use stationary receivers on the ground. There will be a loss of line-of-sight to the Sun when a geostationary power station is directly in Earth’s shadow, but that corresponds to a dark period of only about 70 minutes each day.
In order to reduce the costs of mounting such an enormous SBSP, China has already begun testing various aspects of the technology. They are currently developing reusable rockets to bring down launch costs. On their own existing space station they are testing robotic assembly in orbit (see Fig. III.12), so that solar panels can be sent in separate launches and assembled into a giant array in space. They are also currently testing microwave energy transmission from orbit to Earth.

Figure III.13 shows an artist’s conception of a large SBSP station in orbit above the Earth’s equator. Note that the microwave generator points down toward the surface. One wants the transmitted microwave beam to be spread over a cone (as depicted in Fig. III.10), so that the energy is not dangerously concentrated upon arrival at the surface. The receivers must then be large-area (i.e., of order several kilometers in diameter) rectennae which act as antennae and rectifiers that convert incoming microwaves to outgoing DC electric energy. The initial costs of the Chinese project will be enormous, but the Chinese government is betting on gaining economies of scale as they move toward a suite of kilometer-size SBSP stations in the second half of this century, which would give them global dominance over energy production in space. This is a high-risk project but given the rapid progress China has made toward massive installations of ground-based solar panel arrays in inhospitable locations, one should not bet against China’s ability to carry this off. Even if they succeed in establishing these SBSP stations, many significant engineering challenges will remain, from dealing with impacts on the panels from space debris to keeping the microwave beam from drifting off-target from the ground-based rectenna array. There will also be geopolitical challenges as other countries may worry about such stations being converted to microwave weaponry in space.

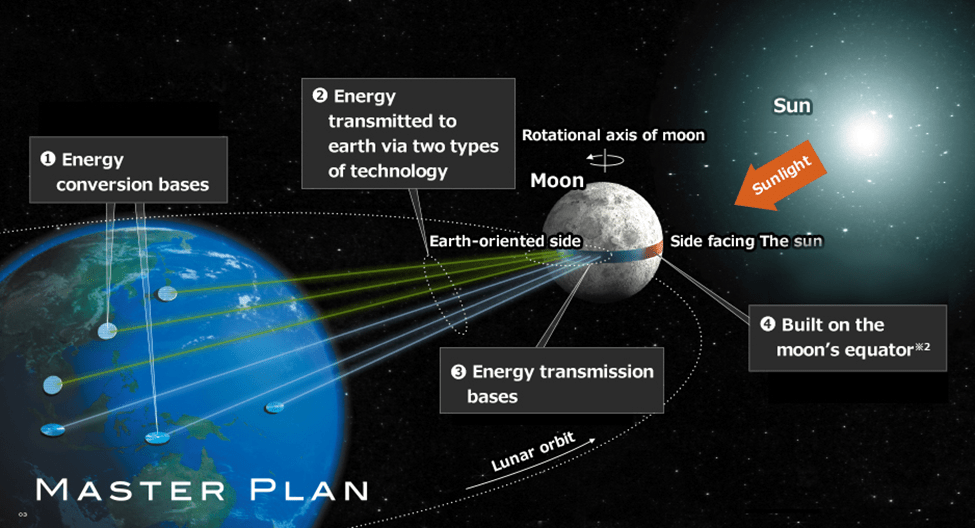
The Chinese SBSP project has certainly caught the attention of other countries, which have launched their own research projects this century. The U.S. Naval Research Laboratory, the U.S. Air Force, and CalTech have all initiated incremental studies of elements of a SBSP station. In 2023 the CalTech team successfully transmitted a detectable amount of microwave energy from a small test solar panel in low Earth orbit to a ground-based antenna. In the UK, the Space Energy Initiative has plans to launch their first SBSP station in the 2040s. The European Space Agency (ESA) has launched project Solaris with the aim of an operational SBSP station in geostationary orbit by 2040. And Japan has been studying the possibility for decades now, launching a space solar power system program in 1998 that continues to the present day. While a variety of details of a space-based program have been debated over time, perhaps the most fanciful conception has been generated by the Japanese Shimizu Corporation. Their LUNA RING “dream” proposal (see Fig. III.14) would use a Moon-based robotic solar panel production plant to encircle the 11,000 kilometer circumference of the equator of the Moon with a solar panel array varying in width from a few to 400 kilometers! Hopefully, climate change mitigation does not need to wait for that project to be realized.
What all this means is that we may be on the verge of a new 21st-century space race for energy production, as most governments recognize that a transition away from fossil fuels is necessary. At the moment, China has the lead and has demonstrated extraordinary attention to renewable energy already in its massive Earth-based installations.
— Continued in Part II —
