
Note added February 13, 2026: On Feb. 12, 2026 EPA Administrator Lee Zeldin and President Donald Trump announced that the administration was indeed going through with the repeal of the 2009 Endangerment Finding that underpins all EPA regulations regarding greenhouse gas emissions. It is doing this despite the more than half million comments EPA received on its proposal to do this, including ours below, which detailed the many essential flaws in the EPA proposal’s legal, scientific, and technical arguments. The Department of Energy 2025 Climate Working Group Report, on which all of the EPA proposal’s scientific arguments were based, was judged in court to be drafted by illegally appointed advisors. But this did not hinder Zeldin’s decision, which was preordained.
Governor Gavin Newsom of California announced immediately after the EPA decision that his state would sue to oppose the repeal. In fact, we anticipate that many state Attorneys General and several science advocacy institutions will bring lawsuits to oppose the EPA repeal. We also believe that those parties have very firm grounds for their opposition, not least because the Endangerment Finding was essentially codified by Congress in the 2022 Inflation Reduction Act. In all likelihood, the repeal of the Endangerment Finding will be tied up in court for years. If the repeal is eventually allowed to proceed, it will set back U.S. climate policy by decades, as it is not a decision that will be easy for subsequent administrations to reverse.
September 9, 2025
It is abundantly clear by now that human burning of fossil fuels, releasing carbon dioxide, methane, and other greenhouse gases into the atmosphere, is the fundamental cause of the ongoing warming of Earth and the multiple changes to Earth’s climate that are caused by that warming. In attempts to ameliorate U.S. contributions to climate change the Environmental Protection Agency (EPA) has been regulating greenhouse gas (GHG) emissions since 2009. The Agency basis for these regulations is its 2009 Endangerment Finding, which found, under authority granted to the Agency in the 1970 Clean Air Act (Section 202(a)(1)), that six GHGs emitted by motor vehicles may “reasonably be anticipated to endanger public health and welfare.” Therefore, the GHGs may be regulated as air pollutants pursuant to the Clean Air Act.
The EPA under previous administrations had denied petitions from states to regulate GHGs, arguing that the Clean Air Act (CAA) did not grant EPA that authority. This denial was challenged in court, leading to the U.S. Supreme Court (SCOTUS) ruling in the 2007 case Massachusetts v. EPA. The Court ruled that GHGs “fit well within the CAA’s capacious definition of air pollutant” and that the EPA had the responsibility to set GHG emissions standards if the Agency found that the GHG emissions contribute meaningfully to climate change. The Endangerment Finding made just such a determination. The Finding was upheld by the D.C. Circuit Court in 2012 and SCOTUS declined further review.
In the wake of the Endangerment Finding the EPA issued GHG regulations for motor vehicles (2010), for power plants (2015), and for oil and gas operations (2016). In 2017 the Agency extended the Endangerment Finding to cover aircraft engines as well. Under the second Trump administration, EPA Administrator Lee Zeldin wants to eliminate all GHG regulations, but he must first rescind the Endangerment Finding. These actions follow guidance proposed in Project 2025 and follow up on promises Donald Trump made to oil executives during his Presidential campaign in exchange for their enormous campaign donations. Pursuant to these goals, the EPA issued on August 1, 2025 a proposal to rescind the 2009 Endangerment Finding and to modify motor vehicle emissions standards. The proposal is open for public comment until Sept. 22, 2025. We have drafted a detailed comment refuting every one of the flawed major arguments the EPA uses in its proposal to undermine the original Finding. That comment, as amended by members of the Concerned Scientists @ IU and submitted to Regulations.gov, is included in its entirety below.
————————————————————————————————————————————
Comment on EPA Proposed Reconsideration of 2009 Endangerment Finding and Greenhouse Gas Vehicle Standards
(In reference to Docket ID No. EPA-HQ-OAR-2025-0194)
We are writing on behalf of Concerned Scientists @ IU (CSIU), a grassroots, non-partisan community organization consisting of over 1000 members—scientists, students, and supporters of science—from the south-central Indiana region and its student affiliate organization Advocates for Science @ IU. While many of our members are faculty, students or staff at Indiana University, our organization does not officially represent the University. Concerned Scientists @ IU is dedicated to strengthening the essential role of science in public policy and evidence-based decision making.
We are strongly opposed to the EPA’s proposal to rescind the 2009 Endangerment Finding, which allowed regulation of greenhouse gas (GHG) emissions from new U.S. vehicles and vehicle engines. This proposal is one part of the current administration’s concerted efforts to undermine the science of climate change and to abrogate the country’s responsibility to take part in solving this very serious global problem. Since 2009, the evidence that human burning of fossil fuels is the dominant cause of ongoing climate change and that its deleterious impacts are already affecting the quality of human life has only grown stronger and clearer. Yet the President has withdrawn the U.S. from the global Paris Climate Accord. The Director of the Office of Management and Budget proudly proclaimed in the President’s FY2026 Budget Proposal that the proposed budget is “eliminating funding for the globalist climate agenda…[and] unreliable renewable energy.” The Secretary of Energy has commissioned a new climate report, written by scientists at the fringe of the global climate science community, to cast doubt on the urgency of climate change through a chain of half-truths. And the EPA Administrator relies solely on that report and its half-truths in this rescission proposal, although he claims to have consulted a wide array of climate research literature.
The EPA proposal is a muddled assemblage throwing many alternative rationales for rescinding the 2009 Endangerment Finding at the wall, in the hope that some will stick. The basic alternative arguments can be classified as legal, scientific, and technical. We show below that each of these basic arguments is unsound. The proposal effectively takes the untenable position that any U.S. regulation that is not capable of solving the global problem of climate change on its own is not worth pursuing. There are so many alternative rationales offered that the EPA Administrator requests comments on 27 distinct, but overlapping, parts of the proposal. We will organize the rest of our comments within the requested organizational scheme.
In response to solicitation of comment C-1:
The proposal ignores several basic facts that are germane to the framework of a discussion of GHG emissions by new U.S. vehicles:
- With the exception of Saudi Arabia, the U.S. has the highest GHG emissions per capita in the world1 (see Fig. 1).
- The transportation sector has in recent years overtaken electric power generation as the largest emitter of carbon dioxide in the U.S.3 (see Fig. 2).
- Among the U.S. transportation sector, passenger cars, light-duty trucks, and medium- and heavy-duty trucks cumulatively emit more than 1.5 billion metric tons of CO2 -equivalent each year4 (Fig. 3) out of total global emissions now approaching 60 billion metric tons per year.


So U.S. vehicles are a significant contributor to climate change, which is why it is so critical to reject this proposal. The focus of U.S. law and policies should be on improving U.S. GHG emissions, not on solving the entire global problem by itself.
In response to solicitation of comment C-11:
Since the primary rationales offered for rescinding the Endangerment Finding are based on legal grounds and a revised interpretation of the Clean Air Act (CAA) 202(a), we deal with the flaws in those arguments first. The crux of the proposal’s legal argument is that the EPA did not have the authority to issue an Endangerment Finding under CAA 202(a). This legal case is completely undermined since the precise question was already unambiguously adjudicated by the U.S. Supreme Court (SCOTUS) in the 2007 case Massachusetts v. EPA and further reinforced by the U.S. Congress in the 2022 Inflation Reduction Act (IRA). Here is an excerpt from the Massachusetts ruling:
- “On the merits, the first question is whether §202(a)(1) of the Clean Air Act authorizes EPA to regulate greenhouse gas emissions from new motor vehicles in the event that it forms a “judgment” that such emissions contribute to climate change. We have little trouble concluding that it does.”
Nonetheless, the current EPA Administrator claims to rely on the more recent SCOTUS ruling in Loper Bright Enterprises v. Raimondo (2024), which “expressly overturned the doctrine of deference to agency statutory interpretation, ruling that statutes ‘have a single, best meaning’ that is informed, but not dictated, by Executive Branch practice.” The EPA Administrator uses this finding as an opportunity to offer his own “best reading” of CAA 202(a), a reading that is at odds with the clear language of the original statute, with the Inflation Reduction Act, and with the Massachusetts ruling.
From the EPA proposal: “The EPA proposes that this statutory language is best read as authorizing the Agency to identify and regulate, as an integral part of a rulemaking prescribing emissions standards, air pollutants that cause or contribute to air pollution that itself endangers public health and welfare through local or regional exposures” (our emphasis). In this reading, pollutants that contribute to a global issue would not be covered. But CAA itself never mentions such a focus on “local or regional exposures.” The statute’s explicit inclusion of the phrases “any air pollutant” and its inclusion in section §7415 of explicit consideration of US emissions “which may reasonably be anticipated to endanger public health and welfare in a foreign country” clearly render the EPA’s proposed reading as inaccurate.
Furthermore, §7602 of the CAA defines what it means by “welfare”:
“All language referring to effects on welfare includes, but is not limited to, effects on soils, water, crops, vegetation, manmade materials, animals, wildlife, weather, visibility, and climate, damage to and deterioration of property, and hazards to transportation, as well as effects on economic values and on personal comfort and well-being, whether caused by transformation, conversion, or combination with other air pollutants” (our emphasis again).
Weather may be thought of as a local or regional effect, but “climate” is generally understood to be broader. How can a statute that concerns itself with international effects and effects on climate be seriously read to focus solely on standards affecting only local or regional exposures? The EPA proposal furthermore invokes “ordinary language,” which defines a pollutant as “[a] poisonous or noxious substance that contaminates the environment.’’ But CAA clearly had a broader focus than “ordinary language” by including effects on climate. The Massachusetts ruling commented explicitly on this breadth by pointing out that the statute’s definition of “pollutant”
- “embraces all airborne compounds of whatever stripe, and underscores that intent through the repeated use of the word ‘any.’[Footnote 25] Carbon dioxide, methane, nitrous oxide, and hydrofluorocarbons are without a doubt ‘physical [and] chemical … substance[s] which [are] emitted into … the ambient air.’ The statute is unambiguous.”
Furthermore, Title VI of the Inflation Reduction Act includes the following definition in every individual section, explicitly identifying GHGs as “air pollutants”:
- “GREENHOUSE GAS.—The term ‘greenhouse gas’ means the air pollutants carbon dioxide, hydrofluorocarbons, methane, nitrous oxide, perfluorocarbons, and sulfur hexafluoride.”
If there is, indeed, a “single best meaning” of a statute, it is presumably the one interpreted by SCOTUS. The Massachusetts ruling left no ambiguity regarding not only the EPA’s authority but also its responsibility under the CAA:
- “If EPA makes a finding of endangerment, the Clean Air Act requires the agency to regulate emissions of the deleterious pollutant from new motor vehicles…. Under the clear terms of the Clean Air Act, EPA can avoid taking further action only if it determines that greenhouse gases do not contribute to climate change or if it provides some reasonable explanation as to why it cannot or will not exercise its discretion to determine whether they do.”
The EPA proposal further relies on the SCOTUS decision in the 2021 case West Virginia, et al. v. EPA, et al., where the Court confirmed “that an agency must have more than ‘a colorable textual basis’ to claim authority to decide major questions of policy that Congress would generally reserve for itself in the first instance.” First of all, it was not EPA who claimed authority to regulate vehicle GHG emissions, it was SCOTUS who confirmed5 that EPA had that authority. Secondly, air pollution is such a major question and Congress addressed it in CAA 202(a) by explicitly delegating authority to the EPA Administrator to determine which vehicle emissions are pollutants under its capacious definition and how to regulate them.
Thirdly, Title VI of the 2022 Inflation Reduction Act reacted explicitly to the West Virginia ruling by amending the Clean Air Act to explicitly designate six GHGs as air pollutants and to unambiguously provide Congressional authorization to the EPA to set standards for and incentivize reductions of GHGs. Congress thus made it clear that they consider GHG emissions to be a danger to the health and welfare of Americans, as the 2009 Endangerment Finding claimed. The IRA provided funds explicitly for EPA to encourage such reductions from vehicles; for example:
- Under Section 60105: “(g) GREENHOUSE GAS AND ZERO-EMISSION STANDARDS FOR MOBILE SOURCES.—In addition to amounts otherwise available, there is appropriated to the Administrator of the Environmental Protection Agency for fiscal year 2022, out of any money in the Treasury not otherwise appropriated, $5,000,000, to remain available until September 30, 2031, to provide grants to States to adopt and implement greenhouse gas and zero-emission standards for mobile sources pursuant to section 177 of the Clean Air Act (42 U.S.C. 7507).”
- Under Section 137: ‘‘(b) GREENHOUSE GAS AIR POLLUTION PLANNING GRANTS.—The Administrator shall make a grant to at least one eligible entity in each State for the costs of developing a plan for the reduction of greenhouse gas air pollution to be submitted with an application for a grant under subsection (c). Each such plan shall include programs, policies, measures, and projects that will achieve or facilitate the reduction of greenhouse gas air pollution. Not later than 270 days after the date of enactment of this section, the Administrator shall publish a funding opportunity announcement for grants under this subsection.
- ‘‘(c) GREENHOUSE GAS AIR POLLUTION REDUCTION IMPLEMENTATION GRANTS.— ‘‘(1) IN GENERAL.—The Administrator shall competitively award grants to eligible entities to implement plans developed under subsection (b).”
President Trump has rescinded funds granted under the IRA, but it remains the law of the land. The EPA Administrator does not have the authority to ignore this law, as he has done throughout most of this proposal. The IRA makes explicit the Congressional designation of the EPA as the agency to reduce GHG emissions from vehicles as well as other sectors. So, the “major questions” issue is no longer relevant to this argument. The issue at question here is not the overall U.S. strategy for dealing with climate change, which is a major question beyond the scope of CAA, but rather the strategy for dealing with polluting vehicle emissions.
In short, EPA has both the authority and the responsibility, explicitly designated by Congress, to deal with vehicle GHG emissions. The proposal’s legal arguments should therefore be rejected. We next address its attempts to undermine the science of global warming and climate change.
In response to solicitation of comment C-2:
The proposal’s second major rationale for rescinding the Endangerment Finding is that “The scientific underpinnings of the Endangerment Finding are weaker than previously believed and contradicted by empirical data, peer-reviewed studies, and scientific developments since 2009.”
The EPA Administrator claims at the outset that he consulted a wide range of climate change surveys in reaching his conclusions. Yet each point he raises refers only to the 2025 Climate Working Group Report6 (CWG 2025) A Critical Review of Impacts of Greenhouse Gas Emissions on the U.S. Climate, commissioned by the current Secretary of Energy for the express purpose of casting doubt7 on the role of human activities in causing climate change and the impacts of climate change. The hand-picked team of five scientists who drafted that report was selected from the tiny contrarian wing of the international climate science community. The blog site DebunkingDenial, authored by two CSIU members, previously debunked in extensive detail prior works by two of the Report’s authors: John Christy8 and Steven Koonin9. In contrast to the five authors of CWG 2025, the assessment reports from the Intergovernmental Panel on Climate Change (IPCC) and the U.S. Global Change Research Program (which produced the earlier National Climate Assessments) typically include contributions from well over 1,000 worldwide scientists.
Here are most of the half-truths the EPA proposal relies on from CWG 2025:
1)“Notwithstanding increased public attention to heat waves, the data suggest that domestic temperatures peaked in the 1930s and have remained more or less stable, in relative terms, since those highs.”
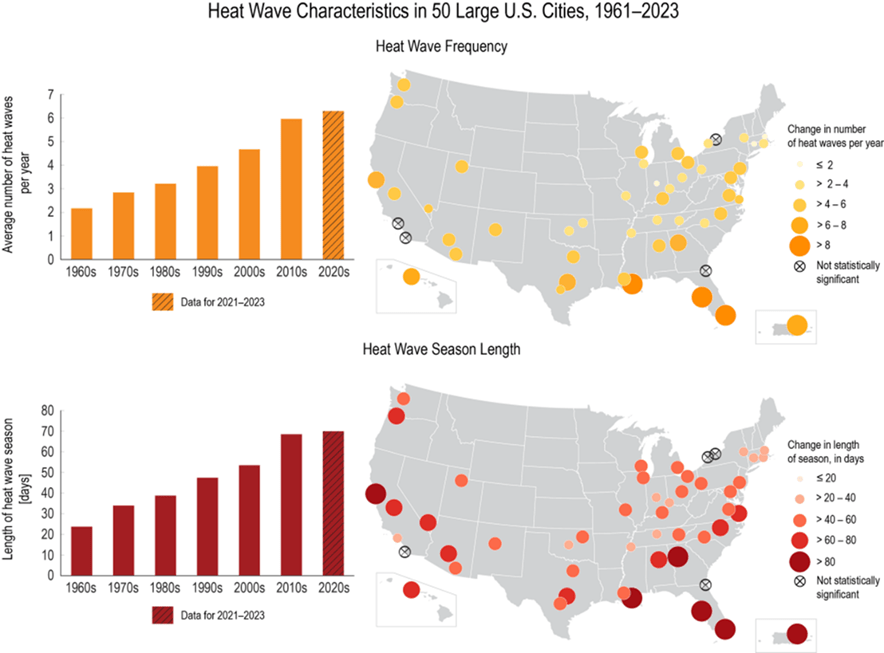
Our response: Heat waves have increased in the U.S. and around the globe since reliable temperature records have been available. The statement “domestic temperatures peaked in the 1930’s” is demonstrably untrue. Yes, the Dust Bowl caused temperatures in the contiguous U.S. states to go through a temporary peak in the 1930s. However, annual average temperatures for the contiguous states have shown a steady rise since 1980, as has also been the case globally10 (see Fig. 4). And peak temperatures are currently much higher than ever before in Alaska and high northern latitudes. In any case, the impacts of heat waves depend not only on the maximum temperatures reached but also on the frequency of heat waves and on the temporal and spatial extent of those high temperatures. Temperature records from 50 large U.S. cities11 shown in Fig. 5 indicate clearly that the frequency and average length of heat waves in the U.S. has nearly tripled since the 1960s. So to imply that heat waves have not changed in intensity and duration throughout many regions of the U.S. is disingenuous and contrary to weather records.

2) “Contrary to the Endangerment Finding’s assumptions, data continue to suggest that mortality risk from cold temperatures remains by far the greater threat to public health in the United States and around the world at the aggregate level.”
Our response: Heat waves produce one of most dangerous public health impacts of climate change in the U.S. and around the world.There is no question that intense cold weather can kill, especially those who are unhoused. However, this is a red herring. Cold spells are not increasing in frequency or length, unless in the future the Atlantic Meridional Overturning Circulation (part of the Gulf Stream) collapses12 as a result of global warming and melting of the Greenland Ice Sheet.
Many studies have confirmed the health risks of more severe heat waves and the related expected significant increase in mortality from heat waves versus the modest decrease in cold-related deaths.15 Additionally, heat waves don’t exist in isolation of other environmental factors that negatively impact human health; they are tied to worsened air quality as well as enhanced intense wildfires, which impact Americans and those around the globe.16
3) “…the data since 2009 suggest that the balance of climate change as a whole appears to skew substantially more than previously recognized by the EPA in the direction of net benefits.”
Our response: The dangers of not bringing global GHG emissions under control will have extensive harmful impacts that have been analyzed in detail in the IPCC 6th Assessment Report13 and in the Fifth U.S. National Climate Assessment.14 Possible benefits to agriculture are highly questionable, as we discuss further below.
4) “Recent data and analyses suggest, however, that despite increased public attention and concern, such extreme weather events have not demonstrably increased relative to historical highs…”
Our response: This misleading claim is based on Steven Koonin’s book Unsettled?, where he treats each type of extreme weather event in isolation and finds previous distinct historical periods where each type, in turn, also occurred with high frequency. A recent review9 of Koonin’s book put it this way: “But rather than point out noteworthy correlations among different aspects of climate data and impacts, Koonin takes a ‘divide-and-conquer’ approach, treating each such observation independently to advance his claim that there is nothing unusual in the behavior compared with previous historical episodes.”
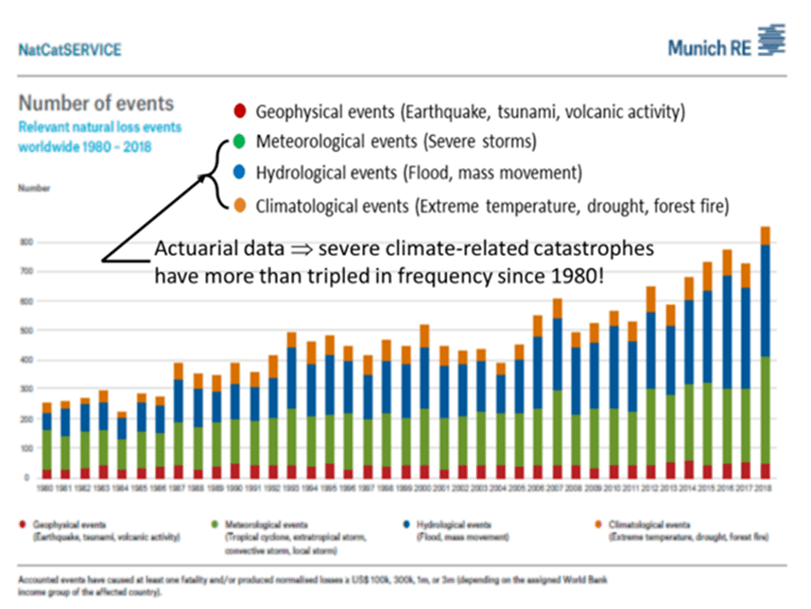
In fact, the statistics about natural disasters maintained17 since 1980 by the reinsurance giant Munich RE (see Fig. 6) show clearly that all severe climate-related catastrophes have tripled in frequency since 1980. Over the same time period, geophysical catastrophes have remained fairly constant in frequency, which demonstrates that the rapid increase in climate-related catastrophes is not simply a result of increasing costs to deal with the aftermaths of any disaster. Insurance companies are well aware of the actuarial statistics in Fig. 6. The Department of Treasury earlier this year released a comprehensive report18 showing that “homeowners insurance is becoming more costly and harder to procure for millions of Americans as the costs of climate-related events pose growing challenges to insurers and their customers alike.” Extreme weather events are a clear and present danger to public health and welfare and are only increasing in frequency and severity while we allow GHG emissions to stay at a high level.
5) “The lack of analysis of adaptation generally, and particularly with respect to sea level rise, reduces confidence in the reasonableness, accuracy, and reliability of the assumptions and conclusions in the Endangerment Finding.”
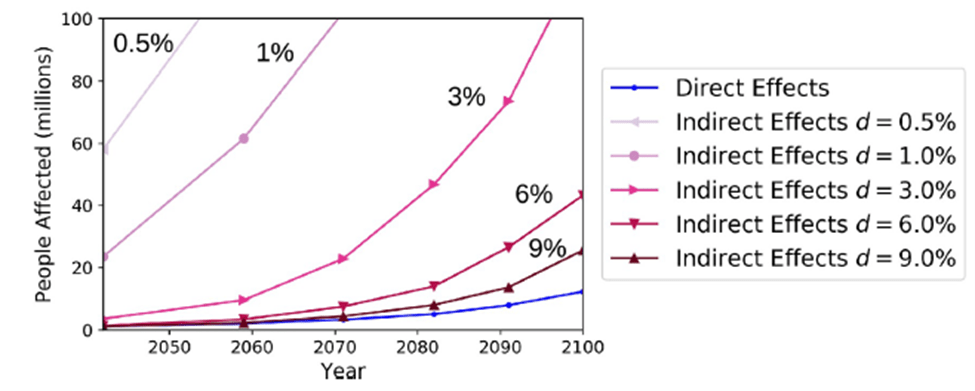
Our response: Adaptation to climate change will be needed in concert with efforts to greatly reduce GHG emissions. They do not mitigate the need for emissions control. On sea level specifically, global sea level rise is accelerating19 (see Fig. 7). An analysis20 of likely migration within the U.S. that will be necessitated by sea level rise by 2100 (Fig. 8), taking explicit account of where coastal topography allows successful adaptation, indicates that up to ten million inhabitants will be forced to relocate inland by sea level rise. Such adaptation will be extremely costly and place imposing burdens on the destination counties of such migrants, and it is not obviously preferable to shifting to electric vehicles.

6) “…the data used by the Endangerment Findings and predictions of coral decline has not been supported by empirical data showing an unexpected growth in coral reef ecosystems…”
Our response: It is true that many of the coral patches that have been reseeded for restoration or have been physically damaged (for example, by purposeful or accidental cutting) can undergo rapid growth spurts.21 And some coral species have been identified that seem to be resilient to what is considered adverse growth and health conditions for most other coral species.22 However, these resilient coral systems are the exception rather than the rule, and restoration efforts will need significantly more funding than is currently available to overcome the net devastating impacts of climate change on coral reefs and coral ecosystems.
Coral reefs and coral reef ecosystems worldwide remain at great risk, as covered by the 2023 University of Exeter Global Climate Tipping Points Report.23 In a 1998 bleaching episode, 20% of worldwide warm water reefs were impacted and 16% of global reefs were lost.24 From 2009 through 2018 another 14% of global reefs were lost. In more recent and more severe bleaching episodes more than 55% of remaining global reefs have been affected. Two scientific assessments25,26 of worldwide coral reefs carried out in 2024 have found that nearly half of the remaining coral species are currently facing extinction. Climate models suggest13 that at 2°C global temperature increase since the preindustrial era, nearly 100% of global reefs will be severely damaged. We are currently at 1.5°C and warming continues. 25% of all marine species depend on reef systems at some points during their life cycle.
7) “The Endangerment Finding attributes the entirety of adverse impacts from climate change to increased GHG concentrations, and it attributes virtually the entirety of increased GHG concentrations to anthropogenic emissions from all sources. But the causal role of anthropogenic emissions is not the exclusive source of these phenomena, and any projections and conclusions bearing on the issue should be appropriately discounted to reflect additional factors. Moreover, recent data and analyses suggest that attributing adverse impacts from climate change to anthropogenic emissions in a reliable manner is more difficult than previously believed and demand additional analysis of the role of natural factors and other anthropogenic factors such as urbanization and localized population growth.”
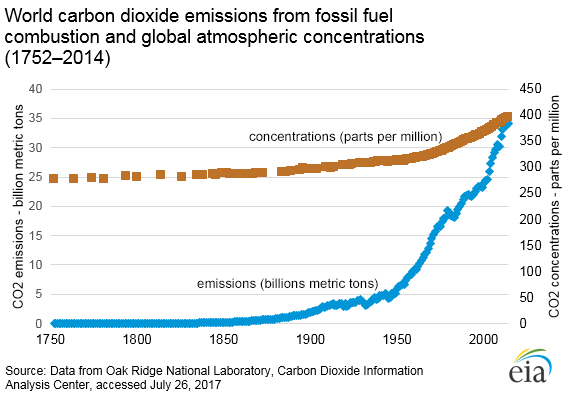
Our response: At this point in time, there can be no serious question that human burning of fossil fuels and GHG emissions are the dominant cause of ongoing global warming. Sophisticated climate models are completely unable to explain the warming without inclusion of GHG emissions. But one doesn’t need to rely on models to see the human role. The empirical data speak for themselves. Figure 9 shows that the rise since about 1850 in measured atmospheric carbon dioxide concentration tracks the rise in independently measured human carbon dioxide emissions.27 Human GHG emissions have upset the previous carbon cycle balance of Earth; the Earth cannot absorb all of the emissions, so much is retained by the atmosphere and oceans. Prior to the Industrial Revolution, GHG concentrations in the atmosphere had been essentially constant for the 10,000 years of human civilization.28
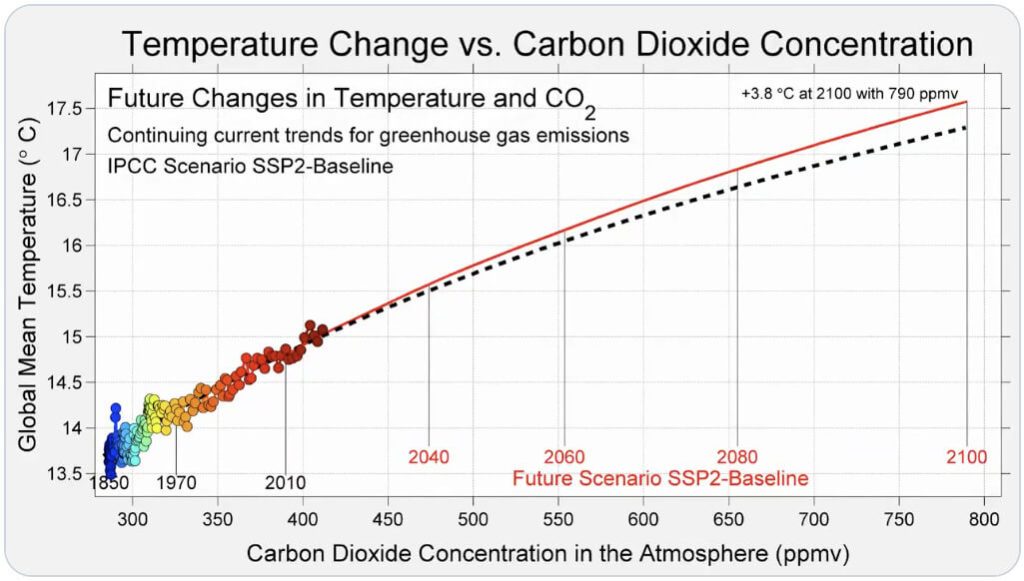
Figure 10 shows29 that the growth in measured global mean temperature has been completely correlated for about 150 years now with the independently measured growth in atmospheric CO2 concentration, which from Fig. 9 is completely caused by human emissions. Climate change deniers will often make the claim that correlation does not prove causation. But the more accurate version of that principle is that “correlation does not prove causation in the absence of a reliable theory that ties the cause to the effect.” In this case there is a reliable theory: GHG in the atmosphere absorb significant portions of the spectrum of infrared thermal radiation emitted by Earth and re-radiate a substantial fraction of that energy back to either the lower atmosphere or the surface of the Earth. One can clearly see the impact of GHG absorption in Fig. 11, which shows the spectrum of infrared radiation reaching Earth satellites,30 showing pronounced dips from the expected blackbody radiation curve (red curve in Fig. 11) corresponding to the known absorption ranges of each labeled GHG molecule.

Urbanization and localized population growth do not contribute significantly over and above their contribution to increased GHG emissions. The Berkeley Earth exhaustive analysis29 of temperature records from tens of thousands of measuring stations around the Earth has shown that, while absolute temperatures are typically higher in urban than in rural settings, the change in temperature over time is the same within uncertainties whether urban monitoring stations are included or excluded from the enormous dataset. Here is the summary from Berkeley Earth of their findings:
- “Urban areas can be substantially warmer than adjacent rural areas. Critics were concerned that the record might be biased and that the warming recorded was actually due to increased urbanization rather than climate change. The independent study excluded all urban areas and even rural areas near urban ones, resulting in a data set unbiased by the ‘urban heat island effect.’ When the independent study corrected for all these issues, it confirmed that the world has warmed 1.5°C or 2.8°F over the past 250 years.”
8) “Recent data and analysis show that even marginal increases in CO2 concentrations have substantial beneficial impacts on plant growth and agricultural productivity, and that this benefit has been significantly greater than previously believed.”
Our response: While plants need CO2 for growth, many studies show that raising CO2 concentrations too much has net negative effects on agricultural productivity. For example, a 2019 IPCC Special Report on Climate Change and Land31 notes that: “A recent meta-analysis shows that experimental CO2 enrichment generally results in lower nitrogen and phosphorus concentrations in plant tissues…reduced responses to elevated CO2…result from complex interactions of ecosystem factors that influence nitrogen acquisition by plants.” The Special Report concludes that: “There is high agreement and high evidence that increases in global mean temperature [which result from increased CO2 in the atmosphere] will result in continued increase in global vegetation loss, coastal degradation, as well as decreased crop yields in low latitudes, decreased food stability, decreased access to food and nutrition….”
Specifically, global climate modeling carried out in association with the IPCC assessments13 shows that the temperature increases accompanying growing GHG concentrations will lead (indeed, are already leading) to increased evaporation, decreased soil moisture, greater crop water demand, more erratic precipitation patterns and more extreme climate events, such as heat waves, floods and droughts. Those regions now suffering food and water scarcity are likely to be the most seriously affected. While U.S. agricultural productivity may not be harmed as severely as that in other areas of the globe, the CAA expressly considers negative international impacts of U.S. pollutant emissions.
9) “…the Endangerment Finding did not undertake individual analyses of these four GHGs and, in fact, aggregated them together along with two additional GHGs not emitted by motor vehicles or motor vehicle engines, thereby undermining the transparency, reliability, and usefulness of the findings. We propose that each of the collectively treated GHGs demonstrates different chemical properties, exhibits different interactions with the natural environment, and present different emissions profiles.”
Our response: Climate monitoring and climate modeling treat all GHGs in terms of CO2 equivalent emissions, taking into account the differences among the gases in infrared absorption, length of time remaining in the atmosphere, etc. Therefore, emissions can also be considered in terms of CO2 equivalent, an approach first developed in assessing ecosystem and human health impacts of toxic pollutants. In any case, the dominant impact from vehicles is in CO2 emissions, which typically run 4.6 metric tons emitted per year per passenger vehicle, and which typically account for 95-99% of total vehicle GHG emissions, according to the EPA itself.32 Emissions of methane, nitrous oxide, and hydrofluorocarbons from air conditioning leakage depend on engine, emission control system, and air conditioner design. They increase the total CO2 equivalent by somewhat more than their 1-5% share of emissions, because they have higher global warming potentials than CO2.
10) “Finally, the Administrator notes that the analyses relied upon in the Endangerment Finding, including the assessment reports of the IPCC and USGCRP that were available at the time and the subsequent iterations of those reports that have been published since 2009, have been criticized on process and quality grounds.”
Our response: Yes, they have been criticized by those groups trying to avoid dealing with climate change. In fact, the IPCC reports since 2009 have only increased confidence levels in both the human cause of global warming and most of the projected impacts of climate change. By the way, the 2025 Climate Working Group Report on which the EPA Administrator has relied solely for each of the above statements has received much more severe criticism33 from the majority of scientists actually working on climate issues. A comment34 written by more than 85 climate scientists called the 2025 Climate Working Group Report “a mockery of science,” finding it “biased, full of errors, and not fit to inform policymaking.” More than 700 international scientists contributed to the IPCC 6th Assessment Report13 and they analyzed more than 66,000 peer-reviewed research reports. More than 500 U.S. scientists contributed to the Fifth National Assessment Report.14 The five hand-picked authors of the 2025 Climate Working Group Report represent a tiny minority of researchers in the field.
11) “Based on this review of the Endangerment Finding and the most recently available scientific information, data, and studies, the Administrator proposes to find, in an exercise in discretionary judgment, that there is insufficient reliable information to retain the conclusion that GHG emissions from new motor vehicles and engines in the United States cause or contribute to endangerment to public health and welfare in the form of global climate change.”
Our response: The EPA Administrator has presented a series of qualitative half-truths without ever actually confronting hard, quantitative data that refute essentially every single point in this proposed scientific rationale. His only citations are to a report written by contrarians hand-picked by the Secretary of Energy to cast doubt on IPCC findings and the voluminous research literature about climate change. In fact, the vast majority of climate scientists and major international reviews of the subject show that the dangers of GHG emissions have only become clearer and the confidence in estimating those dangers stronger since 2009.
Here are excerpts from the headline statements in the IPCC 6th Assessment Report13 from 2023:
- “Human activities, principally through emissions of greenhouse gases, have unequivocally caused global warming…”
- Widespread and rapid changes in the atmosphere, ocean, cryosphere and biosphere have occurred. Human-caused climate change is already affecting many weather and climate extremes in every region across the globe. This has led to widespread adverse impacts and related losses and damages to nature and people (high confidence).
- Continued greenhouse gas emissions will lead to increasing global warming, with the best estimate of reaching 1.5°C in the near term in considered scenarios and modelled pathways. Every increment of global warming will intensify multiple and concurrent hazards (high confidence).
- For any given future warming level, many climate-related risks are higher than assessed in AR5 [2014], and projected long-term impacts are up to multiple times higher than currently observed (high confidence). Risks and projected adverse impacts and related losses and damages from climate change escalate with every increment of global warming (very high confidence).
- Limiting human-caused global warming requires net zero CO2 emissions. Cumulative carbon emissions until the time of reaching net-zero CO2 emissions and the level of greenhouse gas emission reductions this decade largely determine whether warming can be limited to 1.5°C or 2°C (high confidence).”
The Fifth National Climate Assessment14 also made clear that the U.S. specifically is at risk:
- “The effects of human-caused climate change are already far-reaching and worsening across every region of the United States….without deeper cuts in global net greenhouse gas emissions and accelerated adaptation efforts, severe climate risks to the United States will continue to grow.”
The Indiana Climate Change Impacts Assessment35 (INCCIA) carried out by Purdue University clarifies some of the projected climate change effects in our own state:
- “Indiana has already warmed 1.2°F since 1895. Temperatures are projected to rise about 5°F to 6°F by mid-century, with significantly more warming by century’s end.
- The number of extremely hot days will rise significantly in all areas of the state. In the past, southern Indiana averaged about seven of these days per year, but by mid-century this region is projected to experience 38 to 51 extremely hot days per year. Extreme heat raises the likelihood of heat-related illnesses, such as heat exhaustion and heat stroke, which can lead to increased hospitalizations and medical costs. Children and the elderly are especially vulnerable. Extreme heat also reduces crop yields, counteracting the benefits of a longer growing season.
- Average annual precipitation has increased 5.6 inches since 1895, and more rain is falling in heavy downpours. Winters and springs are likely to be much wetter by mid-century, while expected changes in summer and fall precipitation are less certain. Increased precipitation, especially in the form of heavy rain events, will increase flooding risks and pollute water as combined sewer systems overflow and fertilizers run off of farm fields.”
Various chapters of the INCCIA discuss the impacts these climatic changes are predicted to have on agriculture, recreation and tourism, public health, water quality and quantity, and ecosystems.
We repeat again the final conclusion of the SCOTUS ruling in Massachusetts v. EPA:
- “Under the clear terms of the Clean Air Act, EPA can avoid taking further action only if it determines that greenhouse gases do not contribute to climate change or if it provides some reasonable explanation as to why it cannot or will not exercise its discretion to determine whether they do.”
We find that the present proposal fails utterly to demonstrate that greenhouse gases do not contribute meaningfully to climate change. The scientific rationale offered in this proposal for rescinding the Endangerment Finding is shallow, sloppy, unsubstantiated, and ultimately unable to meet the legal standard laid out by SCOTUS.
In response to solicitation of comment C-12:
In the third major attempt at a rationale for rescinding the Endangerment Finding, the EPA now proposes “that there is no ‘requisite technology’ for emission control for light- and medium-duty vehicles because reducing GHG emissions from such vehicles to zero would not measurably impact GHG concentrations in the atmosphere or the rate of global climate change. Relatedly, we are proposing that there is no ‘requisite technology’ for emission control for heavy-duty vehicles and engines, even if considered in combination with light- and medium-duty vehicle standards.”
The basic argument made is that even if all U.S. vehicle GHG emissions were reduced to zero, that would only reduce global warming trends by about 3%. “Global warming trends from 1979 to 2023, the period with the best available data, were determined to a precision (or margin of error) of plus or minus 15 percent total (id.). An estimated 3 percent reduction in global warming trends is well below the scientific threshold for measurability and is not a reliable measure for regulatory purposes.”
This argument is ridiculous. Many countries have contributed to GHG emissions and to global warming and many countries will have to be involved in solving the problem. Suppose that 30 countries each reduced their own GHG emissions to effect a 3% reduction in global warming trends. Then humans would be well on their way to successfully mitigating climate change. But if each of those countries decides that a mere 3% reduction is not worth pursuing, as the EPA is doing here, then humans would have committed themselves to doing nothing to address the problem. Incremental efforts not only matter, but they are essential. SCOTUS made the same basic point in the Massachusetts ruling:
- “But EPA overstates its case. Its argument rests on the erroneous assumption that a small incremental step, because it is incremental, can never be attacked in a federal judicial forum. Yet accepting that premise would doom most challenges to regulatory action.”
The IPCC 6th Assessment Report makes the simple, but accurate statement that “every additional tonne of CO2 makes things worse.” U.S. vehicles are currently contributing 1.5 billion tonnes of CO2-equivalent every year. The U.S. should be focused on reducing its contribution to global GHG emissions. Light- and medium-duty vehicles account for about 16% of US total emissions. Reducing that to zero would be an enormous contribution to the U.S.’s part in addressing global climate change. In addition, action by the U.S. to reduce GHG emissions would encourage other countries to do the same; this could also contribute to a global effort to reduce emissions of greenhouse gases.
The EPA’s argument that the “requisite technology” doesn’t exist is unconvincing. Of course, electric vehicle (EV) technology is here and it can not only reduce overall GHG emissions, but also the noxious exhaust fumes from internal combustion engines. The EPA argues that a wholesale shift of U.S. vehicle fleets from internal combustion engines to EVs would run afoul of the “major questions” issue raised in the SCOTUS West Virginia ruling. However, it is the optimal solution to reducing GHG pollutants, as called for by both the CAA and more explicitly by the Inflation Reduction Act (IRA). Again, Congress chose to delegate the responsibility for such regulations to the EPA Administrator and it furthermore made that designation unambiguous in Title VI of the IRA, which allocated funding for moving toward zero-emission fleets; the EPA has not “claimed” this authority for itself. The IRA renders the “major questions” issue moot in this case. The U.S. is currently lagging far behind other industrialized countries in the EV share of new vehicle sales36 (see Fig. 12). Why should the EPA rule out demanding that U.S. vehicle manufacturers do better?

In response to solicitation of comment C-13:
The proposal goes on to suggest that regulating vehicle GHG emissions would harm public health and welfare. Here is the crux of their argument: “The EPA also proposes to repeal GHG emission regulations for new motor vehicle and motor vehicle engines because the resulting increase in price disincentivizes consumers from purchasing new vehicles and keeps less efficient vehicles on the road for longer.”
This argument is rather rich coming from an Administration that sees no harm in arbitrarily raising all U.S. vehicle prices, without any gain in emissions, by imposing tariffs on vehicles and vehicle parts from essentially every other country in the world. A recent economic study37 of the impact of 25% automobile tariffs concludes that: “Motor vehicle prices rise by 13.5% on average, the equivalent of an additional $6,400 to the price of an average new 2024 car.” In comparison, a September 2023 analysis38 by Cox Automotive (parent company of Kelley Blue Book) estimated that the average cost of a new EV was only $2,800 more than the average paid for a new gas-powered vehicle, after rapid declines in EV prices during the preceding year. Furthermore, ongoing battery research is likely to bring down the cost of EVs further in the future.
Increasing the share of EVs in new U.S. vehicle sales, as is being pursued aggressively in most other industrialized countries, will greatly reduce the impact of all emitted pollutants, not only GHGs. The argument that there would be net harm to health and welfare from increasing the EV share is totally unconvincing.
In Summary:
We urge rejection of all proposed rationales for rescinding the 2009 Endangerment Finding. The legal, scientific, and technical arguments made in the proposal are at odds with the clear language of the Clean Air Act and of the Inflation Reduction Act, the SCOTUS ruling in Massachusetts v. EPA, the vast majority of international global warming and climate change research, and the efforts being pursued in most other industrialized countries to reduce vehicular emissions of greenhouse gases.
References:
- Wikipedia, List of Countries by Greenhouse Gas Emissions per Capita, https://en.wikipedia.org/wiki/List_of_countries_by_greenhouse_gas_emissions_per_capita
- Wikimedia Commons, Variwide Chart of Greenhouse Gas Emissions per Capita by Country, https://commons.wikimedia.org/wiki/File:20210626_Variwide_chart_of_greenhouse_gas_emissions_per_capita_by_country.svg
- Congressional Budget Office, Emissions of Carbon Dioxide in the Transportation Sector, Dec. 2022, https://www.cbo.gov/publication/58861
- Velotric, Transportation is the Largest Source of Carbon Emissions in the US, June 14, 2023, https://www.velotricbike.com/blogs/story-landing/transportation-is-the-largest-source-of-carbon-emissions-in-the-us
- U.S. Supreme Court ruling in Massachusetts v. EPA, 549 U.S. 497 (2007), https://supreme.justia.com/cases/federal/us/549/497/
- Climate Working Group, A Critical Review of Impacts of Greenhouse Gas Emissions on the U.S. Climate, Report to U.S. Energy Secretary Christopher Wright, July 23, 2025, https://www.energy.gov/sites/default/files/2025-07/DOE_Critical_Review_of_Impacts_of_GHG_Emissions_on_the_US_Climate_July_2025.pdf
- CBS News, Environmental Groups Sue Trump Administration Over “Secret Report” by “Known Climate Contrarians”, Aug. 15, 2025, https://www.cbsnews.com/news/trump-administration-climate-report-lawsuit/
- T. Londergan and S. Vigdor, John Christy, Climate Change Denier, https://debunkingdenial.com/john-christy-climate-change-denier-part-i/
- S. Vigdor and T. Londergan, Debunked? A Review of Steven Koonin’s Book ‘Unsettled?’, https://debunkingdenial.com/debunked-a-review-of-steven-koonins-book-unsettled/
- United States Environmental Protection Agency, Climate Change Indicators in the United States, Fifth Edition, July 2024, https://www.epa.gov/system/files/documents/2024-09/climate_indicators_2024.pdf
- National Oceanic and Atmospheric Administration, Heat Wave Characteristics in 50 Large U.S. Cities, 1961-2021, https://www.climate.gov/media/16371
- W. Liu, et al., Overlooked Possibility of a Collapsed Atlantic Meridional Overturning Circulation in Warming Climate, Science Advances Vol. 3, Issue 1 (2017), https://www.science.org/doi/10.1126/sciadv.1601666
- Intergovernmental Panel on Climate Change, Sixth Assessment Report, August 2021, https://www.ipcc.ch/assessment-report/ar6/
- U.S. Global Change Research Program, Fifth National Climate Assessment, 2023, /view/noaa/61592/noaa_61592_DS1.pdf
- J. Goodell, The Heat Will Kill You First: Life and Death on a Scorched Planet (Little, Brown & Co., 2023), https://www.amazon.com/Heat-Will-Kill-You-First/dp/0316497576
- S.T. Seydi, et al., Increasing Global Human Exposure to Wildland Fires Despite Declining Burned Area, Science 389, Issue 6762, 826 (2025), https://www.science.org/doi/10.1126/science.adu6408
- Munich RE, NatCatSERVICE – The Natural Catastrophe Loss Database, https://www.munichre.com/en/solutions/for-industry-clients/natcatservice.html
- U.S. Department of the Treasury Press Release, U.S. Department of the Treasury Report: Homeowners Insurance Costs Rising, Availability Declining as Climate-Related Events Take Their Toll, Jan. 16, 2025, https://home.treasury.gov/news/press-releases/jy2791
- S. Dangendorf, et al., Persistent Acceleration in Global Sea-Level Rise Since the 1960s, Nature Climate Change 9, 705 (2019), https://www.nature.com/articles/s41558-019-0531-8
- C. Robinson, B. Dilkina, and J. Moreno-Cruz, Modeling Migration Patterns in the USA Under Sea Level Rise, PLoS One 15, e0227436 (2020), https://journals.plos.org/plosone/article?id=10.1371/journal.pone.0227436
- I.D. Lange, et al., Coral Restoration Can Drive Rapid Reef Carbonate Budget Recovery, Current Biology 34, 1341 (2024), https://www.cell.com/current-biology/fulltext/S0960-9822(24)00151-9
- S.G. Klein, et al., Deep Oxygen-Depleted Depressions in a Red Sea Coral Reef Sustain Resistant Ecosystems, PNAS Nexus 4, pgaf049 (2025), https://academic.oup.com/pnasnexus/article/4/3/pgaf049/8046449
- University of Exeter’s Global Systems Institute, Global Tipping Points Report 2023, https://global-tipping-points.org/
- S.B. Tebbett, S.R. Connolly, and D.R. Bellwood, Benthic Composition Changes on Coral Reefs at Global Scales, Nature Ecology and Evolution 7, 71 (2023), https://www.nature.com/articles/s41559-022-01937-2
- L. Gutierrez, et al., Half of Atlantic Reef-Building Corals at Elevated Risk of Extinction Due to Climate Change and Other Threats, PLoS One 19, e0309354 (2024), https://journals.plos.org/plosone/article?id=10.1371/journal.pone.0309354
- International Union for Conservation of Nature, More Than 47,000 Species are Threatened with Extinction (including 44% of reef corals), https://www.iucnredlist.org/
- U.S. Energy Information Administration, https://www.eia.gov/
- Berkeley Earth Project, 10,000 Years of Carbon Dioxide, https://berkeleyearth.org/dv/10000-years-of-carbon-dioxide/
- Berkeley Earth Project, Temperature Change vs. Carbon Dioxide Concentration, https://berkeleyearth.org/dv/temperature-change-vs-carbon-dioxide-concentration/
- G. Schmidt, Taking the Measure of the Greenhouse Effect, NASA Goddard Institute for Space Studies, 2010, https://www.giss.nasa.gov/research/briefs/archive/2010_schmidt_05/
- Intergovernmental Panel on Climate Change, Climate Change and Land, 2019 Special Report, https://www.ipcc.ch/srccl/
- United States Environmental Protection Agency, Greenhouse Gas Emissions from a Typical Passenger Vehicle, https://nepis.epa.gov/Exe/ZyPDF.cgi?Dockey=P100U8YT.pdf
- J. Tollefson, Outrage Over Trump Team’s Climate Report Spurs Researchers to Fight Back, Nature News, Aug. 7, 2025, https://www.nature.com/articles/d41586-025-02505-x ; Misleading U.S. Department of Energy Climate Report Chooses Bias Over Science, Climate Scientists Say, Science Feedback, Aug. 5, 2025, https://science.feedback.org/review/misleading-u-s-department-energy-climate-report-chooses-bias-over-science-climate-scientists-say/
- D. Peck and M. Glasser, Dozens of Scientists Push Back on ‘Fundamentally Flawed’ Department of Energy Climate Report, ABC News, Sept. 3, 2025, https://abcnews.go.com/US/dozens-scientists-push-back-fundamentally-flawed-department-energy/story?id=125211760
- Indiana Climate Change Impacts Assessment, Indiana’s Past & Future Climate, https://docs.lib.purdue.edu/cgi/viewcontent.cgi?article=1000&context=climatetr
- World Economic Forum, Chart: Which Countries Have the Most Electric Cars?, February 2021, https://www.weforum.org/stories/2021/02/electric-vehicles-europe-percentage-sales/
- Yale Budget Lab, The Fiscal, Economic, and Distributional Effects of 25% Auto Tariffs, March 28, 2025, https://budgetlab.yale.edu/research/fiscal-economic-and-distributional-effects-25-auto-tariffs
- C. Lindwall, Electric vs. Gas Cars: Is It Cheaper to Drive an EV?, Natural Resources Defense Council, July 21, 2025, https://www.nrdc.org/stories/electric-vs-gas-cars-it-cheaper-drive-ev
