
January 30, 2025
I. The Pernicious polarization of american politics
Politics has caused a rift in American society. As the ideological divergence between Republican and Democratic politicians has expanded rapidly in the 21st century, a majority of voters have chosen sides, joining one or the other political “tribes.” Members of opposing tribes may have some overlapping short-term economic interests, but distinct and mostly non-overlapping long-term fears and hopes for the country. At present they hardly interact with each other. They have their own news sources, their own facts, their own support groups, and even their own foreign adversaries. The polarization greatly complicates addressing common threats such as ongoing climate change or infectious disease pandemics.
Democratic politicians have, for the most part, followed Barack Obama’s lead in claiming aspirationally that the rift doesn’t exist: “there’s not a liberal America and a conservative America – there’s the United States of America,” Obama rousingly declared in his Keynote address to the 2004 Democratic Convention. Republicans, meanwhile, under Donald Trump’s leadership have exploited psychological differences between liberals and conservatives that we will explore in Section IV of this post. The Republicans appear to believe they can govern only for conservative America. The great majority of U.S. states are either red or blue, voting consistently in election after election for Republican or Democratic politicians, respectively. While the two sides are growing distant in beliefs, they are roughly equal in numbers of voters that are relevant within the constraints of the American Electoral College system. Hence, U.S. Presidential elections are now fought almost exclusively over the minority of uncommitted voters in six or seven “swing” states, whose votes cannot easily be predicted from recent history.
Public surveys reveal the extent of the polarization and Americans’ awareness of the polarization. Figure I.1 contains graphs that we showed previously in our post on The Increasing Partisan Divide in Trust in Science. The right-hand frame illustrates the growing divide in trust in science as determined from General Social Surveys carried out over years by the National Opinion Research Center affiliated with the University of Chicago. The left-hand frame illustrates ratings on a scale from 0 to 100 that Democratic voters and “leaners” and Republican voters and leaners have offered for the opposition party from 1976 to 2020 in surveys conducted by American National Election Studies. The 21st century has seen a rapid decline in these opposition party ratings: the ratings have fallen from 45-50% in the late 20th century to 20% or below for both Democrats and Republicans, while each group gives ratings between 70% and 80% to their own party.

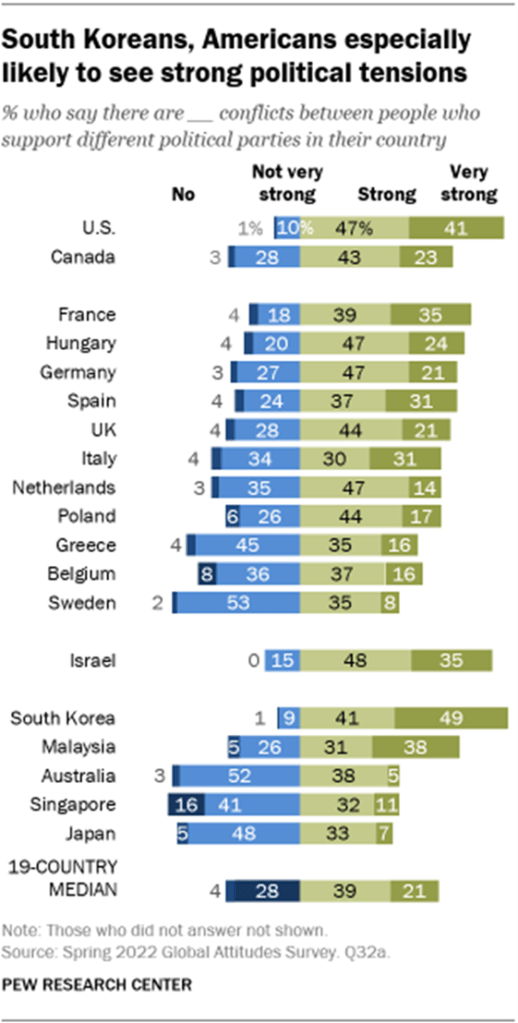
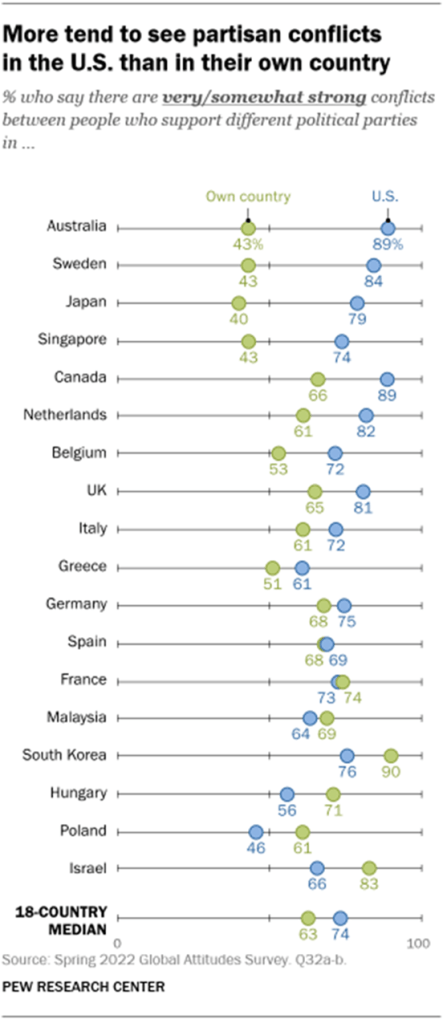
The U.S. is not alone in witnessing increasing partisan polarization in the 21st century, but as indicated by Figs. I.2 and I.3 from a 2022 Pew Research Center survey, the polarization in the U.S. is viewed by both Americans and residents of many other countries as being among the most severe worldwide, roughly matched only by South Korea and Israel, which both have hostile neighbors. 88% of Americans, 90% of South Koreans, and 83% of Israelis say that there are strong or very strong conflicts between people who support different political parties in their country. (Note that Israel is a multi-party democracy, so polarization is not merely an artifact of two-party systems.) For comparison, the comparable numbers for Canada, Sweden, and Japan are 66%, 43%, and 40%, respectively.
The U.S. appears to have reached the level of pernicious polarization, which has been defined by McCoy and Somer as “the division of society into mutually distrustful political camps in which political identity becomes a social identity.” The V-Dem (Varieties of Democracy) Institute studies the nature and evolution of democracies worldwide, aggregating a wide variety of expert assessments of many features of democracies over time. One of the many features they assess is the degree of political polarization in each country. Figure I.4 compares their rating of polarization in the U.S. from 1900 to 2023 with several other countries and regions. On their rating scale a value of 3 corresponds to pernicious polarization. The shaded bands surrounding the ratings reflect V-Dem’s assessment of the confidence range for their results.

The V-Dem ratings illustrate the alarming, steady rise in U.S. political polarization since the mid-1990s, when Rush Limbaugh’s radio show had attracted wide attention and Fox News was launched to spread an allegedly conservative gospel. The slope of the increase is especially concerning during the present century, when social media have been employed to widen the partisan gap. U.S. political polarization appears to have surpassed the pernicious stage during Donald Trump’s first Presidency, reaching levels seen previously in Southern Europe during the Spanish Civil War and Mussolini government in Italy during the 1930s and 1940s.
We have described some of the origins of American political polarization in other posts on this site, for example, here and here. But it is worth quoting McCoy and Somer who, from consideration of eleven case studies, conclude that pernicious polarization “is not attributable to any specific underlying social or political cleavage nor any particular institutional makeup. Instead, pernicious polarization arises when political entrepreneurs pursue their political objectives by using polarizing strategies, such as mobilizing voters with divisive, demonizing discourse and exploiting existing grievances, and opposing political elites then reciprocate with similarly polarizing tactics or fail to develop effective nonpolarizing responses.” And in the present age, those political entrepreneurs come with an entourage of media outlets dedicated to spreading divisive propaganda.
McCoy and Press have analyzed V-Dem datasets for the 20th and 21st centuries to evaluate the impact of pernicious polarization on the robustness of the democracies in which the polarization sets in. Their conclusions are not at all encouraging. “Severe polarization correlates with serious democratic decline: of the fifty-two instances where democracies reached pernicious levels of polarization, twenty-six—fully half of the cases—experienced a downgrading of their democratic rating [23 of the 26 descended into some form of authoritarianism]. Only sixteen episodes were able to reduce polarization to below-pernicious levels, and the decline in polarization was only sustained in nine of those cases. Quite strikingly, the United States is the only advanced Western democracy to have faced such intense polarization for such an extended period. The United States is in uncharted and very dangerous territory.” (Note that Spain and Italy during the pernicious polarization episodes of the 1930s and 1940s highlighted for Southern Europe in Fig. I.4 were not democracies.)
It is thus important to consider the question of whether current U.S. polarization is a temporary aberration or the start of a permanent trend. The central point of this post is that severe polarization that lasts through at least one generation yields significant demographic resistance to amelioration. The polarized “tribes” grow separated geographically, psychologically, socially, and even romantically. As we will show in the following sections from public attitude surveys and neuroscientific research, intermarriage between partisan tribes becomes very rare and parents pass their sociopolitical attitudes along to their children to a surprising degree. It will take enormous political will that we haven’t really seen yet to overcome such demographic persistence of political polarization.
It is worth noting from Fig. I.4 the rapid decline in polarization seen in Southern Europe from the early 1970s to 1980. Two significant events triggered this decline. In Spain their longtime fascist authoritarian leader Francisco Franco died in 1975 and the country adopted a new Constitution in 1978 establishing Spain as a parliamentary monarchy. The severe polarization in Italy in the early 1970s was characterized by “a surge of violence from far-right and far-left terrorist groups. Italy eventually depolarized as the major political parties agreed to jointly address the violence, law enforcement cracked down on terrorism, and public support for extremist movements faded. Italy has been repolarizing in recent years, however…” It may well take similarly dramatic events to get American political parties to agree to dial down the division in the hope of overcoming the demographic persistence of severe partisan polarization.
II. political intermarriage
Partisan intermarriage is now significantly rarer than racial or ethnic intermarriage in the U.S. According to a Pew Research Survey, the percentage of American newlyweds who married a spouse of different race or ethnicity rose from 3% in 1967 to 17% in 2015. For example, among 2015 newlyweds with at least a Bachelor’s degree, 30% of black men and 13% of black women intermarried. Among all U.S. marriages (not just newlyweds) in 2015, 10% were racial/ethnic intermarriages.
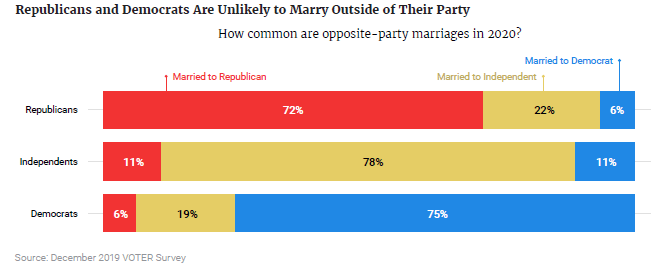
In contrast, the survey results shown in Fig. II.1 indicate that as of 2020 only 4% of U.S. marriages were between a Democratic voter and a Republican voter. Independents, who are far less polarized, are involved in another 17% of marriages that cross official party affiliation. An independent Electorate Research Survey of nearly 6,000 American voters carried out in late 2019 found roughly comparable results, showing 6% of marriages as opposite-party couples. Figures II.2 and II.3 from that VOTER survey provide some more detailed insight into breakdowns of voter marriages.

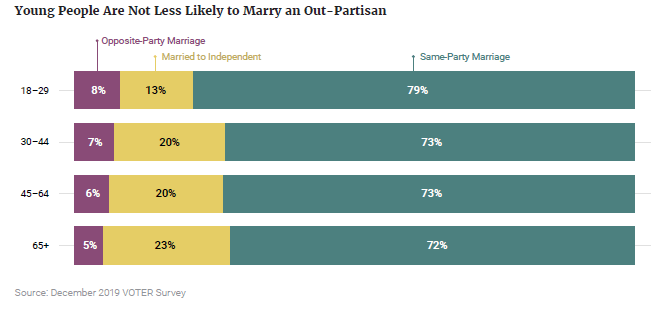
The probability of American voters engaging in opposite-party marriages is pretty much independent of voter age, as shown in Fig. II.3.
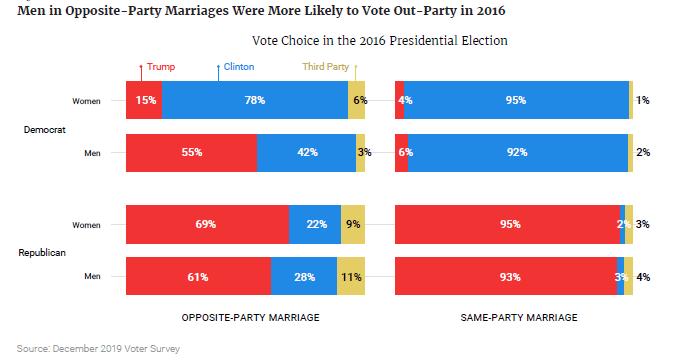
One of the interesting findings from the VOTER survey is that opposite-party marriages significantly affect voting preferences, making them considerably less polarized. This is illustrated in Fig. II.4 by the voting preferences expressed during the 2016 Presidential election between Donald Trump (Republican Party) and Hilary Clinton (Democratic Party). While well over 90% of same-party spouses voted for the candidate of their common party, 55% of men registered as Democrats but married to a Republican ended up voting for Trump, while 28% of Republican men in an opposite-party marriage voted for Clinton. Living with a voter of the opposite party does seem to moderate partisan polarization. As former New York City Mayor John Lindsay said, after disagreeing with his wife on a political issue, “Bedfellows make strange politics.”
While we don’t have good surveys of opposite- vs. same-party marriages from the mid-20th century, we do have Fig. II.5, highlighted in a 2012 article by David Graham in The Atlantic. It indicates an extensive change in Americans’ attitudes toward partisan intermarriage. In 1960 only about 5% of Americans would have been upset at their children marrying a spouse who votes for the opposite party. By 2010, that concern had grown to 50% for Republican voters and 35% for Democratic voters. Despite the increasing political polarization since 2010 the resistance does not seem to have grown any stronger: in a 2020 Economist/YouGov poll, 38% of both Republicans and Democrats said they would be either very or somewhat upset if their son or daughter married someone of the opposite political persuasion.

In 2023 an Atlantic article pointed out that “Dating apps and websites report a growing share of users setting political criteria for matches.” As wide partisan differences have arisen to gridlock political progress on issues critical to the planning of a family, such as abortion rights and climate change mitigation, the most popular dating apps have recently added features to satisfy user demand for assessing the political attitudes of potential dating partners. For example, Tinder added profile stickers to indicate the political issues important to users. OkCupid has added a dozen new questions that focus on voter behavior, including “Is it a deal breaker if your date is voting for a different candidate than you in the 2024 presidential election?” Young Americans who have grown up in an era of severe partisan divides are more interested than ever in “isolat[ing] ourselves from disagreeable points of views,” according to Casey Klofstad, a professor of political science at the University of Miami.
In short, pernicious political polarization suppresses inter-party marriage. And that, in turn, continues the polarization.
III. parental influence on children’s politics
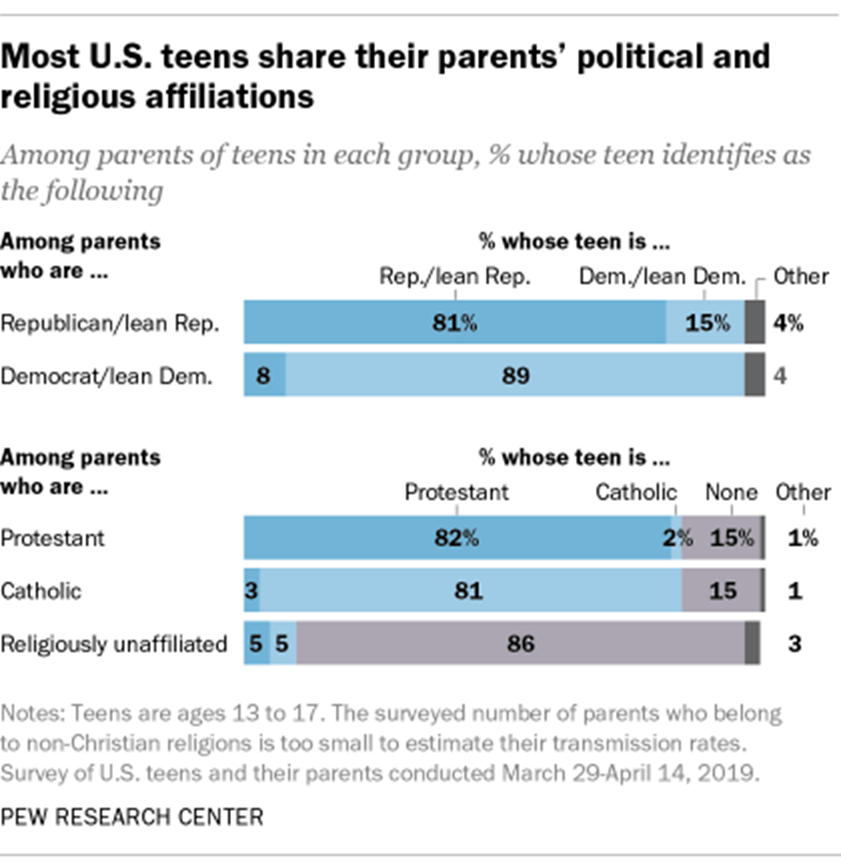
The second factor that favors continuing partisan polarization is that children generally share their parents’ political attitudes. Figure III.1 shows results from a 2019 Pew Research Center survey of political preferences among U.S. teenagers and their parents. Note that only about 8% of children raised in Democratic households would tend to vote Republican, while 15% of children raised in Republican households would tend to vote for Democrats. The retention of political attitudes by teenagers is roughly the same as their retention of their parents’ religious affiliation.
The Pew survey results in Fig. III.1 for teenagers’ retention of parental political orientation is consistent with similar survey findings. It leaves open two important questions: (a) To what extent does this retention persist into adulthood of the offspring? (b) To what extent does the retention manifest genetic similarity (nature) vs. impact of the environment established by the parents (nurture)? A 2021 article by Willoughby, et al. attempts to address both questions, though as yet in samples of modest size. A total of 394 families living around the Twin Cities area of Minnesota were surveyed for social, political, and religious attitudes. Both biological and adoptive families with at least one parent and two adult offspring (not necessarily still living in the childhood home) were sampled. Among the adoptive families, it was required that the children were adopted prior to turning two years old. The 370 adopted offspring and 310 biological offspring who responded to surveys averaged 31.8 years of age.
Both parents and offspring were asked to rate themselves on seven sociopolitical-attitude scales. One of these scales involved only a single question assessing overall political orientation on a scale of 1 (extremely conservative) to 5 (extremely liberal). The other six scales involved multiple questions, with examples indicated in Fig. III.2. An overall political composite score was computed for each individual based on their answers to the questions for the seven attitude scales. Higher composite scores represent more liberal attitudes and lower scores more conservative attitudes. In addition to those sociopolitical attitude assessments each participant responded to 16 questions from the International Cognitive Ability Resource (ICAR-16), which measures general intelligence. The ICAR-16 questions were included as a control for the subsequent analysis of responses, because “General intelligence is well known to be highly heritable and robust against cultural transmission, particularly in adulthood…”

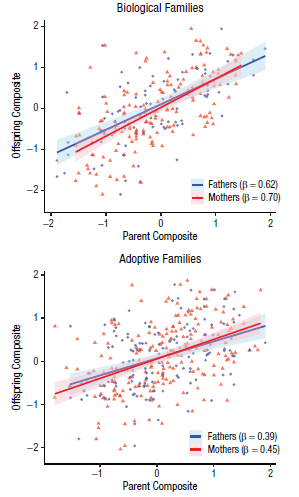
Figure III.3 shows the correlation found by Willoughby, et al. between parent and offspring composite scores on the sociopolitical attitude scales. There is a clear correlation for adoptive families and a significantly stronger one for biological families, suggesting that some of the parental influence is from the shared home environment (present for both types of families) and some from genetic inheritance (relevant only for biological families). Considering specific items among the seven sociopolitical attitude scales, “In both family types, the strongest parent-offspring relationships for individual phenotypes were found for social liberalism, religiousness, and egalitarianism, and the weakest were found for retribution.” Correlations were essentially identical for mothers and fathers and, indeed, very strong correlations were seen in attitudes between the two parents, consistent with the ample evidence that marriages tend to occur most frequently between couples with very similar sociopolitical inclinations.
The authors analyzed all the results from their survey in a model that allowed for parental influence through genetic, shared environment, and gene-environment correlation pathways, for sibling influence through sibling environment, and for an effect of non-shared environment that could be influenced by age, education level, and adult offspring’s family socioeconomic status. Gene-environment correlation effects refer to predispositions that are present in genetic makeup but are expressed or further enhanced by the environment provided by parents. For example, religious parents tend to enhance the genetic propensity for religiousness in their children by providing access to religious experiences. The authors indicate that “Evidence for correlations between genes and the family environment in our sample is substantial, particularly for religiousness, social liberalism, egalitarianism, and the political attitude composite.”
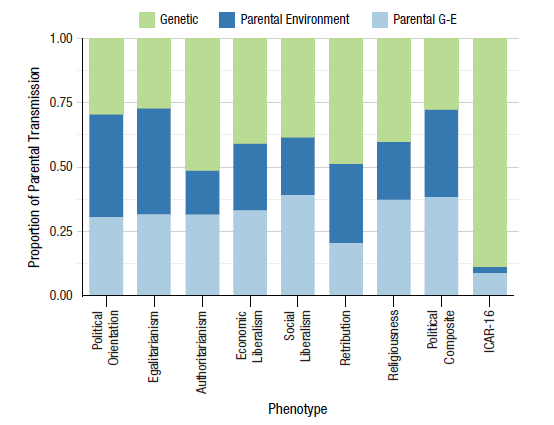
Willoughby, et al.’s analysis results for parental influence are shown in Fig. III.4. As expected, the parental influence on general intelligence, as measured by the ICAR-16 questions, is almost completely genetic, providing one crosscheck on the data and analysis. Parental influence on all of the sociopolitical attitude scales has substantial contributions from genetics, parental environment, and the gene-environment correlation, with the three pathways giving roughly equal contributions to political orientation and to the political composite attitude of offspring. On individual attitude scales, genetics appear to play the greatest role in authoritarianism and retribution.
It may seem surprising that genes can play such a significant role in political orientation, but there is actually a fair amount of supporting evidence for this conclusion. A major part of the evidence comes from studies of twins. The most comprehensive analysis was carried out by Hatemi, et al. in 2014, using data obtained over four decades from nine different studies carried out in five democracies, including more than 12,000 pairs of twins overall with ages ranging from 18 to 96. The samples include both identical (monozygotic) and fraternal (dizygotic) twins. Hatemi, et al. conclude “that genetic factors account for a significant amount of the variance in individual differences in ideology across time, location, measures and populations…The only exception is a question that explicitly uses the phrase ‘Left-Right.’”
The twins analysis relies primarily on the comparison of attitudes among identical twin pairs to non-identical pairs, where in both cases the twins have been reared together sharing the same family environment. The analysis models contributions to ideological differences arising from genetic influences, shared environment, and non-shared environment impacts. Results of the Hatemi, et al. analysis are shown in Fig. III.5. There is a substantial influence of both genetic and non-shared environment effects in nearly all of the analyses of individual studies. The combined results arise from an analysis in which all of the samples are lumped together as equivalent and involve much smaller uncertainties than any individual study. Overall, roughly 40% of ideological differences among twins arise from genetic influences, 20% from twins’ shared environment, and 40% from non-shared environment.
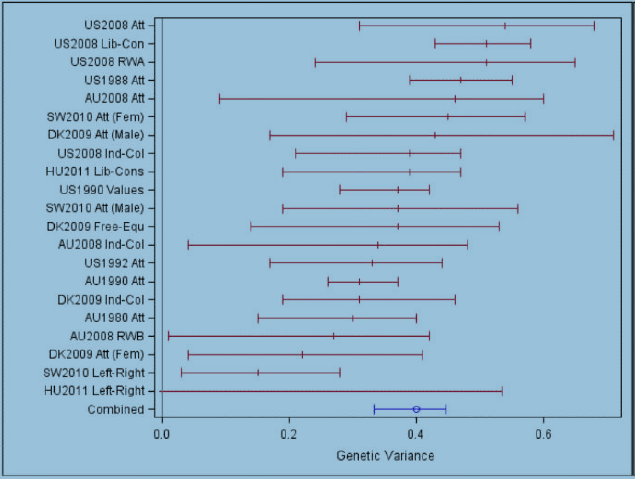

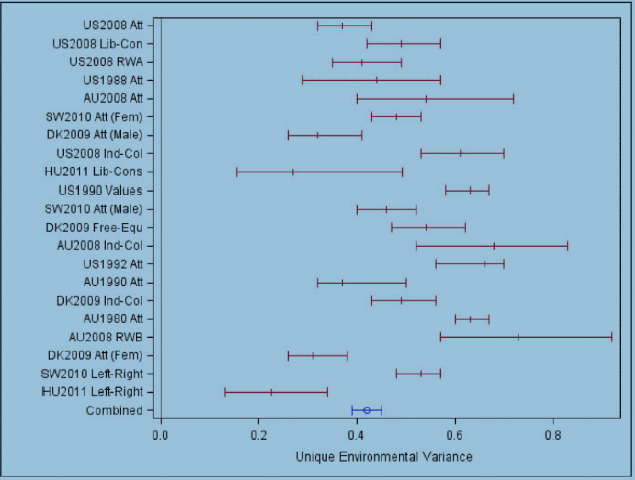
The only possible exception to the strong genetic influence is seen in Fig. III.5 in surveys in Sweden and Hungary which asked about Left vs Right differences, whereas questions about Liberal vs. Conservative differences show genetic influences consistent with all other results. Left vs. Right in these countries measures political party and voting preferences, as opposed to ideology, and may be interpreted by the survey respondents as representing affiliation with extreme parties in a multi-party system. Voting preferences seem far more influenced by environment than by genetics, especially in multi-party democracies.
A more recent analysis suggests that “political knowledge facilitates the expression of genetic predispositions in mass politics.” In particular, political scientists at Louisiana State University point out that “Estimates from the Minnesota Twin Study show that sociopolitical conservatism is extraordinarily heritable (74 percent) for the most informed fifth of the public — much more so than population-level results (57 percent) — but with much lower heritability (29 percent) for the public’s bottom half.”
The assignment of genetic influences on ideology remains a somewhat controversial conclusion because it is not yet supported by genomic analyses. There has to date been no genome-wide association study that has convincingly identified specific gene variants – i.e., political genes — that differ between liberals and conservatives. But a similar remark could be made about individuals’ antisocial behavior or susceptibility to cancer. As Hatemi, et al. put it: “Our findings are consistent with genome-wide explorations on almost any complex trait; a single gene or small group of genes does not directly influence ideological preferences. Rather, thousands of genetic variants of very small effects and constellations of genes interact with each other and the environment to influence behavior, indirectly.”
IV. brain and psychology differences between liberals and conservatives
While scientists haven’t yet identified clear genotypic differences between liberals and conservatives, neuroscientists have revealed subtle but important phenotypic differences in brain function and even structure. For example, Kanai, et al., in a paper entitled Political Orientations are Correlated with Brain Structure in Young Adults, report MRI scan measurements of brain volumes in a sample of 90 British university students who self-reported their political attitudes on a five-point scale from very liberal to very conservative. The authors “found that greater liberalism was associated with increased gray matter volume in the anterior cingulate cortex [ACC], whereas greater conservatism was associated with increased volume of the right amygdala.” Their results, with the relevant brain regions highlighted, are shown in Fig. IV.1. The correlations seen in the figure are subject to sizable uncertainties due to the limited sample, but they were reinforced by measurements on additional participants.

It is known from many functional MRI (fMRI) studies of human brains, where brain activity is monitored while subjects perform some designated task, that the amygdala is “centrally involved in physiological and behavioral responses to threat.” The ACC, on the other hand, is associated with conflict monitoring, i.e., the brain’s sorting of conflicting incoming information to decide on appropriate responses.
The ACC’s role and Kanai’s findings are supported by an independent psychological experiment carried out by Amodio, et al. These authors recorded behavior and neural activity for participants ranging from self-reported extremely liberal to extremely conservative political orientation as they performed a straightforward, non-political “Go/No-Go” task. As summarized by Jost and Amodio, in the experiment “participants must quickly respond to a frequently presented ‘Go’ stimulus (e.g., the letter ‘W’), so that the Go response becomes habitual. However, on a small proportion of trials, a ‘No–Go’ stimulus appears (e.g., the letter ‘M’), signaling that one’s habitual response should be withheld. Although the participant’s explicit goal is to withhold a response to this stimulus, the prepotent ‘Go’ response creates a response conflict.” Amodio, et al. found that liberals exhibited both greater accuracy in changing their response pattern, i.e., in resolving the conflict when needed, and greater ACC activity in electrical measurements of the participants’ brains.
Experiments such as these do not establish a causal relationship between brain structure or activity and political leaning. In other words, it is conceivable that larger or more active amygdalas lead to conservative ideology, or alternatively, that conservative ideology leads to more active amygdalas. However, Jost and Amodio use such experimental results as neuroscientific evidence in support of their model of political ideology as motivated social cognition. In particular, they argue “that there are two core, relatively enduring dimensions that separate left from right, or in the US, liberalism from conservatism: (a) advocating versus resisting social change (as opposed to tradition), and (b) rejecting versus accepting inequality…Individual preferences with respect to these two dimensions are theorized to emanate from basic psychological orientations toward uncertainty, threat, and conformity…’The common basis for all of the various components of the conservative attitude syndrome is a generalized susceptibility to experiencing threat or anxiety in the face of uncertainty.’”
Jost and Amodio’s view of the roots of conservative ideology is summarized in Fig. IV.2. In their view, the conservative’s resistance to change arises because “preserving the (inegalitarian) status quo allows one to maintain what is familiar and known while rejecting the risky, uncertain prospect of social change.” In this view, then, it makes sense that conservatives would exhibit a more active amygdala because the amygdala is central to the brain’s threat response. And there are strong evolutionary reasons for humans to have developed an advanced sensitivity to threats.

On the other hand, human’s historical ability to resist threats has been enhanced through coalitions with other groups and the formation of such collaborations requires the ability to resolve conflicts between fear of others and desire for their help, and to overcome resistance to change. There is thus also a clear evolutionary path to liberalism. The ACC is the brain region associated with such conflict resolution. In a meta-analysis of 88 psychological studies conducted in 12 countries between 1958 and 2002, Jost et al. found that “openness to new experiences, cognitive complexity, tolerance of uncertainty, and self-esteem were all positively associated with liberalism (or negatively associated with conservatism).” These psychological observations are consistent with liberals exhibiting a more active ACC and being better able to resolve conflicting stimuli and to change previously established habits.
The search for neuroscientific bases for political ideology differences is a young field and it is likely that more will be learned in the coming years. It is clear that human societies have evolved to thrive when both conservative sensitivities to threat and liberal openness to collaboration and equality are substantially represented. Pernicious polarization arises only when politicians and propagandistic media choose to exploit these basic psychological differences between conservatives and liberals to demonize one group for the other.
V. will america’s left-right balance be maintained in the future?
At the moment, despite the ideological polarization, the American public is roughly equally divided between those who support mostly liberal causes and those who prefer conservative attitudes, or what passes for conservative attitudes in Donald Trump’s Republican Party. The last time a President won even 55% of the popular vote was in Ronald Reagan’s second election in 1984. We’ve gone four decades now with Presidential elections determined in the margins, whether or not Donald Trump chooses to call such narrow victories landslides. The most dominant performance in the 21st century was in Barack Obama’s first election (2008), when he won 53% of the popular vote. But whether that rough numerical balance can be maintained in the midst of pernicious polarization depends on partisan differences in marriage, fertility, and death rates and in passing political preferences along to children.
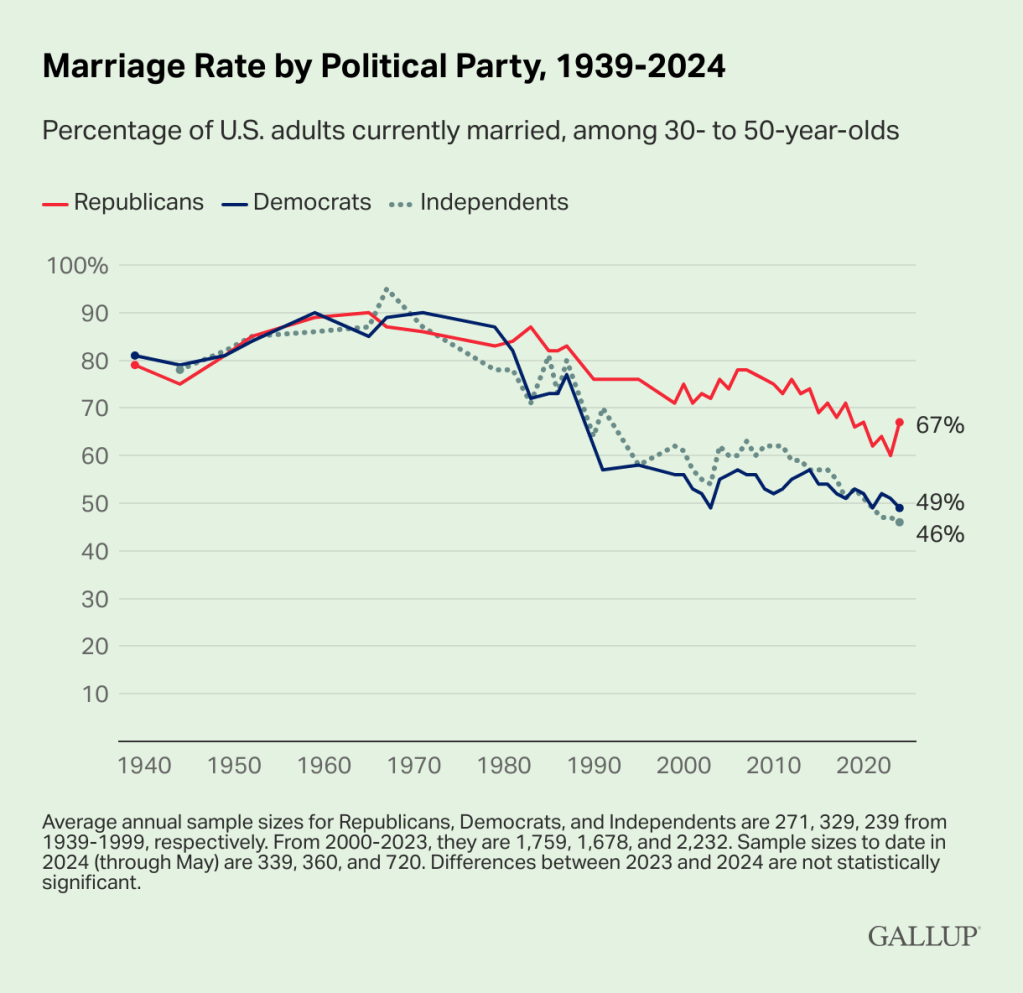
According to Gallup polls, U.S. Republican voters are significantly more likely to be married than are Democratic voters. As seen in Fig. V.1, marriage rates have dropped since 1980 for both groups, but they have declined more rapidly for Democrats and Independents than for Republicans. Part of this difference can be attributed to greater religiousness among Republican voters. But even for voters who don’t attend religious services regularly, the surveys suggest that Republicans hold traditional marriages and families in higher esteem today than do other Americans.
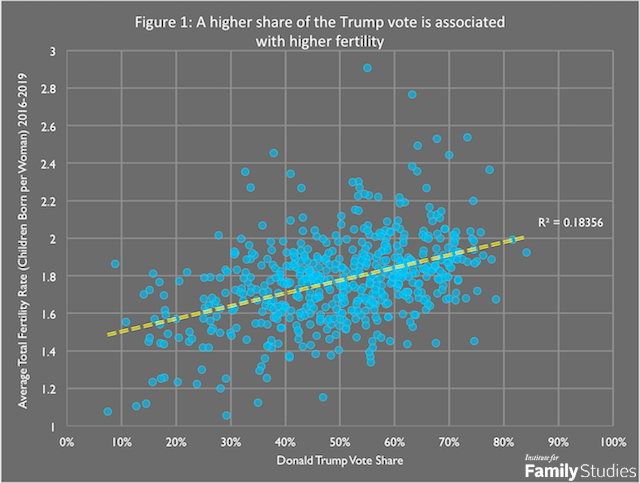
Although many children are born outside of traditional marriages, one might still expect that the higher marriage rate of Republicans would lead to a higher birth rate as well. There is evidence that this is true from statistics on fertility rates within U.S. counties as a function of the vote share those counties gave to Republican Donald Trump in the 2020 Presidential election (which Trump lost). Figure V.2 from the Institute for Family Studies indicates a clear correlation between average county fertility rate for the years 2016-19 and Trump 2020 vote share. Note that the overall U.S. average fertility rate for those years was only 1.8, well below the fertility replacement level of 2.1. Today that average fertility rate for the U.S. has dropped further to 1.7. We have previously discussed the data, causes, and impacts of this worldwide falling fertility rate in our post on the Ramifications of the Accelerating Worldwide Baby Bust.
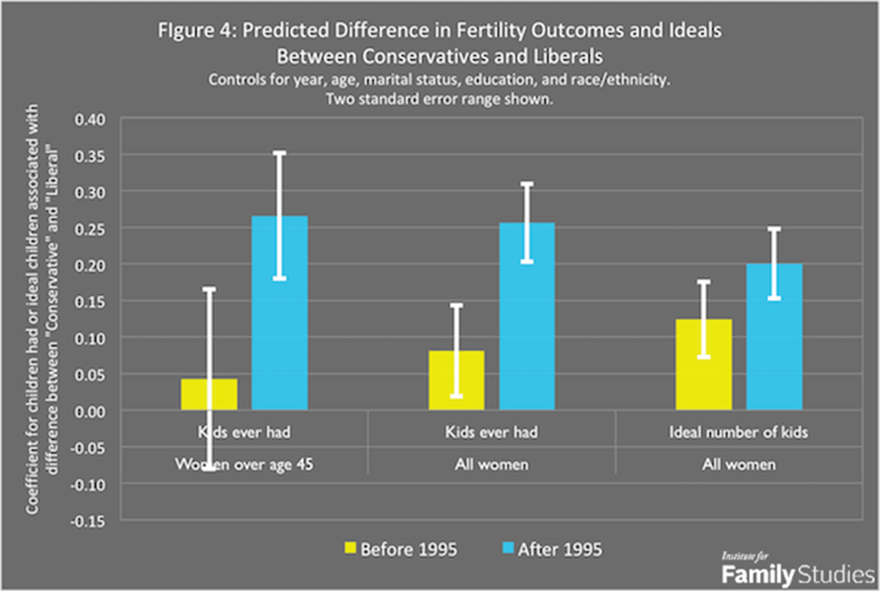
Indeed, data from the General Social Surveys allows extraction of differences in fertility rate between self-identified “conservatives” and “liberals” as a function of year. Figure V.3 shows the conservative-liberal difference in average fertility for the years 1972-94 in yellow and 1995-2018 in blue. The differences shown have been corrected for confounding variables such as differences in average age, marital status, education level, and race/ethnicity between the conservative and liberal samples in the surveys. In the 21st century, conservative women are, on average, giving birth to about 0.25 more children during their lifetimes than liberal women, assuming equal marital status between the two groups. When one takes into account the observation that conservative women are also more likely to be married, the fertility difference probably increases somewhat.
Why are conservative women having more babies than liberals in the 21st century? On average, they are more religious than liberal women, live in more rural locations where fertility is higher than in urban areas, are more supportive of traditional families in which wives bear and raise children, and today a large fraction of them live in states with highly restrictive abortion laws. American conservatives are indeed counting on precisely these tendencies to increase the share of conservatives in the American voting public in the next generation, or at least to hold their own as liberals may gain voters from immigration.
However, the difference in fertility rates is not that large and is probably compensated by the difference seen in Fig. III.1 between Republican and Democratic parental transmission of political orientation to their children. Taking U.S. average fertility rate now to be 1.7 and assuming, as per Fig. V.3 plus allowance for the higher marriage rate among Republicans, that conservative women have about 0.4 more children on average than liberal women, then let’s say Republicans have, on average, 1.9 children and Democrats have, on average, 1.5 children. According to Fig. III.1, children of Republican families lean Republican 81% of the time and lean Democratic 15% of the time. Republican families then produce 0.81 x 1.9 = 1.54 Republican children and 0.15 x 1.9 = 0.29 Democratic children. The children of Democratic families lean Democratic 89% of the time and lean Republican 8% of the time. Then, Democratic families produce 0.89 x 1.5 = 1.34 Democratic children and 0.08 x 1.5 = 0.12 Republican children. The combined result of Republican and Democratic families is 1.66 Republican-leaning children vs. 1.63 Democratic-leaning children. In other words, the difference in political attitude retention between Republican and Democratic families counterbalances the fertility difference.
Present trends then suggest that American children of the next generation will be rather balanced between Republican and Democratic, or conservative and liberal, orientation, even as the partisan divide in ideology and goals remains at least as wide as it is today. Conservative lawmakers in the U.S. are now heavily invested in counteracting what they see as liberal bias in American education, in the hopes that they can remove the current Democratic advantage in ideology retention among offspring.
But in terms of overall electorate share there is another important factor to take into account. The 21st century has seen a growing mortality gap between Republican and Democratic voters, as seen in Fig. V.4. Since the beginning of the century, mortality rates have decreased in counties that voted for Democrats by twice as much as those that voted Republican. Some of this substantial difference may be attributed to differences in individual lifestyles, for example, Democratic voters exercising more than Republican voters. But a large contributing factor is believed to be differences in health and wellness policies enacted in blue vs. red states. Examples are differences in Medicaid expansion under the Affordable Care Act, in smoking bans, in gun laws, and in environmental protections. Figure V.4 ends in 2019. The mortality gap only grew during the COVID-19 pandemic, when Republican counties had much lower COVID vaccination rates than Democratic counties.

We write this as Senate confirmation hearings for Robert F. Kennedy, Jr. as Secretary of Health and Human Services are under way. If RFK, Jr. is confirmed – a grievous error in the view of many scientists – the mortality gap may grow even faster as the receptivity to RFK-sponsored medical misinformation may be highest in Republican counties. The mortality gap may well become as important for future vote shares as the fertility gap.
VI. summary
Political polarization has increased rapidly in the U.S. during the 21st century as the ideological divide between Republican and Democratic lawmakers has expanded, interactions between their respective voter “tribes” have dwindled, and conservative and liberal media have promoted alternative versions of reality. Under the influence of cynical politicians, the polarization has recently reached the pernicious level, marked by “the division of society into mutually distrustful political camps in which political identity becomes a social identity.”
When such polarization lasts for a generation, demographic trends tend to maintain the polarization into the future. Partisans tend to marry only similarly oriented partisans. The offspring of such partnerships tend to keep their parents’ political orientation through a combination of genetic and environmental influences. In the U.S. these pressures may well lead to a permanent conservative class fixated on managing threats and recapturing past (inegalitarian) “glories” and a permanent liberal class focused instead on expanding rights and protections for all groups. The differences in focus arise fundamentally from neurological and psychological differences between conservatives and liberals.
The pernicious polarization endangers democratic institutions. If the country retains democratic elections in the future, continuing polarization may yield alternating-government-control stalemates that stymie compromise and progress toward either conservative or liberal goals. Republican families presently produce somewhat more offspring, on average, than Democratic families, but the Republican voters have somewhat less success in transmitting their political orientation to their children and have higher mortality rates. New immigrants may favor one group over the other. So the rough numerical balance between Republican and Democratic voters is likely to persist, even as their opinions of each other continue to suffer. Historical evidence from other democracies suggests that it may take highly dramatic events – war, widespread domestic violence, environmental catastrophes, or the death of polarizing leaders – to restore some ideological convergence and the interest in compromise.
references:
DebunkingDenial, The Increasing Partisan Divide in Trust in Science, https://debunkingdenial.com/the-increasing-partisan-divide-in-trust-in-science-part-i-public-attitudes/
National Opinion Research Center, The General Social Survey, https://www.norc.org/research/projects/gss.html
American National Election Studies, Affective Polarization of Parties, https://electionstudies.org/data-tools/anes-guide/anes-guide.html?chart=affective_polarization_parties
L. Silver, Most Across 19 Countries See Strong Partisan Conflicts in Their Society, Especially in South Korea and the U.S., Pew Research Center, Nov. 16, 2022, https://www.pewresearch.org/short-reads/2022/11/16/most-across-19-countries-see-strong-partisan-conflicts-in-their-society-especially-in-south-korea-and-the-u-s/
J. McCoy and B. Press, What Happens When Democracies Become Perniciously Polarized?, Carnegie Endowment for International Peace, Jan. 18, 2022, https://carnegieendowment.org/research/2022/01/what-happens-when-democracies-become-perniciously-polarized?lang=en
J. McCoy and M. Somer, Toward a Theory of Pernicious Polarization and How It Harms Democracies: Comparative Evidence and Possible Remedies, Annals of the American Academy of Political and Social Science 681, 234 (2019), https://journals.sagepub.com/doi/10.1177/0002716218818782
Varieties of Democracy, https://www.v-dem.net/
DebunkingDenial, Conservative Science Confronts and is Routed by Reality, https://debunkingdenial.com/conservative-alternative-science-confronts-and-is-routed-by-reality/
DebunkingDenial, Evaluating Electoral Reform Proposals, https://debunkingdenial.com/evaluating-electoral-reform-proposals-part-i-redistricting/
G. Livingston and A. Brown, Intermarriage in the U.S. 50 Years After Loving v. Virginia, Pew Research Center, May 2017, https://www.pewresearch.org/wp-content/uploads/sites/20/2017/05/Intermarriage-May-2017-Full-Report.pdf
W. Wang, Marriages Between Republicans and Democrats are Extremely Rare, Institute for Family Studies, Nov. 3, 2020, https://ifstudies.org/blog/marriages-between-democrats-and-republicans-are-extremely-rare
C.A. Fisk and B.L. Fraga, ‘Til Death Do Us Part(isanship), Democracy Fund Voter Study Group, August 2020, https://www.voterstudygroup.org/publication/til-death-do-us-partisanship
D.A. Graham, Really, Would You Let Your Daughter Marry a Democrat?, The Atlantic, Sept. 27, 2012, https://www.theatlantic.com/politics/archive/2012/09/really-would-you-let-your-daughter-marry-a-democrat/262959/
J. Ballard, How Republicans and Democrats Would Feel if Their Child Married Across the Political Aisle, YouGov, Sept. 17, 2020, https://today.yougov.com/politics/articles/32041-republicans-democrats-marriage-poll
L. Stone and B. Wilcox, Now Political Polarization Comes for Marriage Prospects, The Atlantic, June 11, 2023, https://www.theatlantic.com/ideas/archive/2023/06/us-marriage-rate-different-political-views/674358/
K. Iyer, Swiping Right Ahead of the Election: Popular Dating Apps Have New Features to Show Off Political Views, CNN, Oct. 17, 2024, https://www.cnn.com/2024/10/17/tech/dating-apps-politics-election/index.html
A. Cooperman, Most U.S. Parents Pass Along Their Religion and Politics to Their Children, Pew Research Center, May 10, 2023, https://www.pewresearch.org/short-reads/2023/05/10/most-us-parents-pass-along-their-religion-and-politics-to-their-children/
E.A. Willoughby, et al., Parent Contributions to the Development of Political Attitudes in Adoptive and Biological Families, Psychological Science 32, 2023 (2021), https://pmc.ncbi.nlm.nih.gov/articles/PMC8907492/pdf/10.1177_09567976211021844.pdf
P.K. Hatemi, et al., Genetic Influences on Political Ideologies: Twin Analyses of 19 Measures of Political Ideologies from Five Democracies and Genome-Wide Findings from Three Populations, Behavioral Genetics 44, 282 (2014), https://pmc.ncbi.nlm.nih.gov/articles/PMC4038932/pdf/nihms-570512.pdf
N.P. Kalmoe and M. Johnson, Genes, Ideology, and Sophistication, Journal of Experimental Political Science 9, 255 (2022), https://www.cambridge.org/core/journals/journal-of-experimental-political-science/article/abs/genes-ideology-and-sophistication/91C7C343BBA8801732F62E7D55B16676
T.B. Edsall, How Much Do Your Genes Shape Your Politics?, New York Times, June 1, 2022, https://www.nytimes.com/2022/06/01/opinion/politics-genetics-research.html
R. Kanai, T. Fielden, C. Firth, and G. Rees, Political Orientations are Correlated with Brain Structure in Young Adults, Current Biology 21, 677 (2011), https://pmc.ncbi.nlm.nih.gov/articles/PMC3092984/
J.T. Jost and D.M. Amodio, Political Ideology as Motivated Social Cognition: Behavioral and Neuroscientific Evidence, Motivation and Emotion 36, 55 (2012), https://link.springer.com/article/10.1007/s11031-011-9260-7
D.M. Amodio, J.T. Jost, S.L. Master, and C.M. Yee, Neurocognitive Correlates of Liberalism and Conservatism, Nature Neuroscience 10, 1246 (2007), https://www.nature.com/articles/nn1979
J.T. Jost, et al., Are Needs to Manage Uncertainty and Threat Associated with Political Conservatism or Ideological Extremity?, Personality and Social Psychology Bulletin 33, 989 (2007), https://pubmed.ncbi.nlm.nih.gov/17620621/
J.T. Jost, A.W. Kruglanski, J. Glaser, and S.J. Sulloway, Political Conservatism as Motivated Social Cognition, Psychological Bulletin 129, 339 (2003), https://gspp.berkeley.edu/assets/uploads/research/pdf/jost.glaser.political-conservatism-as-motivated-social-cog.pdf
J. Rothwell and F. Newport, When and Why Marriage Became Partisan, Gallup, July 11, 2024, https://news.gallup.com/poll/646793/why-marriage-became-partisan.aspx
L. Stone, The Conservative Fertility Advantage, Institute for Family Studies, Nov. 18, 2020, https://www.aei.org/articles/the-conservative-fertility-advantage/
DebunkingDenial, Ramifications of the Accelerating Worldwide Baby Bust, https://debunkingdenial.com/portfolio/ramifications-of-the-accelerating-worldwide-baby-bust/
L. Denworth, People in Republican Counties Have Higher Death Rates than Those in Democratic Counties, Scientific American, July 28, 2022, https://lydiadenworth.com/articles/republican-counties-have-higher-death-rates/
DebunkingDenial, Will RFK, Jr. “Make America Healthy Again?” Not on Your Life!, https://debunkingdenial.com/will-rfk-j-make-america-healthy-again-not-on-your-life/
