
February 26, 2024
I. introduction
One of the primary reasons Earth’s climate is so challenging to model is that it is strongly influenced by the interactions of two highly complex fluids, the atmosphere and the oceans that cover more than 70% of Earth’s surface area. The defining characteristic of any fluid is that it is free to flow. And the air above Earth and the water on it flow in intricate global patterns that feed off one another and that respond to variations around the globe in solar heating, atmospheric pressure, and water density. The flow patterns also reflect the fact that they occur with respect to an Earth that is continuously rotating about its central axis. In this post we will describe and explain the standard patterns of global ocean currents and how they affect local weather and global climate.
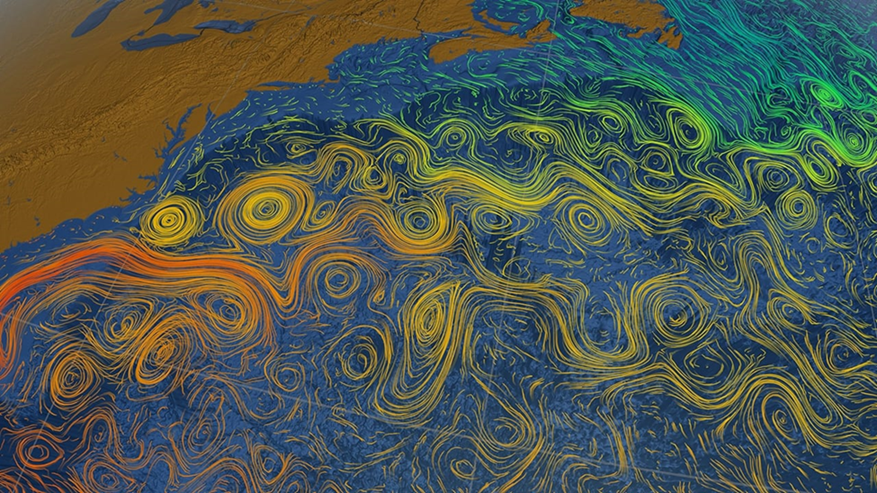
A hint of the complexity of ocean currents can be seen in the NASA image in Fig. I.1, which shows intricate circulating water flow patterns within the Gulf Stream along the northeast coast of North America. We will not be concerned in this post with the many small-scale eddy currents seen in that figure, but rather with large-scale global patterns, of which the overall Gulf Stream flow seen in Fig. I.1 is one part. There are two basic types of global ocean currents: surface currents that are driven largely by winds but also impacted by land boundaries; and vertical thermohaline current loops that are driven by global variations in water temperature (thermo) and the salt content (haline) of the oceans.
The causes of the basic standard patterns of the global ocean currents are reasonably well understood. But those patterns also change from time to time, causing significant changes in annual local weather patterns and occasionally in centuries-long global climate patterns. Among the short-term changes that we have heard about quite a bit over the past couple of decades are El Niño and La Niña oscillations in Pacific Ocean currents, which strongly affect local weather patterns in various regions of the globe. For two decades we have also heard serious concerns about an upcoming long-term change in the Atlantic Meridional Overturning Circulation (AMOC), a critical part of global thermohaline currents. Some very serious long-term climate changes in Earth’s past have been attributed to disruptions of the AMOC, and a 21st-century weakening, or perhaps even collapse, of that current may be a critical component of human-caused global climate change in the near future. Indeed, a commercial disaster film in 2004, The Day After Tomorrow, depicted possible catastrophic climate changes – super storms and a new Ice Age – that might follow such an AMOC collapse, as suggested by the movie poster in Fig. I.2. As we will see, real expectations are not as extreme as that movie suggested, but they are serious and merit understanding.

In section II of this post we will discuss the major wind currents on Earth and how they are affected by the Coriolis effect arising from Earth’s rotation. Section III will deal with the surface ocean current loops – called gyres – that are driven by those winds, and how Pacific Ocean gyres change during El Niño and La Niña events. Section IV will deal with the thermohaline currents that form a Global Conveyor Belt in Earth’s oceans, and with the AMOC in particular. Section V will deal with the role of the AMOC in past and future global climate changes. We will summarize the roles of the ocean currents in section VI.
II. wind patterns and the coriolis effect
Air pressure differences:
The normally dominant pattern of winds at Earth’s surface is illustrated in Fig. II.1. Various features of these complex air flow patterns require explanation.
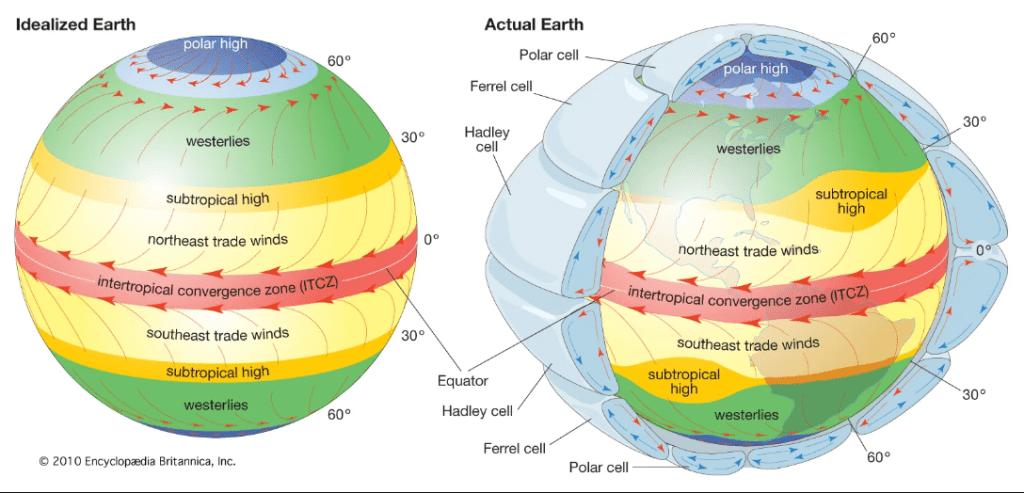
The atmosphere is dragged along with Earth as it undergoes its daily west-to-east rotation about its axis. This underlying motion, however, is not perceived by an observer on Earth, who is rotating along with the air that surrounds him or her. What the Earth observer does perceive are winds that respond to differences around the globe in solar heating and air pressure. Air near Earth’s surface is heated most by the Sun at the Equator. But hot air is less dense than cooler air, hence, hot air rises. The continual ascent of air from the surface at the Equator leaves behind a low-pressure zone at the surface near the Equator. But the continuous arrival of new warm air at altitude pushes the warm air already there away from the Equator, either to the north or the south. As that warm air originating at the Equator moves toward the poles, it cools and gradually descends.
As indicated by the vertical air flow circuits indicated within the blue “blanket” surrounding the Earth in Fig. II.1, that now cooled air returns to the surface around 30° of latitude in both the Northern and Southern Hemispheres. But it settles preferentially between Earth’s continents, hence, toward the east-west middles of Earth’s oceans. The inflow of now cooled air to these regions creates subtropical high-pressure blobs, two of which (in the North Atlantic and South Pacific Oceans) are shown in Fig. II.1. The oceans beneath these high-pressure regions tend to be relatively calm. The regions around 30°N and S have long been designated as the “Horse Latitudes.” One folk tale regarding the origin of this designation attributes it to Spanish ships that transported horses to colonies in the West Indies and the Americas: “Ships often became becalmed in mid-ocean in this latitude, thus severely prolonging the voyage; the resulting water shortages made it impossible for the crew to keep the horses alive, and they would throw the dead or dying animals overboard.”
The prevailing wind patterns at Earth’s surface are driven away from the high-pressure regions around the Horse Latitudes, either toward the Equator or toward the poles. An observer fixed in outer space would perceive these winds as blowing southward and northward. But the perceptions of an observer on Earth are complicated by Earth’s rotation and the Coriolis effect.
Coriolis Effect:
You have witnessed the Coriolis effect first-hand if you have ever stood on a rotating merry-go-round and tried to throw an object toward another passenger closer to or further from the center. Say you stood on the outer circumference of a merry-go-round rotating clockwise and you threw the object when you were momentarily at the northern edge. You try to throw the object (with no spin) toward the south, where the receiver is standing closer to the center of the merry-go-round. An observer on the ground sees the ball travel in a constant horizontal direction (ignoring air resistance), but not toward the south. This is because the object shared your momentary eastward velocity at the perimeter of the merry-go-round when you released it. So the observer on the ground sees the object travel toward the southeast.
But your view is more complicated from your rotating perspective. The person to whom you attempted to throw the object is also traveling eastward at the moment you release the object, but at a lower speed than you and the object have, because he has a shorter circumference to traverse in the same time as you complete one full turn of the merry-go-round. The object will thus not get to the receiver, because it has a greater eastward component of velocity than the receiver. As a result, it appears to you that the object’s trajectory curves away from the intended receiver. This apparent curvature, as viewed by a rotating observer, is the Coriolis effect.
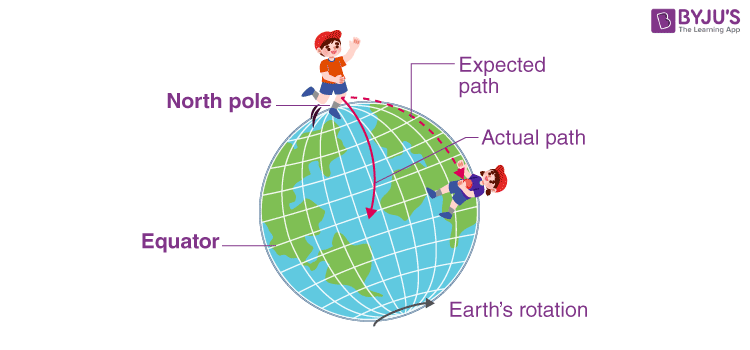
We can now project this discussion onto the surface of the Earth, where we are all rotating observers. Imagine first that the thrower is at the North Pole, where he doesn’t have any distance to traverse during Earth’s rotation, and the catcher is at the Equator, as in Fig. II.2. The object is thrown in the direction the thrower perceives at the moment he releases the object. But while it is in flight, the Earth rotates from west to east, and points along the Equator move eastward with maximal transverse velocity, so the object lands at a longitudinal location far to the west of the intended receiver. The thrower and receiver remark that the object curved rightward, compared to its intended direction, during its flight. The same is true, though to a smaller extent, if the thrower were positioned somewhere in Europe. A location in Europe is closer to the Earth’s rotation axis than a point on the Equator. Therefore, it completes a smaller circle, with smaller circumference, than the point on the Equator during the daily rotation. So a point in Europe is also moving eastward with the Earth’s rotation, but at substantially smaller transverse velocity than a point on the Equator. Hence, the object still lands to the west of the intended receiver.
If the object were thrown from the Equator toward Europe, it would start with greater eastward velocity than points at Europe’s latitude, and hence would land toward the east of the intended receiver. But that means it still appears to thrower and receiver to have curved rightward from its intended direction. In the Southern Hemisphere, the effect seems opposite. If the object is thrown from the South Pole or from Australia, it still lands to the west of the intended receiver at the Equator, but that means the observer sees the object curving leftward. If it’s thrown from the Equator towards Australia, it lands to the east of the intended receiver, again appearing to curve leftward. In summary the Coriolis effect makes objects traveling north or south near Earth’s surface appear to curve toward the right in the Northern Hemisphere and toward the left in the Southern Hemisphere, with respect to the originally intended direction of motion.
You may have heard physicists talk of a Coriolis force. This is not a real force exerted by one body on another. It is a fictitious force invented by rotating observers to “explain” what causes the Coriolis effect curvature they perceive. Newton’s Laws of Motion are intended to apply to observers who are not themselves accelerating. But a rotating observer is continuously accelerating. Thus, in order to apply Newton’s Laws in this rotating frame of reference, for which they were not intended, the observer must make up a force that doesn’t really exist.
The Coriolis effect curvature affects the air flow away from the subtropical high-pressure regions in Fig. II.1 the same way. Winds in the Northern Hemisphere curve rightward. Hence, the trade winds that blow from the Horse Latitudes toward the Equator appear to blow from the northeast toward the southwest. At higher latitudes, the air flow from the Horse Latitudes toward the Arctic, labeled as westerlies appear to flow from the southwest toward the northeast. In the Southern Hemisphere the curvature is leftward, as also seen in Fig. II.1.
As explained in the short video summarizing the Coriolis effect in Fig. II.3, it is the Coriolis effect that accounts for the opposite circulation of hurricanes and cyclones in the Northern vs. Southern Hemispheres. The storms are centered around a low-pressure “eye.” As air tries to move inward toward this low-pressure zone, it is continously deflected toward the right of inward in the Northern Hemisphere, resulting in a counterclockwise circulation about the eye of the storm. In the Southern Hemisphere, the air flow toward the eye is deflected toward the left of inward, resulting in a clockwise circulation. But keep in mind that these directions of circulation apply when the central region is one of low pressure. We will see next that ocean currents responding to the winds circulate in the opposite sense to air in hurricanes and cyclones.
III. Ocean gyres and el niño
Subtropical gyres:
The prevailing wind patterns seen in Fig. II.1 drive five major surface ocean current loops, called subtropical gyres, around the globe, as pictured in Fig. III.1. The five major subtropical gyres are found in the North and South Pacific, the North and South Atlantic, and the Indian Ocean. The trade winds force water to flow westward at latitudes below the Horse Latitudes, until the water runs into major land boundaries bordering the west side of each ocean. From there, the continuous inflow of warm water forces water at the western boundary away from the Equator, curving rightward in the Northern Hemisphere and leftward in the Southern Hemisphere.

The warm water flows away from the Equator in Fig. III.1 are aided by temperature variations in the ocean water. The water is warmest at the Equator and colder at both northern and southern latitudes. As we will discuss further in section IV, the density of water increases as the temperature drops toward the freezing point. Hence, the warm water flow away from the Equator tends to drive colder. denser water deeper as the warm water replaces it. The warm water flowing away from the Equator tends to warm the eastern coasts of Asia, Australia, North and South America, and Africa, giving them mild and damp climates. In contrast, the warm near-Equator waters that are driven by the trade winds away from the eastern boundaries of the oceans allow deeper cold waters to well up to the surface in their place.
When the water flowing away from the Equator flows past the Horse Latitudes, it becomes subjected to the westerly winds seen in Fig. II.1 and, hence, begins to flow toward the east in each gyre. When it reaches the eastern land boundaries of each ocean, the now cooler water that has upwelled continues its looping flow back toward the Equator, to complete the gyre. The currents returning toward the Equator then tend to cool the western coasts of North and South America, Africa, and Australia, giving them typically cool and dry climates.
Note that the gyre currents in Fig. III.1 circulate in opposite senses in the Northern and Southern Hemispheres, as expected from the Coriolis effect. But the sense of circulation is opposite that of hurricanes and cyclones. While hurricanes in the Northern Hemisphere circulate in a counterclockwise direction, the North Pacific and North Atlantic gyres circulate clockwise. The difference arises because in hurricanes the air outside the eye is trying to rush inward to the location of lowest pressure. In contrast, the gyres are driven by winds that are flowing outward from the mid-ocean high-pressure regions at the Horse Latitudes. The circulating gyres often deposit debris near the subtropical high-pressure regions in the middle of the oceans, where currents tend to be weak. For this reason, these regions of the oceans are sometimes referred to as “garbage patches.” Note furthermore that the subtropical gyres do not cross the Equator, where the Coriolis effect vanishes and winds are weak (hence, the designation “the doldrums”).
In addition to the subtropical gyres there are subpolar gyres that flow at latitudes higher than about 60° in both Northern and Southern Hemispheres. In contrast to the subtropical gyres, the subpolar gyres circulate around low-pressure regions. Hence, they circulate in the same sense as hurricanes and cyclones: counterclockwise in the Arctic region and clockwise in the Antarctic region, where the low-pressure zone – the so-called circumpolar trough — lies at the boundary between the Southern Ocean and Antarctica. In the Southern Hemisphere, the absence of land masses at such high latitudes makes the southern subpolar gyre into the Antarctic Circumpolar Current, which circles within the Southern Ocean in a clockwise sense around the entire continent of Antarctica. We will encounter this particular gyre again in section IV.
El Niño and La Niña:
The subtropical gyres as pictured in Fig. III.1 represent the “normal” surface currents in Earth’s major oceans. However, deviations from the normal occur, responding to and changing both weather, when the alterations are temporary, and climate, when the alterations are more long-term. The Indian Ocean gyre, for example, undergoes seasonal modifications, associated with the behavior of the Indian (or South Asian) Monsoon in summer vs. winter months. “The Intergovernmental Panel on Climate Change (IPCC) describes a monsoon as a tropical and subtropical seasonal reversal in both surface winds and associated precipitation, caused by differential heating between a continental-scale land mass and the adjacent ocean.” In particular, during the winter dry season in South Asia, the monsoon winds blow from the colder land (especially from the Himalaya Mountains) to the warmer ocean, and these monsoon winds reverse the northern part of the Indian Ocean gyre from its normal counterclockwise current sense shown in Fig. III.1.
A reversal of subtropical gyres that has global weather impacts, but especially strong impacts on North and South America, is El Niño. This is not a seasonal event, but rather one that occurs typically every two to seven years, triggered by conditions that are not completely understood. During an El Niño event, the easterly trade winds over the Pacific Ocean weaken and are sometimes replaced by westerly winds blowing from Asia toward the Americas, peaking typically between November and January. Such westerly winds force the warm waters that are normally built up in the western Pacific to flow toward the east, pushing deeper the upwelled cold, nutrient-rich waters that normally form the surface along the western coasts of North and South America. This major redistribution of ocean heat, in turn, affects the balance of atmospheric pressures, and hence the air flow paths, across the Pacific, as illustrated in Fig. III.2. Dry and relatively steady easterly trade winds are replaced by bursts of warmer, moister westerly air that only enhance the dominance of westerlies over the normal easterly trade winds. “Because of the vastness of the Pacific basin—covering one-third of the planet—these wind and humidity changes get transmitted around the world.”

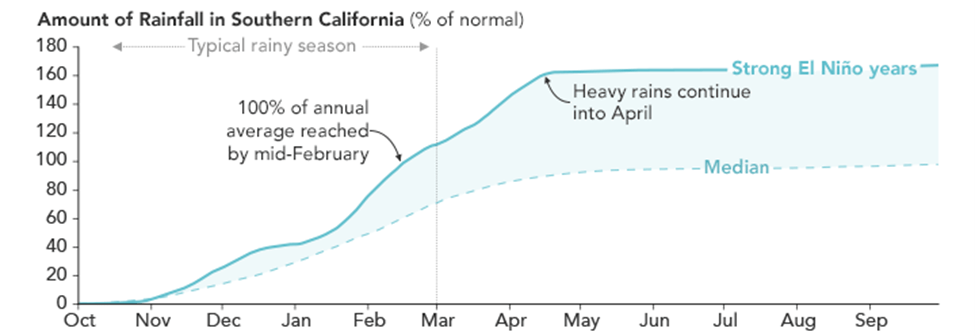
El Niño causes major disruptions to both weather patterns and fishing industries along the western coasts of the Americas. “Dry regions of Peru, Chile, Mexico, and the southwestern United States are often deluged with rain and snow, and barren deserts have been known to explode in flowers” (see Fig. III.3). During the current year’s El Niño Southern California, which has suffered through a number of previous years of extreme drought, has been lashed by heavy winds and rainfall produced by an “atmospheric river” coming from the Pacific. As shown in Fig. III.4, Southern California receives almost twice its normal amount of rain during El Niño years. In contrast, the Pacific Northwest tends to be warm and dry during El Niño years. Meanwhile, the submersion of normally upwelled cold water, and the nutrients it carries, reduces the amount of phytoplankton near the western coasts of South and North America, upsetting the ocean food chain and negatively impacting fishing off these coasts.

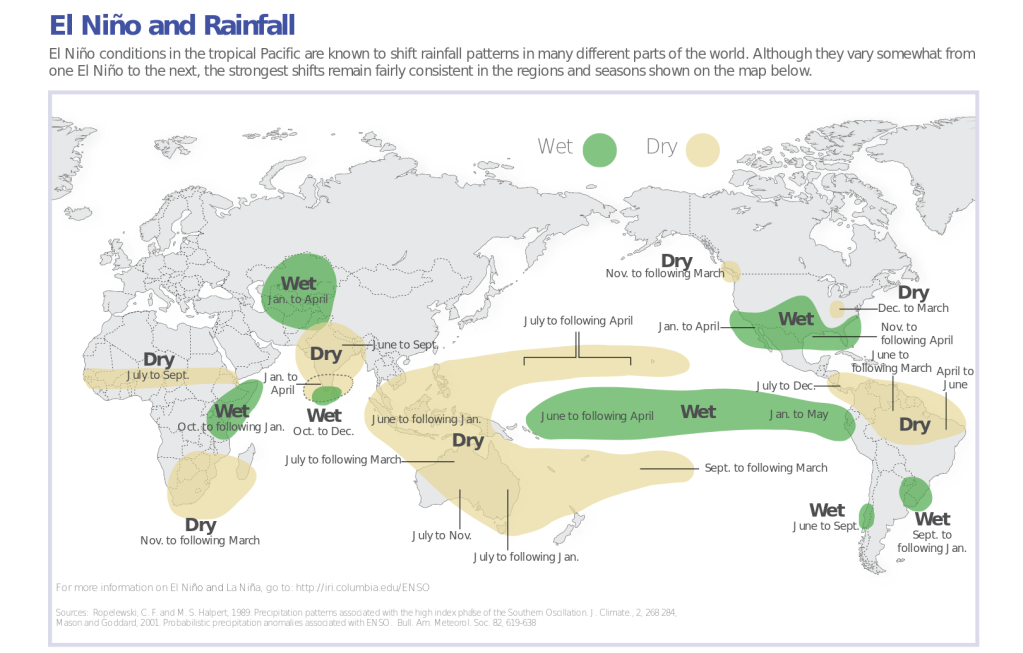
As explained in a NASA article, “While the impacts of an El Niño are predominately felt in the tropical Pacific, the massive reorganization of ocean heat, clouds, rainfall, and winds can affect weather patterns in other parts of the world.” The global impacts on rainfall are illustrated in the map of Fig. III.5. While the western coasts of the Americas see warmer, wetter weather, El Niño wind patterns bring drier weather to eastern lands on these continents. For example, normally “wetter regions of the Brazilian Amazon and the northeastern United States often plunge into months-long droughts.” El Niño has also led to a drying and weakening of the South Asian Monsoon, leading in turn to droughts and forest fires in Indonesia.
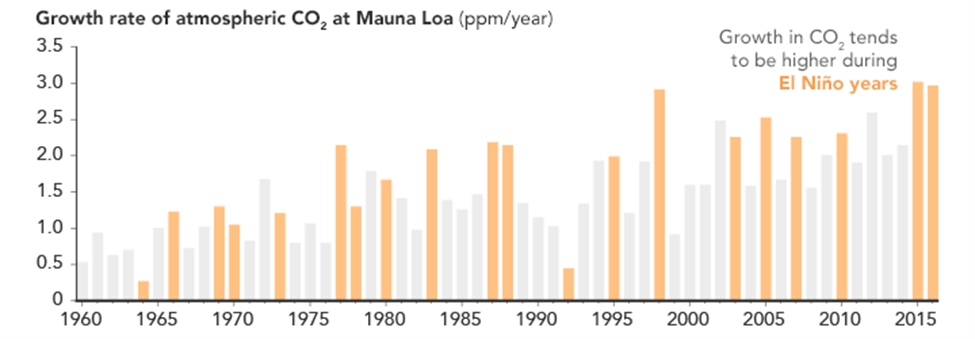
While El Niño is not itself caused by human burning of fossil fuels – its existence has been noted historically long before anthropogenic global warming was a concern — the global weather changes it brings tend to enhance impacts of human-caused global warming. For example, “major El Niño events—such as 1972-73, 1982-83, 1997-98, and 2015-16—have provoked some of the great floods, droughts, forest fires, and coral bleaching events of the past half-century.” Such enhancements are illustrated in the next two figures, which show that annual global temperature anomalies (Fig. III.6), while growing steadily from fossil-fuel burning, peak in El Niño years, as do increases in atmospheric carbon dioxide concentrations (Fig. III.7), as the warmer Pacific waters release more CO2 to the atmosphere.

In between El Niño years, the easterly trade winds once again dominate Pacific Ocean currents. But occasionally, in years characterized by La Niña events, those trade winds become even stronger than normal, reversing El Niño effects on global weather. La Niña brings even more warm water than normal for the North Pacific gyre toward the eastern coast of Asia, while causing greater than normal upwelling of cold, nutrient-rich waters off the western coasts of the Americas. The associated changes in wind patterns “lead to drought in the southern U.S. and heavy rains and flooding in the Pacific Northwest and Canada. During a La Niña year, winter temperatures are warmer than normal in the South and cooler than normal in the North. La Niña can also lead to a more severe hurricane season.”
El Niño and La Niña are temporary events. They normally last for one year or occasionally for two. Their impacts on global weather patterns are reversible. Thus, they do not alter long-term climate trends. But we turn our attention now to the thermohaline ocean currents, which are fully capable of altering long-term climate if their strength changes dramatically.
IV. thermohaline currents
Superimposed on the wind-driven surface currents we have described so far is a Global Conveyor Belt of vertical ocean currents driven by changes in water density. The density of water depends on both its temperature and its salt content, as illustrated in Fig. IV.1. The vertical currents are therefore known as thermohaline currents, because they are driven by changes in water temperature (thermo-) and salinity (haline). The water density in the graph of Fig. IV.1 increases steadily from the lower right corner to the upper left, as the color changes from blue to red-orange. The density is labeled on some contours in units of kilograms per cubic meter. In these units the nominal density of water at room temperature and atmospheric pressure is usually taken to be 1000 kg/m3. The graph shows that water density increases as the temperature drops toward the freezing point and also as the salinity increases. The average salinity of Earth’s oceans is 3.5% or 35 grams of salt per kilogram of water, in the units used in the figure.

But the salinity of sea water is not constant around the globe. There are a couple of natural processes that can increase its salinity, for example, changes of water’s chemical phase. When warm water evaporates it is only the H2O content that changes to gaseous form; the salt is left behind, so that the salinity of the water left behind increases. This is why, for example, the Dead Sea on the border between Israel and Jordan has such enormous salinity, 34%, well above the scale of Fig. IV.1, which goes only up to 10%. A person can float in water if the person’s average density is less than that of the water. Thus, in the salty, dense Dead Sea, people float with a significant fraction of their bodies lying above the water surface (see Fig. IV.2).

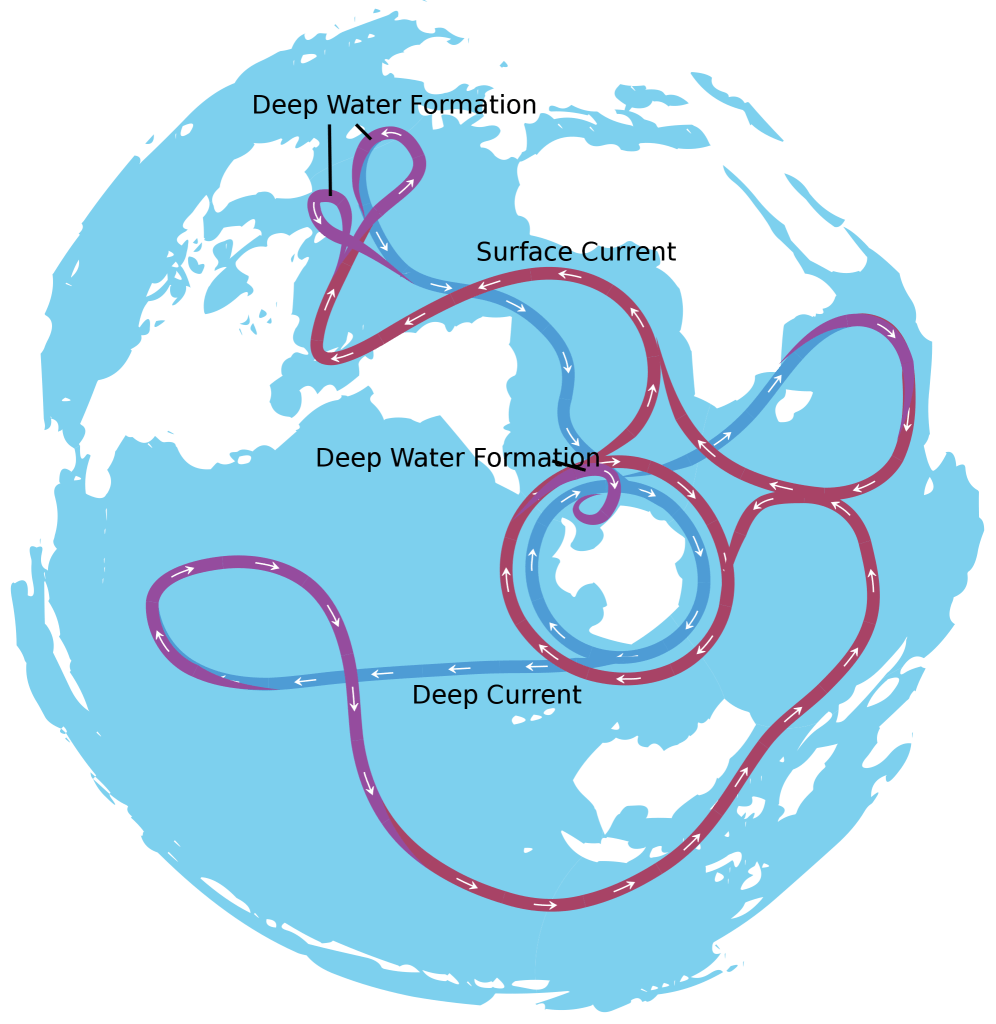
The other natural process that increases sea water’s salinity is ice formation. Just as in the case of evaporation, it is only the H2O content of the water that freezes, leaving behind water of increased salinity. Cold, salty water tends to sink because it has higher density than warm water of lower salt content, and it is that sinking which sets in motion the vertical ocean currents that drive the Global Conveyor Belt. There are two locations on the Global Conveyor Belt pictured in Fig. IV.3 where the water is especially cold and salty and, hence, driven deeper within the ocean: around Antarctica and in the North Atlantic in the vicinity of Greenland and Iceland.
When the cold, salty water sinks, warmer water flows in along the ocean surface to take its place. The source of much of the warmer water is Earth’s Southern Ocean between Antarctica and the southernmost reaches of land on the other Southern Hemisphere continents. The water in the Southern Ocean tends to be warmer than in the North Atlantic for a couple of reasons. The first reason is that Earth’s orbit around the Sun is not perfectly circular, but rather is slightly eccentric. At our current stage in Earth’s orbit change and axis tilt cycles – cycles with periods of several tens of thousands to a hundred thousand years — the closest approach of Earth to the Sun occurs during the Southern Hemisphere summer. Hence, the Southern Ocean is more strongly heated by solar radiation in its summer than is the North Atlantic in the Northern Hemisphere summer.
The second reason that the Southern Ocean waters are warmer, on average, is because there’s much less land around. Water has a much higher heat capacity than land. That means that water temperature changes less than land temperature for a given quantity of heat added or subtracted. This is the reason, for example, that the heat that’s been added to Earth’s surface by infrared radiation returned to Earth from greenhouse gas molecules in the atmosphere is retained mostly in the oceans: the oceans occupy about 71% of Earth’s surface area, but they retain more than 90% of the excess heat from global warming, and the Southern Ocean plays a major role in storing that excess heat. The Southern Ocean retains its warmth better than the North Atlantic because it loses less heat to land masses in contact with it.
Earth’s thermohaline currents thus involve warm surface currents flowing from the Southern Ocean to replace sinking, cold, salty water. Within the Southern Ocean the warm surface current forms the Antarctic Circumpolar Current flowing in a clockwise sense all around Antarctica. When those warm waters reach Antarctica or northern seas, they in turn grow cold and salty and sink. Meanwhile, the submerged cold waters flow at depth, eventually to upwell to replace warm surface waters that have departed. The entire, complex network of thermohaline currents that has been mapped out is shown in a global view in Fig. IV.3. As opposed to the surface currents in gyres, the thermohaline currents typically involve much slower flows: the time period needed for a molecule of water to complete a full circuit along a portion of the Global Conveyor Belt is about a thousand years!
The portion of this Global Conveyor Belt that flows along the surface from the Southern Ocean through the South and North Atlantic, and then returns southward as cold, salty water at a depth of some 1500 meters below sea level, is called the Atlantic Meridional Overturning Circulation (AMOC). It is a current that affects a great deal of global climate, that appears to have weakened substantially at various periods during the history of homo sapiens on Earth, and which appears poised once again to weaken as a result of human-caused global warming. Because the cycle time within the AMOC is so long, its changes and their effects tend to be long-lasting, affecting long-term climate rather than just temporary weather patterns. The Gulf Stream that flows from the Caribbean Sea along the eastern coast of North America and toward northern Europe is sometimes referred to as a part of the AMOC. More strictly, however, as we will discuss further in the next section, the Gulf Stream has contributions both from the AMOC and from the North Atlantic subtropical gyre.
V. Role of the AMOC in past and future climate changes
Past climate changes:
Just as ice formation tends to increase the salinity of the remaining ocean water, the melting of glaciers and ice sheets adds large quantities of fresh water and decreases the ocean’s salinity. Such melting thus disrupts the sinking of cold, salty water that is central to the thermohaline currents. This is believed to have happened during a stage, known as the Younger Dryas (YD), when the globe’s warming paused during the deglaciation period following the end of the last Ice Age. The global impact of the Younger Dryas can be seen in Fig. V.1, which tracks Antarctic and global mean temperatures during a dozen millennia following the last glacial maximum (LGM) about 21 thousand years ago. The Antarctic temperatures are inferred from oxygen isotope ratios as a function of depth in Antarctic ice cores, while the global temperatures are reconstructed from proxies such as isotope ratios in deep ocean sediments and Greenland ice sheet cores.

The warming that began about 18,000 years ago was first triggered by changes in Earth’s orbit and axis tilt. The Antarctic data in Fig. V.1 suggest that the warming began in the Southern Hemisphere. Carbon dioxide released to the atmosphere from the warming Southern Ocean provided positive greenhouse gas feedback to enhance the warming. But global warming (blue curve in Fig. V.1) lagged that in the south by about one millennium. Presumably, this time lag reflects the fact that Southern and Northern Hemisphere atmospheres don’t mix much, since the prevailing winds in Fig. II.1 don’t cross the Equator. Thus, the enhanced CO2 content in the south would have made it to the north by the slower process of diffusion. In addition, the increased warmth of the Southern Ocean would have been transported to the North Atlantic by the AMOC, with its thousand-year characteristic cycle time.
The Younger Dryas period is seen in Fig. V.1 as a dip in the global warming trend that occurred from about 12,900 to 11,600 years ago. The dip in global temperatures was modest, only about 0.5°C, probably because severe cooling in the North Atlantic was partially balanced by rapid heating in the Southern Hemisphere (note in the figure that Antarctic temperatures are rising rapidly during this period). The cooling dip of the Younger Dryas is seen to be far more pronounced in Greenland in Fig. V.2. As a result, it is believed that the cause of the event was the melting of Northern Hemisphere ice sheets and glaciers. At the time of the LGM, the northern third of North America and Europe were covered in ice sheets. The formation of these ice sheets during the Ice Age, freezing water that originated in the oceans, had lowered global sea levels by about 400 feet below modern levels. By the beginning of the Younger Dryas Northern Hemisphere temperatures had risen enough to trigger the rapid melting of the Laurentide ice sheet that covered much of North America. The melting ice produced a massive influx of cold, fresh water into the North Atlantic. And that fresh water was less dense than the ocean water, so it did not sink and did not need to be replenished by warm waters from the south via the AMOC.

This disruption of the AMOC halted the warming of the Northern Hemisphere for more than a millennium. During that period, Fig. V.1 shows that Antarctic temperatures were already increasing rapidly, as would be expected when warm southern waters stop flowing northward. But then, about 11,600 years ago, central Greenland temperatures increased by about 10°C in far less than a century, presumably indicating the reestablishment of the AMOC. This change is quite abrupt compared to normal paleoclimate characteristic times. After the Younger Dryas, Earth’s global climate stabilized, allowing the formation of human civilizations.
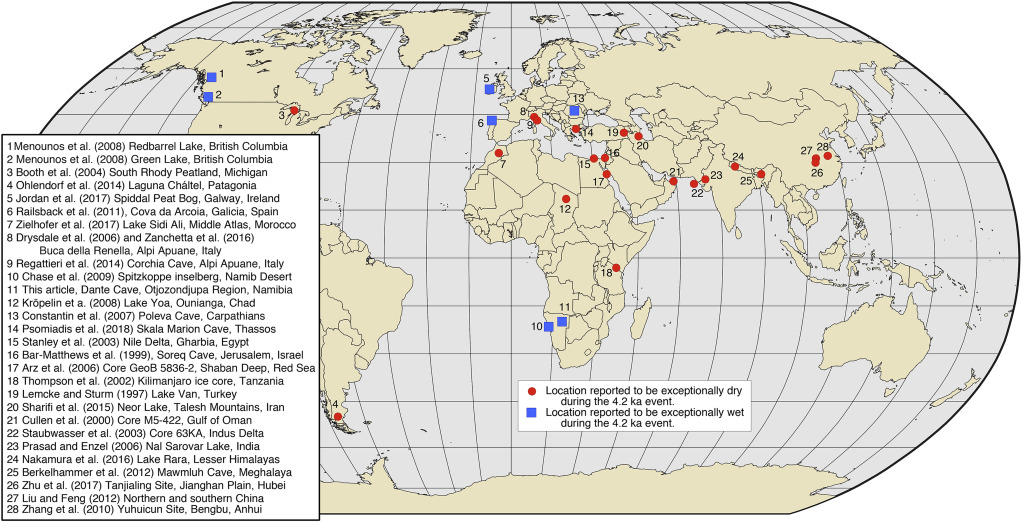
The Younger Dryas event, particularly the sharpness of its onset and its end, should serve as a cautionary tale about the nonlinear nature of Earth’s climate and the strong sensitivity of regional climates to shifts in the thermohaline ocean currents. The collapse of such a major ocean current as the AMOC can affect both temperature and precipitation trends across the globe. A later weakening of the AMOC is cited in modeling as the probable cause of the 4.2 kiloyear event that led to the collapse of multiple early human societies beginning in about 2200 BCE and lasting for more than a century. A major impact of the 4.2-kyr event was an enormous weakening and drying of the South Asian Monsoon winds, causing severe droughts across south Asia and the Middle East. At the same time, other parts of the globe (blue squares in Fig. V.3) saw unusually heavy precipitation and flooding.
As we have described in our post on Climate and Civilization, the agricultural failures caused by the 4.2-kyr mega-droughts led to the collapse of well-established civilizations in the Fertile Crescent of Mesopotamia, the Yangtze Delta region of China, the Indus Valley of current-day Pakistan, and the age of the pyramid builders in Egypt.
Future climate changes:
In our current time, global warming caused by human burning of fossil fuels is causing enhanced warming at high latitudes and an accelerating melting of the Greenland ice sheet, the West Antarctic Ice Sheet, and Arctic sea ice. That melting may have already, or may soon, become irreversible, as the loss of ice cover reduces reflection of incident sunlight and, hence, further increases the warming trend. Such melting will lead, once again, to a massive influx of cold, fresh water into the North Atlantic, the same trend that presumably triggered the Younger Dryas event some 13,000 years ago. As a result, we are getting increasing warnings about a certain weakening and possible collapse of the AMOC during the 21st century. Particular concern has been voiced for the Gulf Stream that normally carries about 30 billion kilograms per second of water, 5° to 15°C warmer than surrounding waters, past the eastern United States and Canada to northern Europe. Melting of the West Antarctic ice sheet can similarly disrupt thermohaline currents in the Southern Hemisphere.
In their Sixth Assessment Report the Intergovernmental Panel on Climate Change (IPCC) specifically addressed the issue of likely changes to the AMOC and the Gulf Stream, as illustrated schematically in Fig. V.4. “Most climate models project that the AMOC slows in the later 21st century under most emissions scenarios, with some models showing it slowing even sooner…[But] The Gulf Stream is part of two major circulation patterns, the … AMOC…and the North Atlantic Subtropical Gyre…the Gulf Stream is special in its dual role. There is no comparable deep overturning circulation in the North Pacific to the AMOC…The gyres circulate surface waters and result primarily from winds driving the circulation. These winds are not expected to change much and so neither will the gyres, which means the gyre portion of the Gulf Stream…will continue to transport thermal energy poleward from the equator…The gyre contribution to the Gulf Stream is 2 to 10 times larger than the AMOC contribution.” But note in Fig. V.4 that the North Atlantic gyre does not provide much warmth to the northeast regions of the U.S. and Canada or to most of Europe; that comes from the AMOC.

The IPCC report goes on: “What happens if the AMOC slows in a warming world? The atmosphere adjusts somewhat by carrying more heat, compensating partly for the decreases in heat carried by AMOC. But the [North Atlantic] ‘cold spot’ makes parts of Europe warm more slowly. Models indicate that weather patterns in Greenland and around the Atlantic will be affected, with reduced precipitation in the mid-latitudes, changing strong precipitation patterns in the tropics and Europe, and stronger storms in the North Atlantic storm track. The slowing of this current combined with the rotation of the Earth means that sea level along North America rises as the AMOC contribution to the Gulf Stream slows.“
The IPCC report also points out that the melting of Antarctic ice sheets and changing winds over the Southern Ocean will also likely weaken the Southern Meridional Overturning Circulation surrounding Antarctica. A recent study by British climate scientists of the loss of West Antarctic ice has led to projections of future melting under various scenarios, all of which suggest that a tipping point has already been passed. One of the authors of that study, Dr. Kaitlin Naughten, has said: “It looks like we’ve lost control of melting of the West Antarctic Ice Sheet. If we wanted to preserve it in its historical state, we would have needed action on climate change decades ago.” A weakening of the Southern Meridional Overturning Circulation will disrupt climate at high latitudes in the Southern Hemisphere, but many fewer humans will be affected by those changes than by changes to the AMOC and Gulf Stream.
Monitoring stations have been operating within the Atlantic Ocean to gauge current flow within the AMOC only since 2004. The IPCC points out that this is not long enough to establish clearly whether the AMOC is yet weakening. In contrast to the current consensus among climate scientists that the AMOC flow will weaken gradually throughout this century, a team from Utrecht University (Van Westen, et al.) has carried out model simulations that suggest there is a tipping point for the AMOC within reach and beyond which “the circulation could fully shut down within a century of hitting the tipping point…[with] severe and cascading consequences around the world.”
The Utrecht group perturbed a detailed climate model by introducing an adjustable input of fresh water in the North Atlantic. As shown in Fig. V.5, the AMOC circulation strength within their model slowly decreases as more fresh water is accumulated over the years, until a tipping point is reached when the cumulative fresh water input flow is just above half a million cubic meters per second. This may seem like an enormous flow rate, but it is only about 2% of the warm water flow in today’s Gulf Stream. In the Utrecht simulations, the AMOC fully and unstoppably collapses once one passes this tipping point.

Van Westen, et al. don’t yet have sufficient input data to predict how many years it will take to reach this tipping point. They do, however, propose an early warning signal requiring monitoring of the salinity transport at the southern boundary of the Atlantic Ocean. If this salinity transport passes a specified threshold, the AMOC tipping point would likely follow “in one to four decades.”
If the AMOC were to fully collapse, the Utrecht simulations suggest dire climate consequences. On average, North America and Europe would cool by a few degrees, but parts of northern Europe would have temperatures falling below the global average by about 3°C per decade, a far faster change than the current global warming by 0.2°C per decade. Arctic regions and northern parts of Scandinavia could cool by as much as 20°C. Regions in the Southern Hemisphere would warm by a few degrees compared to the global average. The Arctic spring sea ice pack would extend southward to about 50°N latitude, while Antarctic sea ice would retreat. The Intertropical Convergence Zone seen in Fig. II.1 would shift southward, causing changes to ocean currents and wind patterns worldwide and significant precipitation changes around the globe. The most severe precipitation changes would occur in the Amazon rain forest, drastically affecting the Amazon ecosystem and potentially Earth’s carbon sink.
Another recent analysis considers additional impacts of an AMOC collapse: “In the event of an AMOC collapse, more pronounced extreme weather events including heat waves, cold waves, drought, and flooding are anticipated which would create a vicious cycle of climate crisis. The compounding unpredictability involved would make their mitigation and management even more difficult. These potential climate ramifications should heighten the urgency of our decision-making processes.”
Deniers of the human role in climate change often highlight the change in nomenclature around the turn of this century from “global warming” to “climate change” as evidence that climate scientists don’t really know what they’re talking about and are just spinning a scary story. But the effects of AMOC collapse illustrate the complexity and nonlinearity of Earth’s climate. A global warming caused by humans’ burning of fossil fuels can trigger dramatic shifts in ocean currents that, indeed, can lead to drastic future drops in temperature in parts of the globe, while other parts continue to warm. The changes might not quite reach the level of the apocalypse foreseen in the 2004 movie The Day After Tomorrow (see Fig. I.2), but they would be considerable and would illustrate why “climate change” encompasses a wide range of shifts whose ultimate cause is today’s global warming.
One should keep in mind, however, that all projections of future climate behavior rely on large computer models that do not necessarily incorporate a full understanding of Earth’s ocean and atmospheric currents and their complex coupling. The history of past climate changes likely caused by alterations in the major ocean currents is enough reason to remain concerned and to try to mitigate the causes and impacts of ongoing global warming.
VI. summary
The prevailing wind patterns on Earth are driven by atmospheric pressure differences that result from differences around the globe in the extent of solar heating. High-pressure zones are found around 30°N and S in latitude and are concentrated around the east-west middles of the oceans. But wind trajectories flowing outward from these high-pressure zones curve due to the Coriolis Effect arising from Earth’s daily rotation about its axis. The result are easterly trade winds that blow toward the west at latitudes below 30° and westerlies above 30°. These prevailing winds drive surface currents in Earth’s oceans that form large loops called gyres in the North and South Atlantic, the North and South Pacific, and the Indian Ocean.
Under normal conditions these gyres bring warm water, and therefore warm and damp weather, to the eastern coasts of Asia, Australia, North and South America, and Africa. But they also allow nutrient-rich cold water to well up from depth to the surfaces along the western coasts of North and South America, Australia, and Africa. These cool currents tend to bring cool and dry weather to these western coastal regions. But the wind patterns can be fickle. From time to time, the prevailing winds across the Pacific Ocean are either enhanced, during La Niña events, or reversed, during El Niño events. In years where these changes occur, weather patterns worldwide are altered. But the alterations are reversible; El Niño and La Niña are temporary disturbances that last for a year, or two at most. So they affect weather but do not alter long-term climate trends.
But Earth’s long-term climate is sensitive to the flow of thermohaline currents, which are driven by changes in water density arising from temperature and salinity differences across the globe. The thermohaline currents form a Global Conveyor Belt that sends warm waters along the surface of all of Earth’s oceans, balanced by cold, salty waters that flow in the opposite directions deep below the surface. The climate experienced by hundreds of millions of people residing around the periphery of the Atlantic Ocean depends strongly on a portion of the Global Conveyor Belt known as the Atlantic Meridional Overturning Circulation (AMOC). There is historical evidence from a period during the deglaciation following Earth’s last Ice Age that the melting of ice sheets and glaciers around the North Atlantic, leading to a massive influx of fresh water that disrupts the sinking of the normally salty water at high latitude in the Northern Hemisphere, can severely weaken or even collapse the AMOC. We are again facing that possibility today as ongoing global warming could lead to tipping points beyond which the Greenland ice sheet and Arctic sea ice melt irreversibly. We are already seeing melting at accelerating rates.
The Gulf Stream that warms the eastern coast of North America and northern Europe has contributions from both the AMOC and the wind-driven North Atlantic gyre. But the warming of northern regions of the U.S. and Canada and Europe is completely reliant on the AMOC. If the AMOC were to collapse we’d face the counter-intuitive result that global warming might lead to a deep freeze in the North Atlantic, all the while that it causes intense heating in the Southern Hemisphere. If the history of the deglaciation period is any guide, it could take a millennium or more for the ice sheets in the frozen North Atlantic to rebuild and to reestablish the AMOC.
Earth’s weather and climate patterns are complicated by the complex interactions of air flow in the atmosphere and water flow in the oceans. There is no question that the ongoing global warming is caused primarily by human activities. But, as the AMOC sensitivity illustrates, the climate changes that can result from continued warming can be highly nonlinear, counter-intuitive, and disastrous. Humanity would be well served by altering its activities to avoid facing the worst long-term consequences of its activities to date.
references:
Woods Hole Oceanographic Institution, Currents, Gyres, and Eddies, https://www.whoi.edu/know-your-ocean/ocean-topics/how-the-ocean-works/ocean-circulation/currents-gyres-eddies/
Wikipedia, Ocean Gyre, https://en.wikipedia.org/wiki/Ocean_gyre
National Geographic, Ocean Gyre, https://education.nationalgeographic.org/resource/ocean-gyre/
Wikipedia, Thermohaline Circulation, https://en.wikipedia.org/wiki/Thermohaline_circulation
National Geographic, Ocean Currents and Climate, https://education.nationalgeographic.org/resource/ocean-currents-and-climate/
P. Lynch, et al., Swirling Seas, NASA Scientific Visualization Studio, May 3, 2023, https://svs.gsfc.nasa.gov/10953
Wikipedia, The Day After Tomorrow, https://en.wikipedia.org/wiki/The_Day_After_Tomorrow
Brittanica, Subtropical High, https://www.britannica.com/science/subtropical-high
Wikipedia, Horse Latitudes, https://en.wikipedia.org/wiki/Horse_latitudes
National Geographic, The Coriolis Effect: Earth’s Rotation and Its Effect on Weather, https://education.nationalgeographic.org/resource/coriolis-effect/
Byju’s, Coriolis Effect, https://byjus.com/physics/coriolis-effect/
The Coriolis Effect Explained, https://www.youtube.com/embed/HIyBpi7B-dE
A. Laing and J.-L. Evans, Introduction to Tropical Meteorology (2nd edition), Chapter 3: Global Circulation, https://www.chanthaburi.buu.ac.th/~wirote/met/tropical/textbook_2nd_edition/navmenu.php_tab_4_page_3.1.0.htm
Australian Antarctic Program, Antarctic Weather, https://www.antarctica.gov.au/about-antarctica/weather-and-climate/weather/
Wikipedia, Antarctic Circumpolar Current, https://en.wikipedia.org/wiki/Antarctic_Circumpolar_Current
Wikipedia, Indian Ocean Gyre, https://en.wikipedia.org/wiki/Indian_Ocean_Gyre
Wikipedia, Monsoon of South Asia, https://en.wikipedia.org/wiki/Monsoon_of_South_Asia
NASA Earth Observatory, El Niño, https://earthobservatory.nasa.gov/features/ElNino
T. Di Liberto, The Walker Circulation: ENSO’s Atmospheric Buddy, Climate.gov, Aug. 1, 2014, https://www.climate.gov/news-features/blogs/enso/walker-circulation-ensos-atmospheric-buddy
M. Greshko, El Niño Paints the World’s Driest Place with Color, National Geographic, Nov. 3, 2015, https://www.nationalgeographic.com/science/article/151103-atacama-desert-flower-bloom-el-nino
M. Gilbert, et al., Atmospheric River Lashes California with Heavy Rain and Wind, CNN, Feb. 6, 2024, https://www.cnn.com/us/live-news/california-atmospheric-river-flooding-rain-02-05-24/index.html
Wikipedia, Atmospheric River, https://en.wikipedia.org/wiki/Atmospheric_river
National Ocean Service, What Are El Niño and La Niña?, https://oceanservice.noaa.gov/facts/ninonina.html
Pacific Marine Environmental Laboratory, Impacts of El Niño, https://www.pmel.noaa.gov/elnino/impacts-of-el-nino
NASA Earth Observatory, El Niño Brought Drought and Fire to Indonesia, https://earthobservatory.nasa.gov/images/87204/el-nino-brought-drought-and-fire-to-indonesia
California-Nevada Precipitation Page, https://cirrus.ucsd.edu/~pierce/sdprecip/
Climate.gov, El Niño and Rainfall, https://www.climate.gov/sites/default/files/IRI_ENSOimpactsmap_lrg.png
Goddard Institute for Space Studies, GISS Surface Temperature Analysis, https://data.giss.nasa.gov/gistemp/
NOAA Global Monitoring Laboratory, Trends in Atmospheric Carbon Dioxide, https://gml.noaa.gov/ccgg/trends/
G. Bell, Impacts of El Niño and La Niña on the Hurricane Season, Climate.gov, May 30, 2014, https://www.climate.gov/news-features/blogs/enso/impacts-el-ni%C3%B1o-and-la-ni%C3%B1a-hurricane-season
National Ocean Service, The Global Conveyor Belt, https://oceanservice.noaa.gov/education/tutorial_currents/05conveyor2.html
A. Buis, Milankovitch (Orbital) Cycles and Their Role in Earth’s Climate, NASA Global Climate Change, Feb. 27, 2020, https://climate.nasa.gov/news/2948/milankovitch-orbital-cycles-and-their-role-in-earths-climate/
M. Huguenin, M. England, and R. Holmes, The Southern Ocean Absorbs More Heat Than Any Other Ocean on Earth and the Impacts Will Be Felt for Generations, The Guardian, Sept. 7, 2022, https://www.theguardian.com/australia-news/2022/sep/08/the-southern-ocean-absorbs-more-heat-than-any-other-ocean-on-earth-and-the-impacts-will-be-felt-for-generations
S. Waldek, The West Antarctic Ice Sheet is Melting, and It’s Too Late to Stop It, Space.com, Oct. 25, 2023, https://www.space.com/west-antarctic-ice-sheet-melting-unavoidable
Wikipedia, Atlantic Meridional Overturning Circulation, https://en.wikipedia.org/wiki/Atlantic_meridional_overturning_circulation
Wikipedia, Younger Dryas, https://en.wikipedia.org/wiki/Younger_Dryas
Brittanica, Younger Dryas, https://www.britannica.com/science/Younger-Dryas-climate-interval
National Research Council, Abrupt Climate Change: Inevitable Surprises (National Academies Press, 2002), https://nap.nationalacademies.org/catalog/10136/abrupt-climate-change-inevitable-surprises
J.D. Shakun, et al., Global Warming Preceded by Increasing Carbon Dioxide Concentrations During the Last Deglaciation, Nature 484, 49 (2012), https://www.nature.com/articles/nature10915
Wikipedia, Older Dryas, https://en.wikipedia.org/wiki/Older_Dryas
Wikipedia, Bølling Oscillation, https://en.wikipedia.org/wiki/B%C3%B8lling_oscillation
Wikipedia, Allerød Oscillation, https://en.wikipedia.org/wiki/Aller%C3%B8d_oscillation
DebunkingDenial, Climate and Civilization, https://debunkingdenial.com/climate-and-civilization-part-i-climate-stability-and-the-rise-of-civilization/
Wikipedia, 4.2-Kiloyear Event, https://en.wikipedia.org/wiki/4.2-kiloyear_event
S. Kaboth-Bahr, et al., A Tale of Shifting Relations: East Asian Summer and Winter Monsoon Variability During the Holocene, Scientific Reports 11, Article Number 6938 (2021), https://www.nature.com/articles/s41598-021-85444-7
L.B. Railsback, et al., The Timing, Two-Pulsed Nature, and Variable Climatic Expression of the 4.2 ka Event: A Review and New High-Resolution Stalagmite Data from Namibia, Quaternary Science Reviews 186, 78 (2018), https://www.sciencedirect.com/science/article/abs/pii/S027737911731003X?via%3Dihub
P. Ditlevsen and S. Ditlevsen, Warning of a Forthcoming Collapse of the Atlantic Meridional Overturning Circulation, Nature Communications 14, article number 4254 (2023), https://www.nature.com/articles/s41467-023-39810-w
S. Connor, Gulf Stream is Slowing Down Faster Than Ever, Scientists Say, The Independent, March 23, 2015, https://www.independent.co.uk/climate-change/news/gulf-stream-is-slowing-down-faster-than-ever-scientists-say-10128700.html
IPCC Working Group 1, Sixth Assessment Report: Chapter 9 Frequently Asked Questions, https://www.ipcc.ch/report/ar6/wg1/downloads/faqs/IPCC_AR6_WGI_FAQ_Chapter_09.pdf
K.A. Naughten, P.R. Holland, and J. De Rydt, Unavoidable Future Increase in West Antarctic Ice-Shelf Melting Over the Twenty-First Century, Nature Climate Change 13, 1222 (2023), https://www.nature.com/articles/s41558-023-01818-x
R. van Westen, H.A. Dijkstra, and M. Kliphuis, Atlantic Ocean is Headed for a Tipping Point – Once Melting Glaciers Shut Down the Gulf Stream, We Could See Extreme Climate Change Within Decades, Study Shows, The Conversation, Feb. 9, 2024, https://theconversation.com/atlantic-ocean-is-headed-for-a-tipping-point-once-melting-glaciers-shut-down-the-gulf-stream-we-would-see-extreme-climate-change-within-decades-study-shows-222834
R.M. van Westen, M. Kliphuis, and H.A. Dijkstra, Physics-Based Early Warning Signal Shows That AMOC is on Tipping Course, Science Advances 10, eadk1189 (2024), https://www.science.org/doi/10.1126/sciadv.adk1189
P, Kaushik, Climate Change Threatens the North Atlantic’s Currents, Ecosystems, and Stability (Analysis), Mongabay, Nov. 7, 2023, https://news.mongabay.com/2023/11/climate-change-threatens-the-north-atlantics-currents-ecosystems-and-stability-commentary/
