
John Christy Profile in Denial Part II
There are many arguments put forth by climate change deniers. In fact, the blog Skeptical Science.com lists 198 of them (of course, several of these are related)! As we showed in part I, the satellite data by the UAH group led by John Christy and Roy Spencer represents a significant outlier in atmospheric temperatures. Christy and Spencer are responsible for numerous arguments that global climate change either does not exist, or is much weaker than most scientists contend. In op-ed columns, interviews and statements before Congress, Christy has invented or repeated several of the common climate-change-denier arguments. We summarized a few of these in Part I of this post and include other arguments here. We direct readers interested in more detailed and technical examination of Christy’s views to the sites Skeptical Science.com, Real Climate.org, or deSmogBlog.com.
“CO2 Can’t be a Pollutant – It’s Plant Food!”
A common complaint among climate change deniers is that carbon dioxide (CO2) has been falsely slandered as a “pollutant,” when in fact it is a molecule that is essential to life on our planet and is an essential nutrient for plants. In an earlier post in our blog series Profiles in Denial, we reviewed William Happer, a noted climate-change skeptic and co-founder and current Director of the CO2 Coalition. In a 2014 interview on CNBC, Happer asserted that “The demonization of carbon dioxide is just like the demonization of the poor Jews under Hitler. Carbon dioxide is actually a benefit to the world, and so were the Jews.”
In April 2015, John Christy echoed these statements. He said “Carbon dioxide makes things grow. The world used to have five times as much carbon dioxide as it does now. Plants love this stuff. It creates more food. CO2 is not the problem … There is absolutely no question that carbon energy provides with longer and better lives. There is no question about that.”
It is certainly true that CO2 is essential for plants, which absorb this molecule and in turn release oxygen in the process of photosynthesis. So why would CO2 be called a pollutant? This is because CO2 is also a greenhouse gas. The Earth is warmed by radiation from the Sun. Much of this radiation is in the form of visible light that passes through the atmosphere with little absorption. After the solar radiation strikes the Earth, a substantial amount of energy is radiated upward in the form of infrared (IR) radiation. Greenhouse gases such as water vapor, CO2 and methane, are transparent to solar radiation, but they absorb and reflect IR waves. Some of those reflected waves travel back to Earth where they provide additional warming.

As the concentration of CO2 in the atmosphere increases, this causes further warming of the Earth. Since the Industrial Revolution, the concentration of CO2 in the atmosphere has increased from 280 parts per million (ppm) in 1750 to 415 ppm in 2019. This is the highest concentration of CO2 in the Earth’s atmosphere in the last 3 million years. Fig. II.2 plots the concentrations of CO2 and methane and Earth temperatures over the last 800,000 years as extracted from Antarctic ice core samples. At lower concentrations, CO2 helps warm the planet by reflecting IR light back to Earth. However, too much warming of Earth can have severe negative effects on the environment, human health and agriculture.
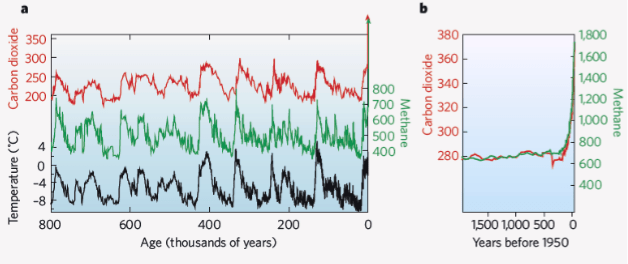
Fig. II.2 shows data gleaned from Antarctic ice core samples, that demonstrate Earth’s climate cycles over the past 800,000 years. CO2 levels are shown by the red curve and scale; methane levels the green curve and scale; and Earth temperatures are represented by the black curve and scale at left. Note the very strong correlation of Earth temperatures with the concentrations of these greenhouse gases. Note also the exceptionally rapid rise in CO2 and methane in the past 100 years, which is also apparent in the graph at right that shows the prevalence of these two greenhouse gases in the last 2,000 years. [Note: CO2 levels are in parts per million while methane levels are in parts per billion].
So, exactly what constitutes an air pollutant? This is defined by US Clean Air Act as amended in 1990: “The term “air pollutant” means any air pollution agent or combination of such agents, including any physical, chemical, biological, radioactive (including source material, special nuclear material, and byproduct material) substance or matter which is emitted into or otherwise enters the ambient air.” The Act further requires that the EPA Administrator must publish a list of certain air pollutants: “emissions of which, in his judgment, cause or contribute to air pollution which may reasonably be anticipated to endanger public health or welfare.”
In 2009, the EPA issued an endangerment finding concluding that “greenhouse gases in the atmosphere may reasonably be anticipated both to endanger public health and to endanger public welfare …. The major assessments by the U.S. Global Climate Research Program (USGCRP), the Intergovernmental Panel on Climate Change (IPCC), and the National Research Council (NRC) serve as the primary scientific basis supporting the Administrator’s endangerment finding.”
Thus in the US, at the high concentrations we are currently experiencing, CO2 is an air pollutant that must be regulated if it could endanger public health or welfare. This greenhouse gas satisfies the official definition for an air pollutant. This is why CO2 is simultaneously “plant food” and (at sufficiently high concentrations in the atmosphere) is an “air pollutant.” There is no “war against carbon dioxide,” nor is there any attempt to “demonize” this gas. Climate change deniers, who clearly understand this dual role for carbon dioxide, simply attempt to confuse the public into thinking that a substance that is “plant food” cannot simultaneously be an “air pollutant.”
“Global Warming Could be a Natural Phenomenon, and Not Necessarily Caused by Humans”
In November 2007 John Christy wrote in the Wall Street Journal, “I’m sure the majority (but not all) of my IPCC colleagues cringe when I say this, but I see neither the developing catastrophe nor the smoking gun proving that human activity is to blame for most of the warming we see. Rather, I see a reliance on climate models (useful but never “proof”) and the coincidence that changes in carbon dioxide and global temperatures have loose similarity over time.”
John Christy claims that increases in CO2 concentration and global temperature increases are just a “coincidence.” What is the evidence that global warming is anthropogenic (significantly caused by humans)?
• First, the increases in atmospheric CO2 concentrations are directly related to emissions of CO2 by humans. That is shown in Fig. II.3, where the rise in atmospheric CO2 levels over time is clearly directly correlated with human emissions of CO2.

• Next, we show that the increasing CO2 is coming from carbon emissions resulting from burning fossil fuels. Fossil fuels arise from ancient plants that have eventually converted to substances such as oil and coal. When plants absorb and convert CO2 from the air, the carbon occurs in different isotopes. The most prevalent isotope is carbon-12 whose atom contains 6 protons and 6 neutrons. Another isotope is C-13 which contains 6 protons and 7 neutrons. Plants preferentially use C-12 in photosynthesis rather than C-13; thus fuels derived from fossilized plants will have a lower C-13/C-12 ratio than the atmosphere. If the increased CO2 comes from fossil-fuel carbon, it will have a lower C-13/C-12 ratio than the atmosphere. Fig. II.4 shows the increase in global emissions of CO2 from fossil fuels and cement manufacturing (black curve and left scale), while the red curve (and right scale) shows the decrease in the C-13/C-12 ratio vs. time. The increase in CO2 is directly correlated with a decrease in the C-13 isotope (the upward slope of the red curve indicates that the isotopic ratio is decreasing).

• The human contribution to the increase of CO2 in the atmosphere comes about because carbon released from fossil fuel burning and manufacturing combines with atmospheric oxygen molecules (O2) to form CO2. Thus increases in CO2 should be correlated with decreases in atmospheric O2. Fig. II.5 shows these quantities over time; increases in atmospheric CO2 are directly correlated with decreases in oxygen.

• Next we show that greenhouse gases in the atmosphere are trapping IR radiation that would otherwise be radiated into outer space. Satellites can measure the wavelengths of IR radiation escaping from the Earth, and compare them to those wavelengths at which greenhouse gases absorb the radiation. This is shown in Fig. II.6, where the dotted line shows the expected amounts of radiation from 1970 to 1996. The dips in the observed spectrum correspond well to trace greenhouse gases in the atmosphere, particularly CO2 and CH4 (methane). One can also measure the wavelengths of IR energy that are radiated back to Earth, and determine which greenhouse gases are involved. The authors state “this experimental data should effectively end the argument by skeptics that no experimental evidence exists for the connection between greenhouse gas increases in the atmosphere and global warming.”

• The mechanism claimed to be responsible for global warming postulates that increased greenhouse gases in the lower atmosphere will absorb IR radiation coming from Earth and re-radiate it back to Earth. In that case the lower atmosphere (the Troposphere) will warm up. However, because greenhouse gases reflect some IR radiation and prevent it from escaping into space, the higher atmosphere (e.g., the Stratosphere) should experience cooling. Fig II.7 shows temperature changes in the lower stratosphere (upper graph) vs. time compared with changes in the mid-troposphere (lower graph). Measurements by both satellites and balloons are included; temperatures are plotted relative to the mean from 1979-1990, and temperatures are smoothed over a 7-month period. Vertical dashed blue lines denote the occurrence of major volcanic eruptions. The curves show just what is expected – troposphere warming together with stratospheric cooling.
• A final indication that global warming is primarily caused by increased greenhouse gases is the comparison between warming in daytime vs. night. If global warming is caused by solar activity, then days will warm more than nights. However, because the greenhouse effect acts around the clock, it should cause warming at night to be relatively greater than warming in the daytime. Fig. II.8 compares the coldest and warmest days and nights between 1951 and 2003 (these are defined as the 10% coldest or warmest periods), while the orange curves show the decadal trend. We see that the decrease in cold nights exceeds the decrease in cold days, while the increase in warm nights exceeds the increase in warm days. These are consistent with the greenhouse effect being the dominant driver of global warming.
• Various groups have tried to compare the contribution to global warming from natural causes and from human causation. Fig II.9 compares the contributions to global warming from natural causes (right) and human causes (left) over the past 50-65 year period, as calculated from 8 studies (by Simon et al., Meehl et al., Stone et al., Lean & Rind, Huber & Knutti, Gillett et al., Wigley & Santer, and Jones et al.). All the studies find that man-made contributions account for nearly 100% of global warming. In fact, in several of these studies human causation accounts for more than 100% of global warming, because they find that without human contributions the globe would be cooling.

“Environmental Activists are Elitists Whose Policies Would Hurt The Poor”
This is an accusation leveled against anyone who advocates environmental regulations, on any issue (from regulations on tobacco to acid rain to environmental cleanup to the ozone crisis). It is part of the “Science Denier’s Toolbox” that we covered as part of our blog series. For example, this was a common argument made at the time of the ozone-level crisis. We reviewed several of these arguments in our blog post on the Ozone Layer Controversy. In particular, we examined arguments by those who denied that chlorinated fluorocarbons (CFCs) were a threat to the ozone layer, or who argued that restricting the production of CFCs would be economically disastrous. We also compared the predictions of the ozone-depletion deniers, and their cost-benefit estimates, with the actual results of the worldwide ban on CFCs.
The first category of denier arguments regarding the ozone layer consisted of draconian estimates of economic chaos if CFCs were banned (among other uses, CFCs were the major chemicals used in refrigerants). It was predicted that alternative chemicals to replace CFCs could not be found; the replacement chemicals would be prohibitively expensive, would break down and would not be as efficient; and entire industries would go bankrupt. It was also argued that those who advocated a ban on CFCs were elitists whose policies would hurt citizens of Third-World countries, whose access to cheap refrigerants would be curtailed. The most outspoken opponents to international CFC regulation actually called this an act of “genocide” against the Third World – they predicted crops would spoil and medicine would be ineffective because of lack of refrigeration, and that would lead to famine and epidemics in those countries.
In retrospect, these predictions were wildly incorrect. New chemicals were rapidly developed and produced; the cost of refrigerants went up somewhat, but with a few exceptions rampant inflation was avoided. One of the hallmarks of the deniers was that they made little or no effort to conduct honest cost-benefit analyses of CFC regulations. Their work consisted of wildly inflated estimates of the costs, with essentially no discussion of the benefits of regulating CFCs. There was certainly no mention of the costs to human health and damage to plants and animals that would ensue if CFCs were damaging the ozone layer (in hindsight, not only was this damage occurring, but the situation was worse than we thought at the time).
John Christy has claimed that regulations to lower carbon emissions by either moving to renewable energy sources or imposing a carbon tax would have little to no effect in slowing global warming, and would merely hurt the economy. And Christy’s colleague Roy Spencer has explicitly linked such actions to harming the poor. Regarding scientists who urge moving away from fossil fuels, Spencer asked “Are you an expert in alternative energy sources and what they cost? How many poor people are you going to hurt? How many more people are you going to make poor through energy poverty because they are paying five to 10 times as much for their energy?”
Actually, it is the poor, those least able to mitigate the effects of global climate change, who are likely to be affected the most by these changes. For example, we see Inuit communities in northern Canada having to abandon their homes and move elsewhere because of rising sea levels and melting Arctic ice. Inhabitants of low-lying Pacific islands in Micronesia are already planning to leave their islands as rising sea levels will place their homelands under water.
Rising sea levels are already threatening millions of people in Bangladesh. Their low-lying country is watered by several major rivers, all of which arise in bordering nations such as India and Myanmar. They are extremely vulnerable to sea level rise that would send salt water into their rice paddies. Increased heat and drought is likely to increase food insecurity and water stress to an extremely densely-populated country with a low standard of living, and a government with limited resources to alleviate these conditions.

The continent of Africa is one of the areas most likely to experience severe increases in temperature and extreme weather events. Fig. II.10 shows new areas of Africa that are most likely to experience desertification as global temperatures increase. Another continental challenge may arise as swarms of insects develop under new climatic conditions – East Africa is currently experiencing massive swarms of locusts as a result of recent heavy rainfall and cyclones. Fig II.11 shows a swarm of locusts in Kenya in 2020.

Next we show contributions from various countries to CO2 emissions. In Fig II.12 below, the countries in red (blue) represent those that emit the largest (smallest) amounts of carbon dioxide. It is clear that the developed countries of North America, western Europe, Russia and Australia are large emitters of CO2. Fig II.13 then shows those countries that are most vulnerable to the effects of global climate change. This is the so-called Climate Demography Vulnerability Index or CDVI. It combines estimates of the effects of climate change with the expected growth in population of each region. In Fig. II.13, red corresponds to more vulnerable areas while blue denotes less vulnerable regions and white refers to areas of very low population density.
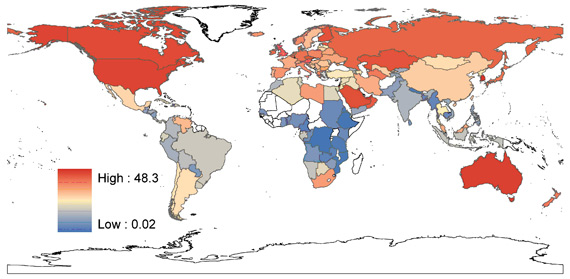
Fig II.13 makes clear that regions in central South America, south and east Africa, the Middle East and parts of Southeast Asia are most vulnerable. And comparison of Figs II.12 and II.13 shows a strong correlation between countries with the smallest CO2 emissions and those countries most vulnerable to the effects of global climate change.

“We are Not Seeing the Extreme Weather Events Predicted by Climate Scientists:”
In May 2011 John Christy said “We do not find trends in these things, not even in heat waves, we do not see heat waves getting worse in the United States, the worst period by far was in the 1930s and the 1920s…snowfall is still falling in the west.” Indeed, climate models predict that we should see on average more severe weather events as a result of global climate change. However, without further analysis these models cannot say whether the existence or severity of any particular event was ‘caused’ by global climate change.
There have been several studies that have concluded that global warming is most probably a leading cause of certain climate events. These have been summarized in the page “Is extreme weather caused by global warming?” on the Skeptical Science.com website. We refer the reader to that site for citations to the peer-reviewed published results. For example, a study concluded that anthropogenic greenhouse gas (GHG) emissions substantially raised the possibility of severe flooding in the United Kingdom in summer 2000. Another study concluded that there was strong evidence that extreme heatwaves and precipitation extremes were strongly influenced by anthropogenic influences on climate.
However for deadly storms, the evidence connecting those to human influence was not as strong. Another condition where different areas experience varying effects is drought. While Southern Europe and West Africa have recently experienced longer and worse droughts than normal, other areas such as central North America and northwest Australia have seen less intense and/or shorter droughts. However, climate models predict that if future trends continue, more areas of the world will experience reduced precipitation and/or increased loss of water vapor by evaporation.
Recently, the spate of bushfires in Australia, connected to severe drought and unprecedented high temperatures on that continent, are right in line with predictions from climate models. Those models also predict that the number and severity of hurricanes is likely to increase. This is because over 90% of the additional heat generated by global warming is stored in the oceans; this should increase the amount of energy that could be released in a hurricane. The heat content of the Earth plus atmosphere, and the ocean at various depths, is shown in Fig II.14 as a function of time.

Climate-change deniers are fond of claiming that there is no evidence of an increase in various extreme climate events. For example, Will Happer, head of the climate-change-denying CO2 Coalition, said that “dispassionate data show that the frequency of extreme events has hardly changed and in some cases has decreased in the 150 years that it has taken CO2 levels to increase from 270 ppm to 390 ppm.” This claim is false. The easiest way to demonstrate this is shown in Fig. II.15. Munich Re is one of the world’s largest reinsurance companies. They have records on the type and frequency of severe disruptive events since 1980. As is apparent in Fig. II.15, severe events that are not related to climate change such as volcanoes, earthquakes and tsunamis have remained constant over the past 40 years. However, those severe events linked to climate change have increased by a factor of 3 during this same period.

Summary:
At this point, it is appropriate to quote a summary from our post about William Happer, another eminent scientist who has become a spokesperson for the climate-denial lobby. “The past 50 years have seen: CO2 emissions double; atmospheric CO2 concentrations rise by 25%; global surface temperatures rise by 1°C, and by much more in many Earth regions; the heat stored in Earth’s oceans increase by 2 x 10²³ Joules, roughly equivalent to 300 years’ worth of worldwide energy consumption at present rates; sea levels rise by 10 cm, with the rate of rise accelerating; severe storms, droughts, floods and forest fires triple in frequency; Arctic and Antarctic ice melt rates increase 6-fold; and so forth. These are all impacts consistent with global climate model projections, and no convincing alternative explanations to human-caused greenhouse gas emissions have been offered. If this much correlation doesn’t cause you concern, you’re either not paying attention or being paid to ignore the issue.”
We have reviewed the career of John Christy, with special emphasis on his role as a climate-change denier. Dr. Christy has received acclaim for his work with Roy Spencer and others on satellite measurements of atmospheric temperatures. However, as we showed, his UAH (University of Alabama – Huntsville) results in this area are in disagreement with several other groups, and his results have been revised on several occasions. In every revision, the new results show greater warming than the previous ones.
Although Dr. Christy has co-authored major reviews on satellite measurements of atmospheric temperatures and he signed the 2003 AGU statement on global warming, for the past 15 years he has served as a spokesperson against the overwhelming consensus of the climate science community. In several public forums (interviews, op-ed columns, testimony before several Congressional committees) he has insisted that global warming is either non-existent or that it is negligibly small. He has produced graphs that “prove” global climate models (GCM) seriously over-estimate the warming occurring in the atmosphere. Such graphs have been widely debunked and it has been conclusively demonstrated that they give a seriously misleading picture of the agreement between GCM models and atmospheric temperatures. Nevertheless, Christy continues to display these graphs, which are gleefully adopted by the climate-denial community.
Although it is sometimes difficult to separate climate-change skeptics and deniers, there are clear-cut cases where the science and data progress, but the deniers continue to release discredited statements. One clear example was S. Fred Singer, who was profiled in an earlier post on our Profiles of Deniers segment. In 1995, shortly before a world-wide ban on chlorinated fluorocarbons (CFCs), Singer published a paper on CFCs. He denied that CFCs posed any threat to the ozone layer, and then predicted that a CFC ban would have disastrous economic consequences and would pose terrible hardships to Third-World nations.
That same paper was re-published in 2010 by the Heartland Institute. By then, CFCs had been banned worldwide, and had not been produced in developed countries for 15 years. Furthermore, the data on CFCs and ozone had clearly demonstrated the existential threat posed by CFCs to the environment. Not only had none of Singer’s dire economic predictions materialized, but the developed countries had created a Multilateral Fund that had channeled billions of dollars and technical assistance to Third World countries. Nevertheless, the Heartland Institute re-published Singer’s 1995 paper with no changes. This is a classic case of scientific denial. In similar fashion, John Christy continues to publish updated versions of his graphs claiming that climate models fail to fit the data, despite extensive demonstrations that his graphs are misleading and untrue. This goes to the heart of Neil deGrasse Tyson’s 2016 Tweet that “A skeptic will question claims, then embrace the evidence. A denier will question claims, then reject the evidence.”
In this blog post, we have reviewed at length only a few of John Christy’s false or misleading statements about climate. There are several excellent and detailed rebuttals to the arguments of Christy and his fellow deniers. Very detailed material is posted on the Skeptical Science.com blog (on several topics they include “Basic,” “Intermediate,” and “Advanced” sections, depending on the scientific level of the reader). There are also extended discussions of these topics on the Real Climate.org website. In addition, deSmogBlog also contains a great deal of information on climate deniers, their work and funding, and their claims about climate. We also wish to thank Prof. Ben Kravitz for useful discussions about satellite measurements of global temperatures.
Source Material:
Wikipedia, John Christy
Temperature Trends in the Lower Atmosphere: Understanding and Reconciling Differences, T.M.L. Wigley et al., 2004. Report of the U.S. Climate Change Science Program, NOAA.
The AGU Position Statement, “Human Impacts on Climate” – Rationale and Process, EoS 85, 80 (2004)
What if Global Warming Fears are Overblown? Fortune magazine, May 2009.
U.S. House Committee on Science, Space & Technology, 29 Mar 2017, Testimony of John R. Christy
U.S. House Committee on Science, Space & Technology, 2 Feb 2016, Testimony of John R. Christy
U.S. Senate Committee on Commerce, Science & Transportation Subcommittee on Space, Science and Competitiveness, 8 Dec 2015, Testimony of John R. Christy
Video Testimony of John Christy, Senate Committee on Environment and Public Works, Aug 2012
Climate Change: Examining the Processes Used to Create Science and Policy Hearing, House Committee on Science, Space and Technology, March 31, 2011
Debunking Denial.com Scientific Disagreements vs. Science Denial
Removing Diurnal Cycle Contamination in Satellite-Derived Tropospheric Temperatures: Understanding Tropical Tropospheric Trend Discrepancies, S. Po-Chedley et al., Journal of Climate 28, 2274 (2015)
Lamar Smith Blasts NOAA Study, Accuses Agency of Hype, E&E News, Mar. 17, 2016.
Debunking Denial, The Heartland Institute Strikes Again, Part I
C.D. Idso, R.M. Carter and S.F. Singer, Why Scientists Disagree About Global Warming: the NIPCC Report on Scientific Consensus
Real Climate.org Comparing Models To the Satellite Datasets, May 2016
Wikipedia, Coupled Model Intercomparison Project
M.E. Mann, S. Rahmstorf, B.A. Steinman, M. Tingley and S.K. Miller, The Likelihood of Recent Record Warmth, Scientific Reports 6, article #19831 (2016)
NCAR/UCAR Climate Data Guide, Global Surface Temperatures: BEST: Berkeley Earth Surface Temperatures
Skeptical Science.com What Has Global Warming Done Since 1998?
Debunking Denial.com Will Happer, Climate-Change Denier
“7 questions with John Christy and Roy Spencer: Climate change skeptics for 25 years,” Alabama.com, April 1, 2015.
Wikipedia, Greenhouse gas
Skeptical Science.com Is CO2 a Pollutant?
Debunking Denial.com The Ozone-Layer Controversy
Skeptical Science.com Global Warming & Climate Change Myths
Skeptical Science.com Climate Misinformation by Source: John Christy
DeSmogBlog.com John Christy
John R. Christy, My Nobel Moment, Wall Street Journal Nov. 1, 2007
Skeptical Science.com The Human Fingerprint in Global Warming
W.F.J. Evans and E. Puckrin, Measurements of the Radiative Forcing of Climate, American Meteorological Society, 18th Conference on Climate Variability and Change, Jan. 30, 2006.
Simon F. B. Tett et al., Estimation of Natural and Anthropogenic Contributions to Twentieth-Century Temperature Change, Journal of Geophysical Research 107, 4306 (2002).
G.A. Meehl et al., Combinations of Natural and Anthropogenic Forcings in Twentieth-Century Climate, Journal of Climate 17, 3721 (2004)
D.A. Stone et al., The Detection and Attribution of Climate Change Using an Ensemble of Opportunity, Journal of Climate 20, 504 (2007)
J.L. Lean and D.H. Rind, How Natural and Anthropogenic Influences Alter Global and Regional Surface Temperatures: 1889 to 2006, Geophysical Research Letters 35, L18701 (2008)
Huber and Knutti, Anthropogenic and Natural Warming Inferred From Changes in Earth’s Energy Balance, Nature Geoscience 5, 31 (2011).
N.P. Gillett et al., Improved Constraints on 21st-Century Warming Derived Using 169 Years of Temperature Observations, Geophysical Research Letters 39, L01704 (2012)
T.M.L. Wigley and B.D. Santer, A Probabilistic Quantification of the Anthropogenic Component of Twentieth Century Global Warming, Climate Dynamics 40, 1087 (2013).
G.S. Jones et al., Attribution of observed historical near‒surface temperature variations to anthropogenic and natural causes using CMIP5 simulations. Journal of Geophysical Research: Atmospheres, 118(10), 4001 (2013).
Debunking Denial.com The Science Deniers’ Toolbox
‘Sea, Ice, Snow, it’s All Changing’: Inuit Struggle With Warming World, Greg Mercer, The Guardian May 30 2018
Sinking Islands: Sea Level Rise is Washing Away Micronesia’s History, Patrick D. Nunn, Newsweek Nov. 9 2017
Wikipedia Climate Change in Africa
Wikipedia Climate Change in Bangladesh
J. Samson, D. Berteaux, B.J. McGill and M.M. Humphries, Geographic disparities and moral hazards in the predicted impacts of climate change on human populations, Global Ecology and Biogeography 20, 534 (2011).
Skeptical Science.com Is Extreme Weather Caused by Global Warming?
Debunking Denial.com S. Fred Singer All-Purpose Science Denier
B.D. Santer etal., Comparing Tropospheric Warming in Climate Models and Satellite Data, Journal of Climate 30, 373 (2017).
Z. Hausfather, Why Troposphere Warming Differs Between Models and Satellite Data, Carbon Brief Global Temperature June 2017.
