
December 10, 2023
I. introduction
In a previous post we have labeled the era we are living through as the Age of Misinformation. Misinformation spreads like a virus through social media “echo chambers,” communication networks in which participants pay attention to and propagate preferentially messages that reinforce their pre-existing biases. Social media companies are complicit in the partisan polarization driven by such echoes, because the companies profit when they keep users engaged with feeds that resonate, whether true or false, with each user’s own beliefs and preferences. If misinformation spreads like a virus, then entities that intentionally implant disinformation to sow distrust and extremism are waging something akin to biological warfare.
Echo chambers have been around for centuries. In the past they were local communities that spread gossip and conspiracy theories, which sometimes drove mass hysteria and irrational behavior, such as the Salem Witch Trials. And there are still local echo chambers today, when Americans’ mobility has led to clustering in many neighborhoods of like-minded individuals who tend to attend the same churches and view the same news shows and share lifestyles and political preferences, in what journalist Bill Bishop has termed The Big Sort in his 2008 book of that title. But the internet has greatly amplified the tendency by making it easy to search far and wide for people who hold similar beliefs and for information or “alternative facts” or rumors that support those beliefs. Echo chambers are no longer localized phenomena and the partisan polarization they drive threatens democracies around the world.
We have dedicated this blog site to fighting misinformation by presenting scientific data on issues relevant to public policy. But we understand that our impact is limited because people who distrust science are unlikely to visit this site. We are thus interested in a new research area that has arisen within the past decade or so, applying the mathematical and graphical tools of network science to analyze the structure, message propagation, and evolution of echo chambers, as well as possible algorithmic ways to disrupt the echo effect. A network is any ensemble of entities that interact with each other; the entities can be biological cells that interact via chemical transmission, computers that communicate electronically, humans who transmit infectious diseases, and so forth. In the graphical representation of networks, the entities that interact are represented by nodes (the blue dots in the generic network illustrated in Fig. I.1) and the interactions between them by links or edges (the straight-line connectors in Fig. I.1).

While social media enhance the formation of echo chambers, they also provide large volumes of publicly accessible data (such as tweets) to which one can apply network science. In large social media networks the density of nodes gets so great that diagrams like Fig. I.1 tend to collapse into dense arrangements of tiny dots, where the density represents the volume of intercommunications. The study of real-world social media echo chambers underpins the construction of models that can account for their formation and evolution and search for methods to disrupt them. In this post we will survey some recent work on the conditions for formation of echo chambers, on real-world examples associated with political “discourse,” on experiments and models revealing how misinformation spreads in segregated networks, and on initial suggestions of disruption methods.
II. conditions for echo chamber formation
Echo chambers influence human economic, as well as political and health, decision-making. Gilat Levy and Ronny Razin wrote a 2019 review of economics literature regarding echo chamber formation and impacts. Their review presents a useful analysis, separating the natural human tendency to form chambers – communicating networks of individuals with family ties, or similar outlooks, or politics, or religion, or ethnic origin, or professions, or life stages, etc. – from the conditions that make such chambers likely to support echoes: positive feedback loops in which communications within a segregated chamber limit exposure to only those messages that amplify pre-existing biases and often drive perceptions to extreme views, enhancing polarization in the broader community.
With regard to the formation of chambers, Levy and Razin point out that “people will choose to segregate due to complementarities in preferences or beliefs that enable better economic or political interactions.” One manifestation of such choices is Bill Bishop’s Big Sort, residential segregation that grew rapidly in the United States during the second half of the 20th century and paralleled the growth in income inequality. Such segregation has both positive and negative impacts. For example, one study has shown “that clusters of individuals with similar preferences will facilitate information transmission and will create complementarities in information and thus efficient decision-making.” On the other hand, “A related reason for segregation is that individuals or groups may seek to actively avoid knowledge or beliefs that are counter to their own.” The latter motivation is often behind religious segregation which, for example, has led to the separations of ultra-Orthodox Jews from the secular population in Israel, greatly complicating attainment of political consensus throughout the current century.
However, even in segregated chambers, “If individuals are rational and have correct beliefs about the nature of interactions in their network, then no echo effects will exist…there will be a limit to how polarized or extreme beliefs might be.” Echoes tend to form as a result of human cognitive biases. Levy and Razin break down these biases into three distinct, but related, cognitive effects, as follows – a useful distinction because some of these cognitive biases are likely to be more easily disrupted than others:
Correlation bias refers to an individual’s tendency to treat all incoming information as independent from all other incoming information. (A better label for this behavior would be “anti-correlation bias,” but we’ll stick with the Levy-Razin nomenclature.) This bias makes an individual into a “sitting duck” to absorb information from “astroturf” organizations – the faux grass-roots groups that spring up in many different locations to spread misinformation that starts from a small group of sponsors and a common set of talking points, but reaches consumers of the information from what seem to be many different directions. A current example in the U.S. that we have dealt with recently is the plethora of Moms for Liberty groups created around the country to implement the “anti-woke” agenda formulated by Christian Nationalist agitator Christopher Rufo, who seeks to sow “universal public school distrust.” When an individual remains ignorant of the common source of the misinformation that reaches him or her, he or she perceives the arrival of messages from many different directions as amplifying the “truth” of even implausible message contents: “If there’s so much smoke, there must be fire.”
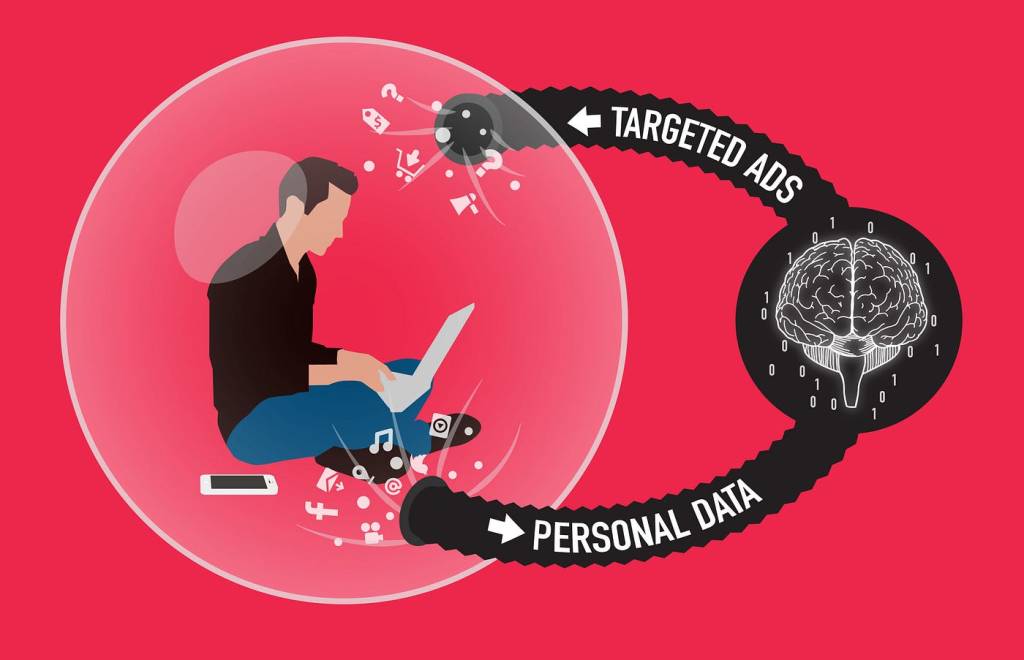
Selection bias refers to an individual’s attention being given only to a narrow set of contacts, ignoring others. Social media platforms such as Facebook and Twitter (now X) reinforce this tendency of individuals by imposing selection bias on their filtered feeds to users, sometimes without the user being aware of the filtering. The media platform algorithms use the personal data and interaction history they collect from your behavior to create a personalized “filter bubble” (see Fig. II.1), in which you are fed targeted ads (increasing the platform’s advertising revenue), targeted posts and targeted news items intended to maximize the time you spend on the platform. We will see in Section V that attempts to disrupt echo chambers generally work to overcome selection bias.
Confirmation bias is the one most often talked about, referring to humans’ enhanced interest and belief in information that confirms the individual’s prior beliefs and prejudices. Confirming information and appreciation from other users reacting to your posts trigger dopamine hits in your brain, which are exploited by the social media platforms in creating filter bubbles to keep you engaged. Confirmation bias is the most deep-seated of these three cognitive flaws in the human brain, and likely the most difficult to overcome.
These three cognitive biases are exploited by political campaigns, by social media platforms, by advertisers and agitators, to embed their desired viewpoints into the brains of at least a significant part of their audience. Levy and Razin also emphasize that while pre-existing beliefs may affect an individual’s choice to join a chamber, the prevalence of echoes may, in turn, influence the choice to stay in or leave such a chamber, or to participate in different chambers. It is such human choices that complicate the analysis of echo chamber effects.
III. real-world examples of echo chambers and issue polarization
Several research groups have applied network science analysis to huge volumes of Twitter (now called X) messages concerning specific political issues. Because Twitter message volume is strongly influenced by the presence of bots and retweets, researchers have to do some filtering of the raw datasets to produce meaningful results. Different research groups have chosen different approaches to this filtering. While one can quibble with the choices, the analyses reveal very clear evidence of echo chambers.
One particularly informative analysis, by Cota, et al., is based on a set of 12 million Twitter messages, sent during a 9-month period, exchanging opinions related to the controversial 2016 impeachment of former Brazilian President Dilma Rousseff. In order to focus on real two-way social interactions among users, these authors avoid retweets for most of their analysis. In order to reduce the impact of bots, they also focus on users who exchange messages in two-way communications (forming what they denote as the strongly connected component, SCC, of the overall network), since bots usually transmit far more messages than they receive. They follow the time evolution of tweets and of user positions. They assign a position value to each individual tweet of -1, 0, or +1 based on whether the hashtags used in the tweet are seen as pro-impeachment, neutral, or anti-impeachment, respectively. Then, they track the position value over time through multiple tweets from the same user and extract a time-averaged position value Pi between -1 and +1 for user i. The characterization of the network of users who exchanged at least 10 tweets about the impeachment is summarized in Fig. III.1.
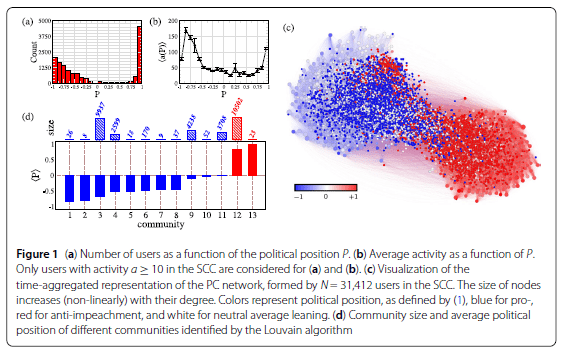
Figure III.1(a) plots the number of users who sent out at least ten tweets among the strongly connected component, as a function of the user’s time-averaged political position P. The paucity of users around the neutral position P = 0 already reflects a fair degree of partisan polarization regarding the impeachment. However, the polarization is more extreme for the anti-impeachment users, who are strongly peaked near P = +1, than for the pro-impeachment users spanning the spectrum of negative values. Frame (b) shows the average activity level, i.e., number of tweets sent, as a function of user position on the impeachment issue. Here, we see that the most prolific tweeters tend toward the opposite extremes of the partisan spectrum.
Figure III.1(c) is a standard form of network graph for networks containing a large number of nodes and a large volume of communications, with partisan polarization. Each of the 31,412 users in the strongly connected component is treated as a network node and represented by a dot in the diagram. Blue dots have pro-impeachment leanings and red dots have anti-impeachment leanings. A small scattering of white dots near the middle of the diagram represents the rare neutral users. The size of each dot is related to the degree of each node, i.e., the number of nearest neighbors with whom the corresponding user communicated directly, or equivalently, the number of edges connected to the node. Each node is surrounded immediately by its nearest neighbors. Nodes that are further removed communicate with the node in question only indirectly, via one or more intermediaries. The distance between any pair of nodes reflects the number of intermediate steps required (when retweets are considered) for a message sent by one of them to reach the other. In this way, the radius of the roughly circular region of blue dots, or of red dots, reflects the number of steps for messages sent by the high-degree nodes near the center to reach the less well-connected nodes around the periphery, including the very low-degree and moderate-position nodes in the peripheral, lighter-colored “shadow” regions in Fig. III.1(c). The distance between the blue and red circles, and the low density of the region between them, manifest the large number of steps that would be required for any message to span the partisan divide and are already indicative of echo chamber effects.
A careful analysis of the communications reveals 13 distinct sub-communities of users that exchange messages among themselves much more frequently than they do with members of other communities. The average political position <P> within each of these communities is plotted in Fig. III.1(d), along with the size (number of users) of each community. The two largest communities, each comprising about 10,000 users, are characterized by very strong anti-impeachment and moderately strong pro-impeachment leanings.
The most definitive hallmarks of an echo chamber come from analyses that gauge how well-aligned nearest communication neighbors are with each other’s political positions, and how well-aligned each user is with the tweets he or she receives. These correlations for the Rousseff impeachment tweets are probed in Fig. III.2. Frame (a) in this figure plots the political position of each user (along the horizontal axis) against the average position of the user’s nearest neighbors (vertical axis). Frame (b) is a similar plot, but in this case against the average position of tweets received by the user. In each frame, each contour represents a new step up in the number of users represented, with the color growing more intense as more users are represented by a given location on the graph. In plots such as these, echo chambers are manifested by a narrow alignment of the correlations along the diagonal from the lower left to the upper right corner of the graph, signifying that users interact directly nearly exclusively with other users of very similar opinions.

Figure III.2 shows that the anti-impeachment users are ensconced in a nearly impenetrable echo chamber located at the upper right corner of these plots. Users with extreme anti-impeachment positions communicate directly with and receive tweets from only other users with similarly extreme views. On the pro-impeachment side the echo chamber is more diffuse: even the most extreme users communicate with nearest neighbors who are mostly slightly more moderate and occasionally considerably more moderate, though still seldom neutral, in their views.
Cota, et al., also use the detailed Rousseff impeachment tweet network results to carry out simulations within the framework of infectious disease spreading models. They thus determine the spreading capacity of each user, i.e., the fraction of all users in the network likely to be influenced by either primary or secondary (retweet) contact with the user in question. The results in Fig. III.3 demonstrate that it is mid-strength pro-impeachment tweeters who are most likely to influence other, primarily pro-impeachment, users, and also who influence the widest range of other opinions, as represented by the root-mean-square spread <s> (red curve) of positions among users likely to be “infected” by the first user’s tweets. The many highly partisan anti-impeachment tweeters have the most limited spheres of influence, basically impacting only other users in their tight echo chamber.
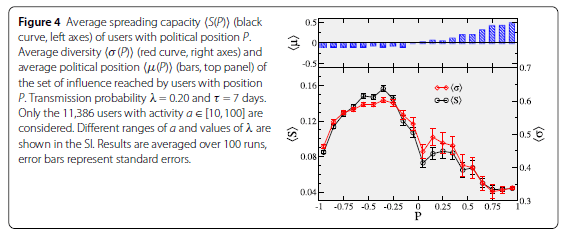
Figure III.3. Results of simulations carried out by Cota, et al., using the results of the Rousseff impeachment Twitter network analysis within the framework of an infectious disease spreading model. The average spreading capacity <S(P)> of users with political position P – i.e., the fraction of all users in the network likely to be “infected” by tweets sent by the user, either directly or through retweets – is shown by the black points and curve, referred to the left-hand axis. The average political position <μ> of the likely influenced users is plotted in the top portion, while the spread <σ> of positions influenced is reflected by the red points and curve, referred to the right-hand axis. (The λ and τ values specified in the figure text refer to parameters of the infectious-disease spreading model used, and “SI” refers to supplementary information posted along with the Cota, et al. paper.)
Two other research groups have brought the study of echo chamber dynamics closer to our home by analyzing and modeling U.S. political polarization. Wang, et al., have analyzed retweet statistics during the immediate aftermath of the first Presidential debate and the only Vice-Presidential debate during the 2016 U.S. Presidential election campaign. The network graphs of the retweet activity are shown for three different time periods following each debate in Fig. III.4. In these graphs, the color of nodes reflects their political leaning (red for support of the Republican candidate, blue for the Democratic candidate, and yellow for neutral or undecided) inferred from the content of the retweets, while their intensity and depth of color reflects the volume of their retweets. As seen in the figure, the overall network of tweeters is divided into two or three communities who mostly communicate and retweet among themselves, reflecting echo chambers.
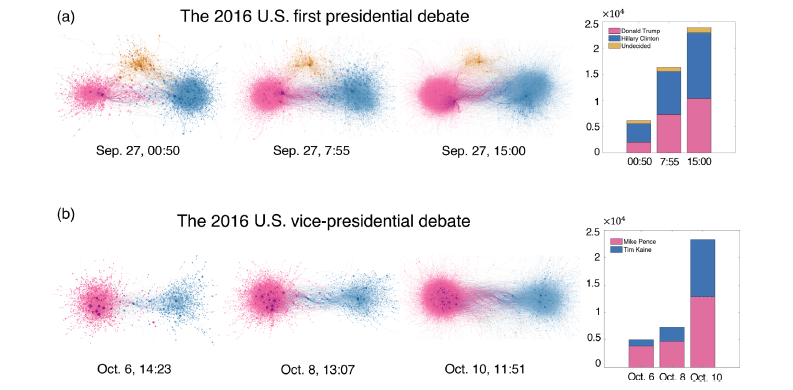
Over the course of one day following the first Presidential debate, the number of retweeters increases within each subgroup (see bar charts at the right of Fig. III.4), but the relative intensity of the yellow group decreases as some undecideds get absorbed by one candidate or the other and their retweet volume decreases. By the time of the subsequent Vice-Presidential debate the undecideds are essentially gone and we are left only with two well-separated, polarized echo chambers.
The observation of such real-world echo chambers, and particularly of their evolution over time, has inspired the construction of models capable of accounting for that evolution. The models are challenging because one has to find efficient ways to parametrize human decision-making. There are not yet consensus models and each team tends to introduce parameters appropriate to studying the aspects of echo chamber evolution that most interest them. The models are crude and useful mainly for extracting some qualitative insights. Wang, et al. adopt a multi-parameter, but still relatively crude, model to try to learn what features govern candidate preferences and echo chamber formation, such as seen in Fig. III.4. They start by assuming that each involved participant has a position strength initially distributed uniformly along the range from 0 to 1, where a neutral position corresponds to 0.5, while candidate positions occupy two fixed, but well separated, positions along that spectrum. At each time step in the simulations by Wang, et al., each user has the option of updating their position based on interactions with either the candidates or their peers, depending on a parameter characterizing user “open-mindedness” (i.e., the maximum deviation of position values from their own which they are willing to listen to) and the level of influence effort expended by each campaign.
In these simulations a user unwilling to listen to their first chosen peer can rewire their connection to a different peer. Their new position, if updated, can move toward the position of one or the other candidate, or toward the position of one of their peers, by amounts that are governed by other parameters. These options are then repeated at each subsequent iteration step until an equilibrium of candidate support levels is attained, with the possibility that some users will still remain uncommitted to either candidate when equilibrium is reached.
Wang, et al. find that the equilibrium network structure reached in their simulations depends strongly (and unsurprisingly) on the assumed universal level of open-mindedness of voters (which, of course, are hardly constant in reality from user to user or even over time for a given user). This sensitivity is reflected in Fig. III.5. At low values of open-mindedness, voters remain in separated echo chambers, including one (yellow) containing uncommitted voters and a satellite red community (below the primary red circle in Fig. III.5(c)) presumably comprising some of the most extreme red supporters. At moderate values, the uncommitted tend to end up by joining one side or the other, the satellite red community merges with the main red network group, but the two sides remain in separate echo chambers. Only at very high (probably unrealistic) levels of open-mindedness do red and blue voters join in one common network, where all users are susceptible to messages from all others.
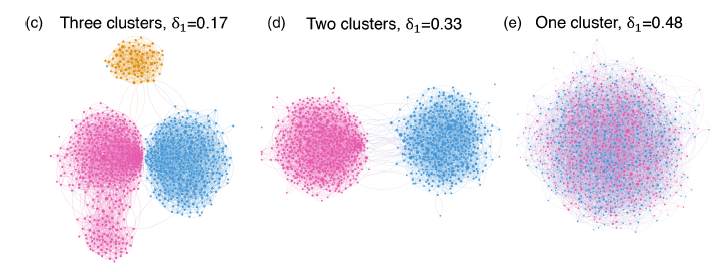
Figure III.5. Illustration of how the equilibrium network structure of voters in the simulations by Wang, et al., depends on the value they choose for their “open-mindedness” parameter δ1. At low values, users tend to remain in localized clusters, including one of undecideds and a relatively isolated red satellite community. At moderate values the undecideds end up getting subsumed by one or the other echo chamber and the satellite red community merges with the main red cluster, but the partisan divide between the two echo chambers appears to grow. Only at high “open-mindedness” values do the two echo chambers merge into one integrated network, with all users being willing to listen to all others.
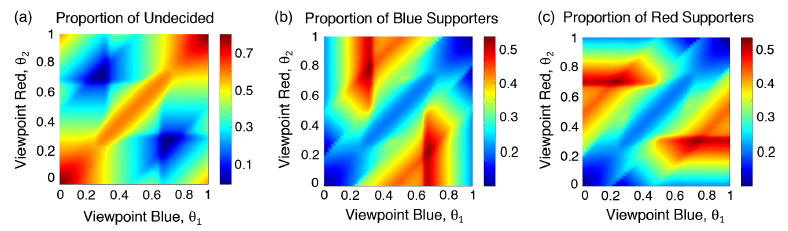
Another interesting finding from the Wang simulations is that there is a sweet spot for candidate positions on issues. This is illustrated in Fig. III.6, which indicates by color the percentage of voters who end up in each camp (undecided, blue, or red) as a function of the positions taken by the blue candidate (along the horizontal axis) and by the red candidate (along the vertical axis). If both candidates take similar positions (represented by the lower-left to upper-right diagonal), or both take extreme positions (near 0 or 1), undecideds remain very strong, as seen in Fig. III.6(a). The sweet spot exists when either candidate takes a position about halfway between neutral and extreme. When both take such positions, on opposite sides of the issue, voters tend to split between the two camps fairly equally, with few undecideds left. The sweet spot has been pretty much occupied by the two major-party candidates in most recent U.S. Presidential elections, with both candidates pushing to attract voters from the small percentage of remaining undecideds, but the situation may be shifting now as a result of radicalization within echo chambers, to be discussed further below.
Wang, et al. succeed in finding parameter values within their model that closely reproduce the evolution of voter preferences (determined from both retweet statistics and public polling averages) across the three Presidential debates during the 2016 campaign. But there is nothing in their model that is able to predict beforehand what the optimum parameter values might be. Furthermore, voter choices in real elections are based on more candidate qualities than their issue positions alone.
A quite different model of evolution in opinion-based communication networks has been developed by Evans and Fu, and applied to analyze the networks of communications within the U.S. House of Representatives over six decades. The Evans-Fu model borrows its fundamental hypothesis from Darwinian species evolution, in assuming that networks, like species, evolve to optimize their overall “fitness.” While biological fitness is determined by a species’ efficiency in reproducing and surviving threats from its local environment to live through reproductive years, Evans and Fu have to invent a fitness function for communication networks. They treat the “fitness” of any node for belonging in the network as the sum of three terms with adjustable parameters for the coefficients that determine the relative weighting of the three terms: (1) the absolute strength of the node’s opinion Xi, which varies from -1 (strongly opposed) to +1 (strongly in favor of whatever issue is under discussion); (2) the sum of all the node’s interactions with other nodes in the network, weighted by the strength of those interactions (CijXiXj); (3) the sum of all the node’s interaction strengths Cij. The first term tends to drive opinions toward extreme values. The second term favors agreement among users with similar opinions, by minimizing the negative contributions to the sum that arise from interactions with nodes of opposite opinion. The third term favors strong interactions with as many other nodes as possible.
As nodes exchange messages in the Evans-Fu model, each user’s opinion strength and interactions with other nodes can vary, and the authors track random variations in simulations where only changes that increase the overall network fitness (the sum of node fitnesses over all users) are followed. The simulations show that some values of the coefficients weighting each of the three terms lead to convergence of opinions, while others lead to segregation and echo chambers, and still others lead to partial segregation. A typical result when the coefficient determining the benefit of agreement far outweighs the benefit of connections is shown in Fig. III.7. If the initial opinions in the network are spread across the full spectrum, for a network equally mixed between red (X < 0) and blue (X > 0) nodes, then for these parameter values the overall network fitness increases as opinions become polarized over time and the network becomes largely, though not completely, segregated into two echo chambers. In contrast, if the benefit of connections far outweighs the benefit of agreement, then the network remains integrated and opinions tend to converge.

The combination of situations indicated in Figs. III.6 and III.7 may account for what seems to be the current trend in U.S. politics. Figure III.6 suggests that when two candidates take opposite issue positions, each about halfway between neutral and extreme, voters tend to end up in one or the other camp, with few left in the middle. Figure III.7 suggests that once echo chambers are formed in response to such candidates, internal communications among echo chamber participants tend to drive opinions toward extreme values over time. (This happens in the Evans-Fu simulations even if the coefficient determining the benefit of strong opinions, term (1) above, is weak.) As that happens, candidate positions also tend to become more extreme over time to remain in step with their echo chamber voters, especially given the U.S. primary election system, where echo chamber voters often dominate in choosing the nominee from their preferred party.
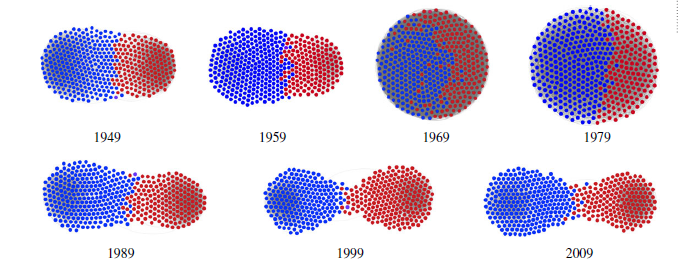
Evans and Fu apply their model to analyze communications within the U.S. House of Representatives over six decades. They adjust the relative benefit values for agreement vs. connections to best reproduce the archived voting records of all Congress members in each Congress. Their simulations then allow them to reconstruct a snapshot of the communication network structure for each Congress. Results for six different sessions from 1949 through 2009 are shown in Fig. III.8. Perhaps the most surprising result in the light of the present-day extreme partisan divide is the extent of integration in the network, especially in 1969, when Democrat (blue dots) and Republican (red dots) members maintained good communication paths to each other. There was more separation in prior decades and steadily growing segregation after 1990, as the benefit of agreement among communicators has come to outweigh the benefit of strong connections to many members.
IV. misinformation spreads in segregated networks
Segregated communication networks not only drive partisan polarization on issues, but they also facilitate the spread of misinformation. This has been demonstrated nicely in a recent social science experiment carried out by Stein, Kueschnigg, and van der Rijt. These researchers chose 1536 participants, equally divided between self-identified conservative vs. liberal political leanings. The participants were randomly assigned to one of 16 different communication networks, each comprising 48 conservatives and 48 liberals. The networks were artificially constructed so that each user had exactly six nearest neighbors with whom they could communicate directly, but the users were not told the political leaning of their neighbors. Eight of the networks were designed to be fully integrated and eight fully segregated, as illustrated in Fig. IV.1(A). Note that in these graphs the nodes are distributed around a circular ring, rather than throughout the full area of the circle, since there are no nodes with more nearest neighbors than others. It would take a maximum of eight steps of message propagation for a message from any node to reach the nodes furthest removed from it. Correspondingly, the diameter of the circles in these graphs is eight times larger than the average length of the edges between nearest neighbors.
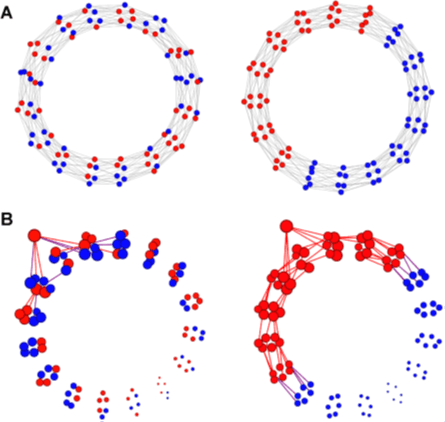
In each of the sixteen networks, 32 messages were implanted and their propagation was tracked. The messages were equally balanced between ones that would appeal to conservatives and to liberals, and also between true and false. The messages were chosen from research papers with which the participants were unlikely to be familiar, and to concisely report a finding or the opposite of a finding from that research. Examples of the messages of each type are shown in Table IV.1. The messages were also chosen to span a spectrum of plausibility. Conservative-leaning messages were seeded through one randomly chosen conservative participant in each network, and liberal-leaning messages through one randomly chosen liberal participant. Participants were instructed to pass along messages to their nearest neighbors only if they believed the message to be true, and otherwise to discard the message. Participants were never told the identity or political leaning of their nearest neighbors. The authors then tracked the propagation of each message through each network. Figure IV.1(B) illustrates the propagation of one particular false conservative-leaning message through each type of network.
| Liberal (L) vs. Conservative (C) lean | True (T) or False (F) | Message |
| C | T | On average, rich people are more likely to perform well on intelligence tests than poor people |
| C | T | Children born to married parents have slightly better health at age 5 than children born to cohabiting parents |
| C | T | In countries run by left-wing political parties, immigrants are more likely to be worse at speaking the official language of the new country |
| C | F | Police officers speak with equal respect to all community members, regardless of race, in stop-and-frisk encounters |
| C | F | US states with the death penalty have had much lower homicide rates throughout history as compared to US states without the death penalty |
| C | F | A vast majority of homosexual parents report worse relationships with their children than heterosexual parents |
| L | T | Human-induced CO2 levels in the air have resulted in increased chances of wildfires in California |
| L | T | The greater the immigrant diversity in a city, the higher the wages for white-collar jobs |
| L | T | The number of undocumented migrants attempting to cross the US-Mexico border has steadily declined over the past two decades |
| L | F | Affirmative action students from public universities graduate with better grades and in more prestigious fields of study than regular students |
| L | F | Cannabis use is not at all associated with any damage to adolescents’ cognitive functions – short or long term |
| L | F | Businesses owned by women are much more successful than comparable businesses owned by men |
Statistical results from the message propagation tracking for the sixteen independent networks are shown in Fig. IV.2. Frame A reveals that an individual participant politically aligned with an implanted false message has essentially the same probability (~36%) of sharing it with nearest neighbors in integrated as in segregated networks. That suggests that the network construction does not bias the further results. Frame B shows that, on average, an aligned participant has twice as high a probability to be exposed to a false message in the segregated vs. the integrated networks. Misinformation flows more easily through segregated networks and echo chambers.
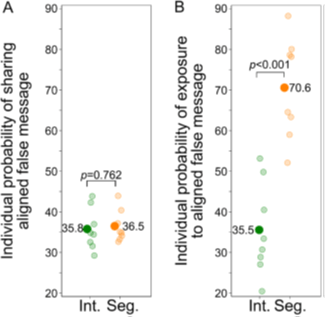
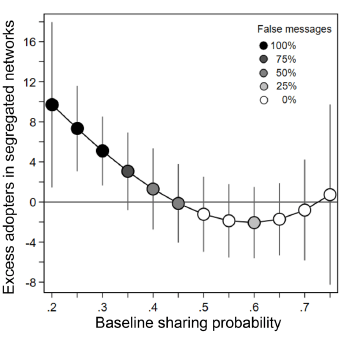
Figure IV.2. Results from message propagation tracking through the communication networks set up by Stein, et al. (A) The individual probability of a participant aligned with an implanted false message to share that message with nearest neighbors in integrated (green) and segregated (orange) networks. Each light dot represents one network, while the darker dots represent the average over eight networks. In both types of network, an aligned user had about a 36% probability to share a false message. (B) Similar to (A) but now plotting the probability for an aligned participant to be exposed to a false message in the two types of network. The average probability is twice as high in a segregated as in an integrated network. The p-values specified in frames (A) and (B) refer to the standard statistical test measuring the probability that differences between the green and orange distributions may be due to chance. (Right) The excess number of participants who share messages in segregated, compared to integrated, networks, plotted against the sharing probability of the messages. Shading of the points indicates the percentage of false messages in each bin of sharing probability, as per the legend included in the frame. The error bars represent the 95% confidence limits for each bin extracted from the statistics in this experiment.
Stein, et al. also tried to determine a “baseline sharing probability” p for each implanted message (this usage is distinct from the use of the symbol p in Fig. IV.2). They determined this from the fraction of all participants, independent of political leaning, who shared each message “in an independent experimental condition in which decision-making was monetarily incentivized to be truthful.” The 32 messages used varied from p = 0.22 to 0.77 and, as can be seen via the shading of points in the right-hand frame of Fig. IV.2, the sharing probability is strongly correlated with the plausibility of the message. As a function of that sharing probability, that right-hand frame plots the excess number of participants who shared the message in segregated compared to integrated networks. It is clear from Fig. IV.2 that the least plausible, and completely false, messages reach and are shared by significantly more participants in the segregated networks. The number of excess adopters for the false messages is significant, given that each network contains a total of only 48 users who lean toward the side favored by the false messages. In large social media echo chambers the number of people who are likely to get infected by misinformation can be enormous.
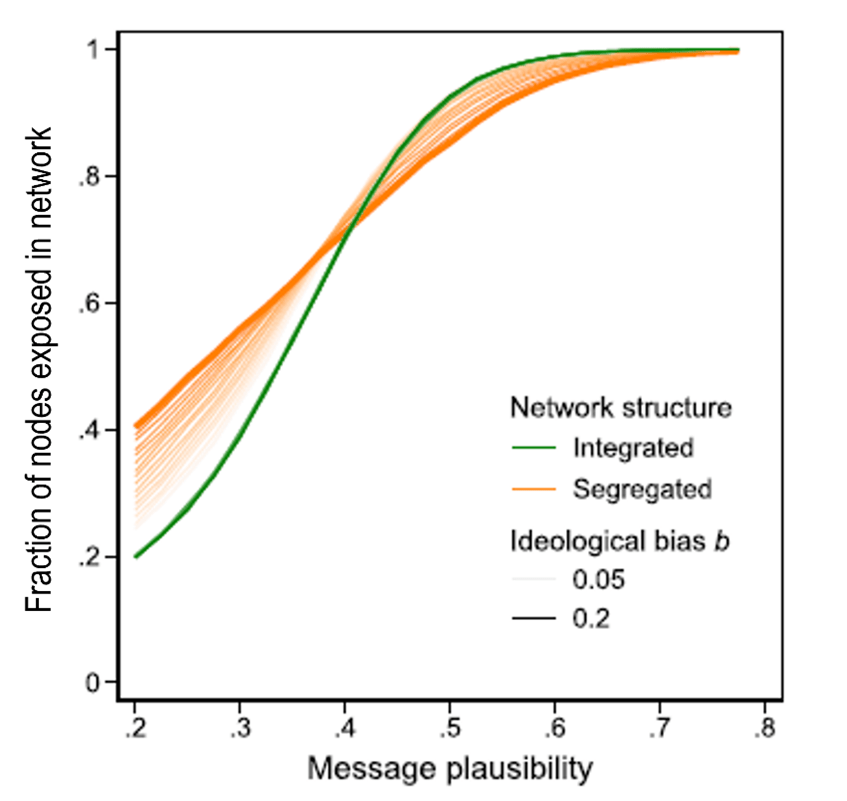
In order to generalize their findings to bigger networks, Stein, et al. introduce a very simple model of message sharing. They assume that participants in the network have a common magnitude b of ideological bias, so that for a message with intrinsic sharing probability (or plausibility) p, users ideologically aligned with the message content will share it with probability (p + b), while users ideologically opposed to the message content will share it with probability (p – b). They are then able to simulate for segregated and integrated networks of 96 nodes how the percentage of users exposed to a message will vary with the message plausibility. The result is shown in Fig. IV.3. For integrated networks the percent exposure is independent of the bias, since there are equal numbers of users with both political leanings. In segregated networks, implausible (mostly false) messages reach more participants while plausible (mostly true) messages reach fewer (because some of those plausible messages have an ideological leaning opposite to the segregated network participants), with the degree of difference from integrated networks depending on the magnitude assumed for the bias.
Stein, et al. treat false biased messages as akin to infectious viruses, with low-p messages corresponding to viruses with low transmission number R0 (the average number of individuals infected by each already infected individual), while high p corresponds to high R0. Network “nodes” that have the opposite bias to the message then act like vaccinated individuals; for a low p message, even a small number of such “vaccinated” individuals serves to halt the spread of the misinformation, while for high-p messages a higher percentage of nodes must have opposing bias to halt the spread. Thus, customers of opposing bias serve to provide some measure of “herd immunity” to misinformation. Echo chambers are like clusters of unvaccinated people subjected to an infectious virus with respect to misinformation.
V. models for disrupting echo chambers
As we have demonstrated in Sections III and IV, echo chambers tend to drive partisan polarization and the spread of misinformation, two poison pills for building consensus and for democracy. Unfortunately, the reinforcement of echo chambers currently enhances the bottom line for the large social media companies. A number of research groups around the world have therefore recently turned their attention, within the framework of network models, to building algorithms capable of disrupting echo chambers.
In order to disrupt echo chambers one must work to counteract the influence of the three human cognitive biases outlined in Section II. Correlation bias may be the easiest to overcome. In the age of AI it should be possible to program computers to search the web, social media, and published literature for the common ancestry of every partisan message and meme being shared. If social media users are exposed to a kind of genealogical chart that illustrates how each message and meme they are seeing originated, spread, and multiplied in subsequent information generations, they may be less inclined to treat every piece of information or misinformation they receive as independent of all others. They may also be able to identify the common ancestor who first implanted a given message, possibly for nefarious reasons of driving polarization. In contrast, confirmation bias is most difficult to overcome, because it is a basic feature of human brains.
Echo chamber research groups are focusing for now on developing algorithms to combat selection bias. For example, Currin, Vera and Khaledi-Nasab propose “a mechanism to avoid the formation of echo chambers and to disband those already formed by presenting each agent with input from a random selection of other agents’ opinions.” They refer to this perturbation on network communications as a “random dynamical nudge (RDN)…The ultimate goal of the RDN is not to homogenize divergent opinions but rather to increase dialogue across different positions based on content that might be ideologically slanted yet devoid of misinformation.” The proposal is motivated by economic research reported in a 2009 book by Thaler and Sunstein: Nudge: Improving Decisions About Health, Wealth, and Happiness. Thaler and Sunstein showed that the judgment of individuals can be heavily affected by such relatively gentle nudges, although recent reviews of the literature cast doubt on the effectiveness of such nudges.
Currin, et al. carry out simulations based on two different models of how opinions evolve within networks and for various prescriptions of how to deliver the RDN. Each agent in the network receives an individualized nudge that depends on the mean opinion from a random sample of agents chosen for that particular agent. The random sample is chosen for each agent without consideration of the agent’s own opinion. But the strength of the nudge delivered depends on the difference between the opinions of the agent and of the randomly selected sample. “The RDN introduced here could be considered as well-adjusted noisy input to the system which is determined by the collective dynamics of the network.” In a social media context the nudge might consist of adding to a user’s normal feed a small randomly selected sample of messages other agents are seeing on the same topic. Currin, et al. found effective depolarization of already segregated networks for such nudges of moderate strength, as revealed in Figs. V.1 and V.2.
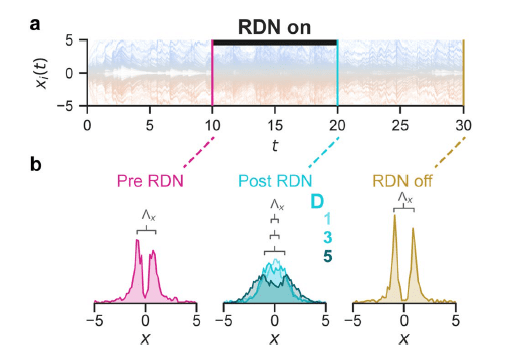
In Fig. V.1, we see that the polarized opinions characteristic of echo chambers are brought toward one another by the action of the RDN. But the opinions relax back over time toward polarization if the RDN is subsequently turned off. The effect of the RDN is revealed in more detail in Fig. V.2. Frames (a) and (b) of that figure indicate that nearly all opinions, with the exception of the most extreme ones on either side of the issue, become moderated by exposure to the individualized nudges. The extremists, however, dig in their heels and take on even more extreme positions when forced to “listen” to a random selection of others. Comparison of frames (c) and (d) shows how communications within the network are modified by the nudges: users who interact predominantly with other users of very similar opinion in the echo chamber phase tend to break up into subgroups after exposure to the RDN, while communications overall weaken.

In an alternative analysis based on analogies between social media networks and animal herding (and stampeding) behavior, Feldman, et al. come to a similar conclusion as Currin, et al.: “We demonstrate that a small portion of nomadic agents that widely traverse belief space can disrupt a larger population of stampeding agents.”
Matakos, et al. also consider approaches to overcome selection bias. In their approach, they seek to identify a small number of influential seed users within a network, to whom an algorithm or an administrator of the network can recommend a limited number of articles or messages in the hope that those messages may subsequently propagate through at least some of the network. In particular, their algorithm seeks the users and messages that maximize the diversity of exposure of users in the network. In order to analyze that problem mathematically, they must define a function to measure the diversity of exposure. This they do in the following way.
These authors assume that each person in the network has a position leaning on each issue discussed, and is exposed to messages from other users, with each message characterized by a message leaning on the issue. The leaning scale is defined to fall within the range from -1 (strongly opposed) to +1 (strongly agreed). They list all the message leanings to which user i is exposed in increasing order of message leaning from -1 to +1; the list also includes the endpoints -1 and +1 of message leaning. Then they define a penalty function g for each user as the sum of the squares of the differences in message leaning between successive entries into this message leaning list. If the list contains a very large number of message leanings spanning the entire range between the two extreme opinions, with roughly equal spacing in message leaning between successive entries, then g is close to zero. In the opposite extreme situation when a user receives only messages with the two extreme leanings, g = 4. Matakos, et al. then define a diversity of exposure function f = 1 – g/4, which can vary from 0 (poor diversity) to 1 (maximum diversity). Their algorithm aims to maximize the sum of exposure diversities over all users in the network.
As Matakos, et al. write: “To better understand the interplay between spread and diversity, observe that assigning articles that match the [seed] users’ predisposition is likely to result in a high spread but minimal increase of diversity, while recommending articles that are opposed to [seed] users’ predispositions, will likely result in high diversity locally but hinder the spread of the articles. This trade-off is central to the diversity-maximization problem we consider.” The algorithm they develop to find an approximate solution to this complex problem does better than competing algorithms in increasing average user diversity of exposure in a number of real-world networks considered, each characterized by some level of filter bubble: “Through experiments on real-world datasets, we show that our method performs well and scales to large datasets.” The largest of the real-world networks to which they apply their algorithm is a Twitter network comprising more than 480,000 nodes and more than 52 million edges (i.e., communication lines among nodes).
A number of other groups worldwide are currently attacking the same basic problem of finding ways to maximize diversity of exposure in social media networks, and thereby to disrupt echo chambers. Of course, any algorithms developed for this purpose must then be adopted by social media companies to have effect, an effect that is only in the interest of the social media company if it increases overall user engagement. The companies themselves currently have no financial incentive to increase diversity of exposure. But it would be good to find a way to give them this incentive before the destructive effects of echo chambers become irreversible.
VI. summary
When humans take part in segregated communication networks their cognitive biases make them susceptible to become entombed in echo chambers. Participants in echo chambers listen only to messages from other users with similar opinions or beliefs to their own, ignoring or rejecting input from users of significantly different opinions. In this post, we have reviewed recent analyses using the mathematical and graphical techniques of network science, which have confirmed that such echo chambers may act as positive feedback loops, driving partisan polarization and the spread of (often maliciously implanted) misinformation, including conspiracy theories. In extreme cases when echo chamber communications center on politics and public policy, the polarization and misinformation impede consensus and compromise and threaten democracies.
It is thus important to develop methods to disrupt the formation and persistence of echo chambers. This is especially true for social media platforms that currently contribute to echo chamber formation because they profit when they keep users engaged by preferentially feeding them input that confirms their biases and generates more advertiser clicks. We have reviewed a few recent attempts by network scientists to construct algorithms that would overcome user and platform selection biases, which normally impose blinders on users’ perceptions of available information. The basic idea of these algorithms is to add to a user’s normal feed a modest variety of messages and articles that are either chosen randomly from other network users or intentionally recommended to selected influential seed users in the hope that the recommended information will then spread organically throughout much of the network.
This research is at an early stage, but there is an urgent need to produce algorithms that social media companies are willing (or encouraged by public policy) to adopt, before the damage caused by “us” vs. “them” echo chambers becomes irreversible. In addition to adopting algorithms that disrupt selection bias, it is desirable to provide financial disincentives for spreading misinformation. It would be interesting, for example, to see at least some social media companies try out an alternative business model in which, instead of relying on advertising revenue, they charge users a baseline monthly fee for using the service, much like video streaming services do. The platform would be held responsible for tagging, while not deleting, blatant misinformation; however, the monthly fee for any user would be automatically incremented for each item of labeled misinformation they post or send to others. Promoters of tagged messages would be free to sue the company for damages if they feel their posts are wrongly tagged, but would be held responsible for paying the social media company’s legal fees if they were unable to convince a court that their content was improperly labeled. Even a democracy that prides itself on freedom of speech might improve its longevity if (to riff on George Orwell’s Animal Farm) all speech were free but some (patently false) speech were more costly than others.
references:
G. Levy and R. Razin, Echo Chambers and Their Effects on Economic and Political Outcomes, Annual Review of Economics 11, 303 (2019), https://www.annualreviews.org/doi/abs/10.1146/annurev-economics-080218-030343
https://debunkingdenial.com/how-to-tune-your-bullshit-detector-part-i/
B. Bishop, The Big Sort: Why the Clustering of Like-Minded America is Tearing Us Apart (Houghton Mifflin Harcourt, 2008), https://www.amazon.com/Big-Sort-Clustering-Like-Minded-America/dp/0618689354
Wikipedia, Network Science, https://en.wikipedia.org/wiki/Network_science
A. Galeotti, C. Ghiglino, and F. Squintani, Strategic Information Transmission Networks, Journal of Economic Theory 148, 1751 (2013), https://andreagaleottiblog.files.wordpress.com/2017/03/strategicinformationdiffusionnetworks.pdf
Wikipedia, Astroturfing, https://en.wikipedia.org/wiki/Astroturfing
https://debunkingdenial.com/the-desperation-of-book-bans-part-ii-the-surge-in-u-s-book-bans/
Wikipedia, Moms for Liberty, https://en.wikipedia.org/wiki/Moms_for_Liberty
Wikipedia, Christopher Rufo, https://en.wikipedia.org/wiki/Christopher_Rufo
W. Cota, S.C. Ferreira, R. Pastor-Satorras, and M. Starnini, Quantifying Echo Chamber Effects in Information Spreading over Political Communication Networks, EPJ Data Science 8, 35 (2019), https://epjdatascience.springeropen.com/articles/10.1140/epjds/s13688-019-0213-9
Wikipedia, Impeachment of Dilma Rousseff, https://en.wikipedia.org/wiki/Impeachment_of_Dilma_Rousseff
X. Wang, et al., Public Discourse and Social Network Echo Chambers Driven by Socio-Cognitive Biases, Physical Review X 10, 041042 (2020), https://journals.aps.org/prx/abstract/10.1103/PhysRevX.10.041042
T. Evans and F. Fu, Opinion Formation on Dynamic Networks: Identifying Conditions for the Emergence of Partisan Echo Chambers, Royal Society Open Science 5, 181122 (2018), https://royalsocietypublishing.org/doi/pdf/10.1098/rsos.181122
https://debunkingdenial.com/evaluating-electoral-reform-proposals-part-i-redistricting/
J. Stein, M. Keuschnigg, and A. van de Rijt, Network Segregation and the Propagation of Misinformation, Scientific Reports 13, article #917 (2023), https://www.nature.com/articles/s41598-022-26913-5
Wikipedia, P-Value, https://en.wikipedia.org/wiki/P-value
https://debunkingdenial.com/natural-herd-immunity-a-really-bad-idea/
C.B. Currin, S.V. Vera, and A. Khaledi-Nasab, Depolarization of Echo Chambers by Random Dynamical Nudge, Scientific Reports 12, article #9234 (2022), https://www.nature.com/articles/s41598-022-12494-w
R.H. Thaler and C.R. Sunstein, Nudge: Improving Decisions About Health, Wealth, and Happiness (Penguin Books, 2009), https://www.amazon.com/Nudge-Improving-Decisions-Health-Happiness/dp/014311526X
M. Osman, Does ‘Nudge Theory’ Work After All?, BBC, August 8, 2022, https://www.bbc.com/future/article/20220804-does-nudge-theory-work-after-all
P. Feldman, A. Dant, and W. Lutters, This One Simple Trick Disrupts Digital Communities, in 2018 IEEE 12th International Conference on Self-Adaptive and Self-Organizing Systems, https://ieeexplore.ieee.org/abstract/document/8614279?casa_token=oD5G6_LR_hcAAAAA:vP3p0UEH-b3Gwtlb2ml1Jc9Pd3CJDCH3AEetl0WDkP0SzLgfOf1DnbHnEIGIYHMr5qY4tJv4
A. Matakos, C. Aslay, E. Galbrun, and A. Gionis, Maximizing the Diversity of Exposure in a Social Network, arXiv:1809.04393v2. https://arxiv.org/pdf/1809.04393.pdf
