
August 28, 2019
The holy grail of most science deniers is science suppression. The task facing industries fearing public policy regulation is easier if no research data exists to evaluate proposed solutions than that of inventing a counter-narrative to consistently misrepresent abundant data. In the cases of climate change and stratospheric ozone depletion, described in other posts on this site, eliminating most research is a tall order: the problems are global in nature, and ample research can be carried out in other countries even if research funding in the U.S. is drastically cut. But in the case of gun violence, many of the problems, public health impacts and causes are uniquely American. Consequently, the U.S. gun manufacturing industry, following the leadership of their lobbying collective the National Rifle Association (NRA), has had remarkable success in approaching this holy grail, by suppressing the political will to provide federal funding for relevant research that might illuminate the efficacy of various proposed policy solutions.
In this post, we will review how the NRA and its political allies have managed for decades to suppress funding for research on gun violence. But as mass murders and firearm fatalities in the U.S. mount rapidly, the tide is now turning. We will also survey what we are beginning to learn from the now emerging research. And for contrast, we will provide reminders of the tremendous successes achieved for other health hazards as a result of epidemiologic research into the underlying human behavioral linkages and causes.
1. Suppressing Research Funding
The link between tobacco smoke and lung cancer is the poster child for the striking success of epidemiology research and government action in changing the behavior of Americans to mitigate a leading public health hazard. Figure 1 shows the history of cigarette smoking frequency in the U.S. beginning in 1900. Cigarette consumption increased very rapidly during the first half of the 20th century, and especially during the World Wars, fueled by an aggressive tobacco industry marketing campaign. But the incidence of lung cancer grew similarly rapidly, lagging behind the curve of smoking incidence by about 20 years. The trend led to a number of large-sample research studies of the incidence of lung cancer among smokers vs. non-smokers. By mid-century the evidence of a linkage was well established.
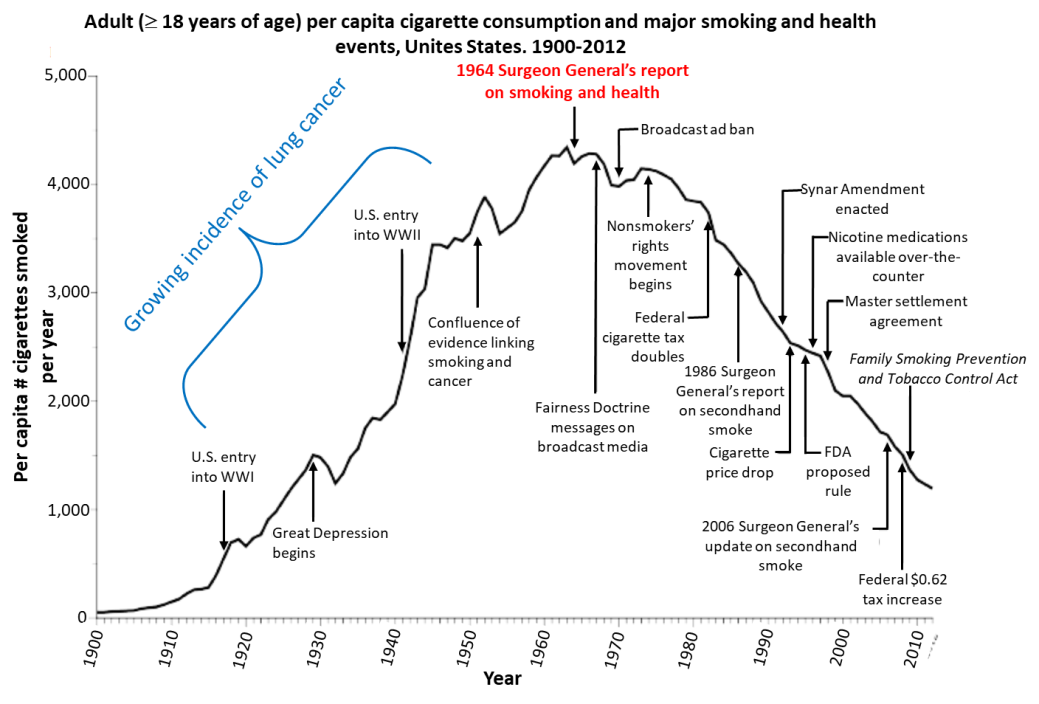
The tipping point for changes in public behavior came with the publication of the 1964 Surgeon General’s report on smoking and health, with its clear warning of the strength of the linkage. Cigarette consumption then fell during the second half of the century, as rapidly as it had risen during the first half, aided along the way by various further federal and state government actions, some of which are noted in Fig. 1. The payoff for these behavioral changes is seen in Fig. 2 in the trend of American fatalities from lung cancer. The lung cancer trend (red curve) is unlike that for any other form of cancer, but bears a striking similarity, with a 25-year time lag, to the smoking consumption rate seen in Fig. 1.

During the second half of the 20th century, the tobacco industry pioneered many of the elements of the science deniers’ toolbox in forming their own research institutes and lobbying campaigns to generate a counter-narrative combating the Surgeon General’s message of the dangers of smoking. But they launched these efforts too late in the game; the implications of the epidemiologic research were already very clear by the time their efforts got under way.
The U.S. gun manufacturing industry has attempted to absorb the lessons they learned from the tobacco industry’s ultimate failure to keep Americans buying their products. They sensed early on the danger to their industry of allowing the federal government to treat gun violence in the U.S. as a public health menace and lobbied strenuously to nip research funding in the bud. The NRA’s Institute for Legislative Action explains their resistance this way:
“Gun control supporters in the public health field claim that gun violence is an ‘epidemic,’ but gun violence is alien to most people’s experiences and the nation’s murder rate has been cut by more than half since 1991, and in 2013 fell to perhaps an all-time low, as Americans’ firearm acquisitions have soared.”
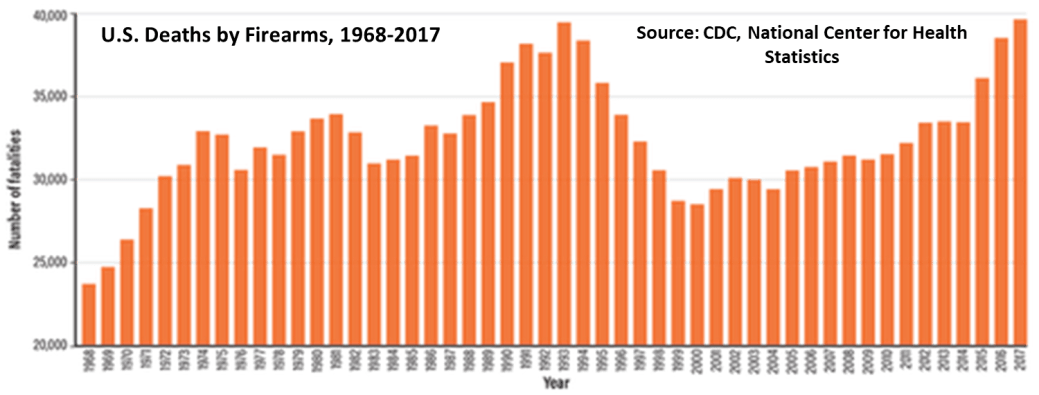
The claims upon which this explanation is based are contradicted by evidence. Figure 3 shows the statistics maintained by the National Center for Health Statistics of the Centers for Disease Control and Prevention (CDC) for the number of U.S. deaths by firearms from 1968 through 2017. It is true that there was a temporary peak in gun deaths in the early 1990s, when the NRA got seriously to work to suppress gun violence research funding. But the fatality rate in recent years has risen rapidly to nearly 40,000 per year and threatens to overtake that 1990s peak. And in contrast to the NRA claim that “gun violence is alien to most people’s experiences,” an extensive 2017 Pew Research survey of American attitudes toward guns reveals that just about half of all Americans have either been shot themselves or know someone who has been shot. When the category is expanded to include personal knowledge about intimidation with a gun, the proportion is well over half of Americans. The “epidemic” is real.
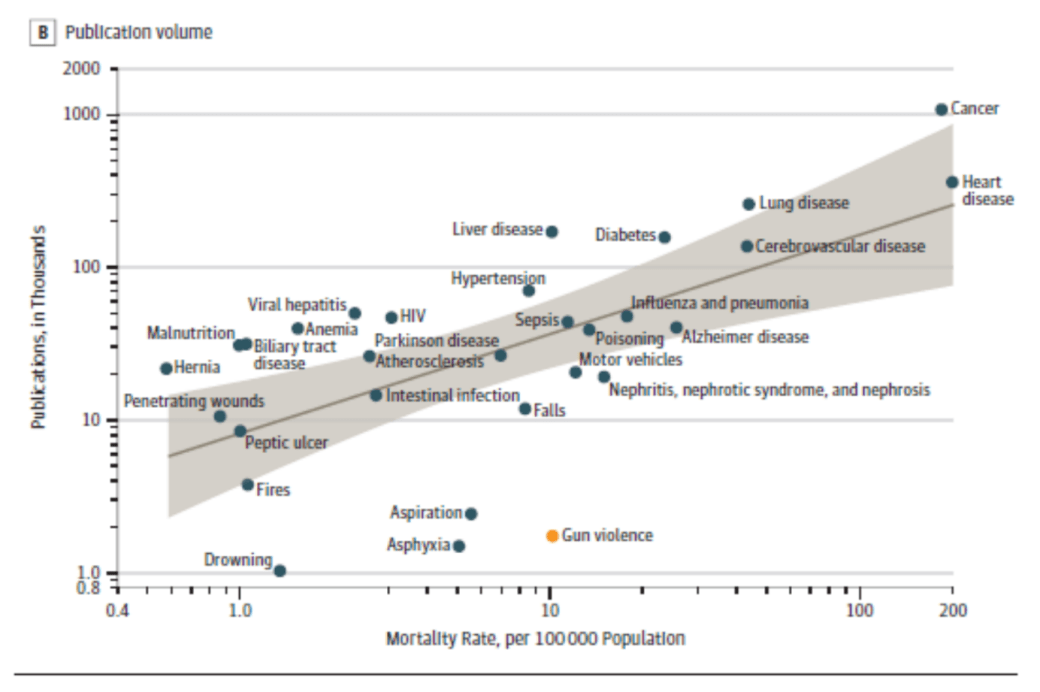
And yet, despite gun violence being identified as one of the leading causes of death in the U.S., the quantity of research that has been done on its root causes and behavioral linkages pales in comparison to nearly all of the other leading health hazards. This fact is illustrated in Fig. 4 with data compiled in a recent research letter to the Journal of the American Medical Association. The figure shows the correlation between U.S. mortality rate for the 30 leading causes of death and cumulative federal funding for related research (frame A) and number of research publications (frame B) during the period 2004-2015. The shaded band in each frame illustrates a general trend: the more deadly the hazard, the more plentiful the research regarding potential cures or mitigations. But research on gun violence (gold-colored point in each frame) falls below this trend by one to two orders of magnitude!

The NRA’s success in engineering this paucity of research is a tale of two amendments. NRA lobbying on this subject was particularly triggered by a 1993 publication in the New England Journal of Medicine that resulted from research funded by CDC grants. By analyzing statistics on homicides that occurred within the homes of victims in three metropolitan counties, Arthur Kellermann and his co-authors concluded that keeping a gun in the home increased the risk of homicide within the home by a factor of 2.7. In particular, “virtually all of this risk involved homicide by a family member or intimate acquaintance.” The NRA labeled the publication of such research as a biased attempt to advocate for gun control in opposition to the 2nd amendment to the U.S. Constitution, and they lobbied strenuously to eliminate the CDC’s National Center for Injury Prevention and Control, which had funded the research.
The U.S. Congress compromised: rather than eliminating the entire Center, lawmakers approved a narrowly written amendment introduced by Rep. Jay Dickey to the 1996 Omnibus Appropriations bill. Dickey was a Republican Congressman from Arkansas. The Dickey Amendment mandated that “none of the funds made available for injury prevention and control at the Centers for Disease Control and Prevention (CDC) may be used to advocate or promote gun control.” The Appropriations Bill furthermore “took $2.6 million from the CDC’s budget — the amount the CDC had invested in firearm injury research the previous year — and earmarked the funds for prevention of traumatic brain injury.” As of this date, the Dickey Amendment has remained an explicit part of Congressional CDC appropriations in each subsequent year. Furthermore, under the Consolidated Appropriations Act of 2012, the language of the Dickey Amendment has been applied as well to funding via the National Institutes of Health (NIH).
Mark Rosenberg, who then headed the National Center for Injury Prevention and Control, has described the Dickey Amendment as “a shot fired across the bow” at CDC researchers who wanted to research gun violence. It was not possible for researchers to know beforehand if their studies might or might not indicate that regulating gun ownership would reduce gun violence, but they could be sure that if they did, the NRA would label the research as disallowed advocacy for gun control. In a 2012 article in the Journal of the American Medical Association, Arthur Kellermann notes: “Precisely what was or was not permitted under the clause was unclear. But no federal employee was willing to risk his or her career or the agency’s funding to find out. Extramural support for firearm injury prevention research quickly dried up.” To make the point clearer, Rosenberg – who was quoted in 1994 as saying “We need to revolutionize the way we look at guns, like we did with cigarettes” – was fired from his job in 1999.
A further impediment to gun violence research, promoted by the NRA, was enacted by Congress in 2003 via an amendment introduced by Republican Todd Tiahrt of Kansas to the Justice Department appropriations bill. The Tiahrt Amendment “prohibits the National Tracing Center of the Bureau of Alcohol, Tobacco, Firearms and Explosives (ATF) from releasing information from its firearms trace database to anyone other than a law enforcement agency or prosecutor in connection with a criminal investigation. This precludes gun trace data from being used in academic research of gun use in crime. Additionally, the law blocks any data legally released from being admissible in civil lawsuits against gun sellers or manufacturers.” Prior to 2003, the public availability of such data had allowed tracing guns purchased out-of-state to commit crimes in states with more restrictive licensing laws, as well as the identification of particularly egregious firearm stores. For example, a study carried out by staff at the Johns Hopkins Bloomberg School of Public Health had found that “roughly 1% of all gun stores in the country accounted for more than half of the crime guns the ATF traced in the late 1990s.”
The spate of mass murders carried out with firearms over the past several years in the U.S. has begun to trigger pushback against these limitations on gun violence research. Late in his life (he died in 2017), Jay Dickey regretted his earlier role as NRA point-man in promoting the 1996 Dickey Amendment. In 2012 he joined forces with his old nemesis Mark Rosenberg to pen a Washington Post op-ed piece in the wake of the mass shooting in a movie theater in Aurora, Colorado. Their column concluded:
“We were on opposite sides of the heated battle 16 years ago, but we are in strong agreement now that scientific research should be conducted into preventing firearm injuries and that ways to prevent firearm deaths can be found without encroaching on the rights of legitimate gun owners. The same evidence-based approach that is saving millions of lives from motor-vehicle crashes, as well as from smoking, cancer and HIV/AIDS, can help reduce the toll of deaths and injuries from gun violence.
Most politicians fear talking about guns almost as much as they would being confronted by one, but these fears are senseless. We must learn what we can do to save lives. It is like the answer to the question ‘When is the best time to plant a tree?’ The best time to start was 20 years ago; the second-best time is now.”
After the Sandy Hook School shooting incident in 2012, President Obama asked Congress to appropriate $10 million for gun violence research, but Congress refused. Obama nonetheless directed the CDC and other federal agencies to “conduct or sponsor research into the causes of gun violence and the ways to prevent it.” In describing a CDC study carried out in response, an agency spokeswoman said “it is possible for us to conduct firearm-related research within the context of our efforts to address youth violence, domestic violence, sexual violence, and suicide. But our resources are very limited.”
After several years of unsuccessful attempts to remove the Dickey Amendment from federal appropriations bills, Congressional Democrats made a small bit of progress in 2018, in response to the mass shooting at the Stoneman Douglas High School in Parkland, Florida. While the Dickey Amendment remains in the 2018 Omnibus Appropriations Bill, the accompanying report contains language clarifying that CDC can indeed conduct research into gun violence, as long as it doesn’t specifically advocate for gun control. However, that bill still contained no funding for CDC gun violence research. In 2019 the House of Representatives, now under Democratic leadership, has included $50 million for gun violence research – to be split evenly between CDC and NIH – in its appropriations bill for the Departments of Labor, Health and Human Services, and Education. It remains to be seen if that funding will survive a budget deal with the U.S. Senate, now in the wake of the latest (August 4, 2019) mass shooting incidents in El Paso, Texas and Dayton, Ohio.
But in the absence of federal funding, several private foundations and wealthy individuals have recently stepped forward to provide some support for gun violence research in the U.S. This includes billionaire and former New York City mayor Michael Bloomberg, who supports research through the organization Everytown for Gun Safety and through his sponsorship of endowed faculty positions within the Johns Hopkins Center for Gun Policy and Research. It also includes Arnold Ventures, which has announced $20 million in grants for gun violence research, to be administered by the RAND Corporation, and health care provider Kaiser Permanente. In addition, several states have begun to make small investments in gun violence research. These efforts are leading to some of the data we will discuss in Section 4 of this post.
The existence of these privately and state-funded efforts has allowed the NRA to dispute the notion that it has acted to suppress science on gun violence. An NRA spokesman recently said: “Anyone who thinks there’s a lack of researchers studying firearms has been ignoring the headlines. The fact is a number of studies are released every year. While most are tainted with preconceived outcomes in search of supporting data, there is plenty of funding in that arena.” At the same time as they claim there’s no shortage of research, the NRA scoffs at the lack of evidence behind a Bloomberg-sponsored course on “Evidence-based policies to prevent gun violence.” Despite the NRA’s crowing, there is some relevant evidence about effective gun policies beginning to emerge. We will review this so far sparse evidence in Section 4 along with the needs for more definitive future studies, if the U.S. is to have a chance of curtailing its epidemic of gun violence.
2. Contrast with Vehicle-Related Deaths
It is instructive to compare the recent history of U.S. deaths from gun violence vs. motor vehicle crashes. The data compiled in Fig. 4 indicate that these two classes of injury-related deaths are comparable in overall mortality rate. In particular, these are the two most prevalent causes of death among U.S. children and adolescents. However, federal research funding in the current century has been about 20 times higher for probing the causes of vehicle deaths. In contrast to the restrictions on data availability for firearm deaths, the National Highway Traffic Safety Administration tracks and makes publicly available all sorts of details about vehicular accidents and injuries. Researchers use these data to search for patterns that can guide effective legislation. What has that healthier funding level actually accomplished?
CDC statistics for the 21st century on the leading causes of deaths among U.S. children and adolescents are shown in Fig. 5. The most striking change over the past two decades has been the reduction by about a factor of two in the rate of deaths from motor vehicle crashes. This reduction has been achieved despite an overall increase in the number of U.S. vehicles and in annual vehicle miles traveled. It has been achieved by investing in behavioral and legislative solutions whose effectiveness was indicated by epidemiologic research. The solutions include “the widespread adoption of seat belts and appropriate child safety seats, the production of cars with improved safety standards, better constructed roads, graduated driver-licensing programs, and a focus on reducing teen drinking and driving.”

For example, all 50 U.S. states have, by the beginning of this century, adopted some form of graduated driver-license programs for young drivers. This trend was a response to research that revealed that 16-year old drivers had ten times the risk of getting into a vehicle crash as older drivers, and that those accidents happened most often at night and while driving unsupervised with other teens. The graduated licensing programs currently in effect generally include three stages: a learner stage, where driving must be supervised, culminating in a road test; an intermediate stage, in which unsupervised driving is limited in high-risk situations; and a full privilege stage in which a youth can obtain a standard driver’s license. All states except Vermont restrict nighttime driving, while 46 states plus the District of Columbia restrict the number of passengers allowed, during the intermediate stage. 38 states and D.C. ban all cell phone use by novice drivers.
While progress has been impressive, Fig. 6 indicates that the U.S. still needs further improvements to reach the lower mortality rates associated with vehicle crashes in other high-income countries. The data in Fig. 7 suggest some places to look for those improvements, since the vehicle-crash mortality rate is nearly three times as high in rural as in urban counties. But as shown in frame B of Fig. 6, the discrepancy with other countries is far greater in the case of firearm-related deaths among youths. And here (see Fig. 7), the mortality rate is essentially the same in rural, urban and suburban counties. The experience in the case of motor vehicle injuries suggests that what is needed for firearm injuries is much more robust data sharing and epidemiologic research. It also suggests that there is much to learn from a survey of results obtained with a variety of state laws.


3. Statistics on Gun Deaths, Gun Ownership and Gun Laws
What do we currently know about the nature of gun-related deaths, injuries, gun ownership and the effectiveness of gun laws among U.S. states? As seen in Fig. 8, roughly 60% of firearm deaths are suicides. Most of the rest are homicides, and the homicide rate has shown an ominous rapid rise over the past several years. Roughly 3% of U.S. firearm deaths are classified as unintentional, shootings by law enforcement, or of undetermined origin. The rate of firearm injuries appears to be about three times as great as the rate of fatalities, but is, remarkably, not very accurately monitored by CDC or other U.S. agencies. The injuries are dominated by assaults and unintentional shootings. Self-harm – that is, failed suicides – is uncommon with firearms, and accounts for only a few percent of gun-related injuries. This breakdown is useful to keep in mind, because the optimal preventive measures may differ among the different types of gun violence.

Mass shooting incidents account typically for no more than 1–2% of all homicides. It is difficult to pin down this percentage more precisely because there is no consensus definition of what constitutes a “mass shooting.” Utilizing the FBI definition of a single incident in a single location in which a shooter kills four or more other people, Krouse and Richardson have further subdivided the category into “mass public shootings” that occur in public locations and are indiscriminate in nature, “familicide mass shootings” in which the majority of victims are members of the offender’s family and the incident is unconnected to another criminal activity, and “other felony mass shootings” connected to other criminal activity. The breakdown of fatalities among these three classes of mass murder from 1999 to 2013 is shown in Fig. 9. Mass shooting fatalities have spiked since 2013, fueled significantly by six of the ten deadliest mass public shootings in U.S. history: San Bernadino (14 fatalities) in 2015, Orlando nightclub (49) in 2016, Las Vegas (58) and Sutherland Springs, Texas (26) in 2017, Parkland, Florida (17) in 2018 and El Paso (22) in 2019. While mass public shootings continue to account for a minor fraction of all U.S. homicide firearm fatalities, they receive the lion’s share of news coverage due to the terrifying, random, and sometimes politically motivated nature of the fatalities.

The firearm homicide rate in the U.S. is very much (typically by a factor of 20 or more, see Fig. 6) higher than that in other high-income countries, but as shown in Fig. 10, is exceeded in various low-to-middle income countries. In contrast, the firearm suicide rate in the U.S. is the highest in the world, as also seen in Fig. 10. The rate of gun-related fatalities also varies enormously – by an order of magnitude – among the 50 U.S. states. It is relevant to determine whether that variation is correlated with differences among the states in the rates of gun ownership or the stringency of gun laws.

One measure of the NRA’s success in suppressing evidence is that there is no very reliable count of how many firearms are owned by U.S. inhabitants. The number most often quoted, and represented in Fig. 11(a), is obtained by adding up all the guns manufactured in and imported to the U.S. and subtracting the number exported from the U.S. These data are available from the Bureau of Alcohol, Tobacco, Firearms and Explosives (ATF). This count in 2013 suggested that 317 million U.S. inhabitants cumulatively owned a total of 357 million firearms, or more than 1.1 guns for every man, woman and child. But presumably, not all the guns ever manufactured in the country are still in circulation and usable condition. A 2015 survey of gun owners carried out by researchers from Harvard and Northeastern Universities lowered the above estimate to 265 million guns in usable condition, or about 0.8 per capita.
The dramatic increase in inferred gun ownership seen in Fig. 11(a) between 2007 and 2013 mirrors a dramatic increase (Fig. 11(b)) in the number of firearms manufactured in the U.S. However, a variety of public surveys indicate that the percentage of U.S. households that own guns has remained pretty constant at about 42% for at least the past four decades. Thus, any increase in guns per capita most likely reflects growing numbers of guns owned by individual households. Indeed, the 2015 Harvard-Northeastern survey suggested that 13% of individual gun owners – corresponding to only 3% of all U.S. inhabitants – own 50% of the country’s civilian guns! That would imply that those 3% each own an average exceeding 13 firearms apiece.

Since the Tiahrt Amendment discussed in Section 1 forbids public accessibility to information tracing guns from manufacturers to sellers to owners, the estimates that inform Fig. 11 cannot be used to determine statistics on gun ownership in individual states. The best state-by-state information available comes from ATF statistics on the number of registered firearms within each state. But the most dramatic conclusion from those data is that most U.S. guns must be unregistered. The state (Wyoming) with the highest per capita rate of registered gun ownership in 2017 has 0.23 firearms per inhabitant, and all other states have less than 0.1 per inhabitant. Those rates are to be compared with the best estimates above, indicating that the average U.S. ownership of all firearms, registered or unregistered, is at the level of 0.8-1.1 per inhabitant. Nonetheless, the rates of registered firearm ownership are the best data we have to look for any correlation with gun fatality rates per state.
Figure 12 appears to show a substantial correlation between state-by-state firearm fatality rates and rates of registered gun ownership. But since we have no information on how much the registration rate varies from state to state, the data in Fig. 12 should be taken with a grain of salt. In particular, Wyoming is such an outlier in the per capita registered gun ownership statistic that it must be assumed to reflect, at least in part, an anomaly in the registration of firearms in comparison with other states.

An alternative way to look for correlations with fatality rate is to focus on the wide variation in gun laws across the 50 states. Former Congresswoman Gabby Giffords, shot in the head at close range by a constituent in 2011, launched the organization Americans for Responsible Solutions together with her husband, astronaut Mark Kelly. In 2016 their organization merged with the California-based Legal Community Against Violence to form the Giffords Law Center to Prevent Gun Violence. Giffords Law now produces an annual gun law scorecard rating the stringency of gun laws for each of the 50 U.S. states. According to their website:
“Taking note of newly enacted laws, we use an exhaustive quantitative rubric to score each state on its gun law strength, adding points for safety regulations like universal background checks and extreme risk protection orders and subtracting points for reckless policies like ‘Stand Your Ground’ and permitless carry laws. We then rank the states, convert point totals to letter grades…”
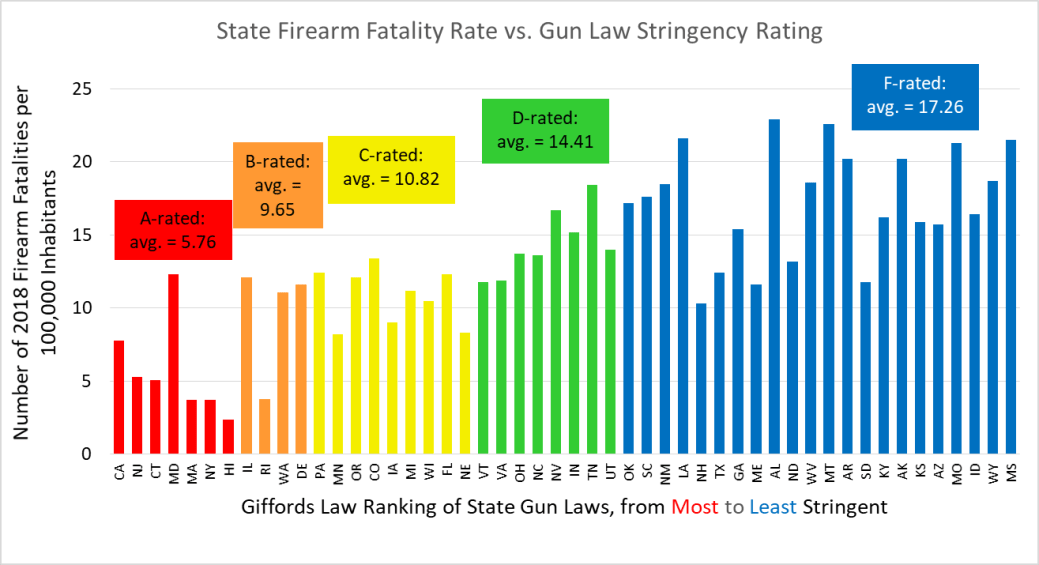
State-by-state firearm fatality rates are plotted against the Giffords scorecard ratings in Fig. 13, with states that receive common letter grades color-coded. None of the state laws analyzed has been found to be in violation of the 2nd amendment to the U.S. Constitution. All are among gun control policies typically included in national discussions. For example, the state (California) with the highest Giffords rating has laws that impose the following restrictions:
• Requires all gun sales to be processed through a licensed dealer, requiring a background check;
• Requires gun dealers to obtain a state license;
• Bans most assault weapons and .50 caliber rifles, and restricts the sale, transfer, manufacture, and possession of large capacity ammunition magazines;
• Requires all firearms purchasers to obtain a Firearm Safety Certificate, after passing a written test;
• Regulates gun shows in a comprehensive manner;
• Limits purchases of new handguns to one per person per month;
• Prohibits the sale of unsafe handguns that do not incorporate mandatory design safety elements;
• Imposes a ten-day waiting period prior to the sale or transfer of a firearm;
• Maintains permanent records of firearm sales;
• Gives local law enforcement discretion to deny a license to carry a concealed weapon;
• Gives local governments authority to regulate firearms and ammunition, although the state legislature has expressly removed this authority in certain areas;
• Allows concerned family members to petition a court to temporarily remove firearms from a loved one who is found to pose a clear danger to the public or their own safety during a mental crisis;
• Will require a point-of-sale background check on ammunition purchases, when Proposition 63, adopted by California voters in 2016, is implemented into state law.
Whether or not one agrees with the Giffords rating scale, the results in Fig. 13 point to a clear correlation between the nature of state gun laws and the firearm fatality rate. The fatality rates in Figs. 12 and 13 include firearm suicides as well as homicides, a point to which many gun advocates object. However, it is undeniable that the significant rate of gun suicides in the U.S. is an important part of the gun violence epidemic. And we will see in the next section that the suicide rate may be among the aspects most susceptible to reduction by sensible gun control legislation. While the results in Fig. 13 suggest that restrictions on gun sales, gun owners, and gun carrying can affect gun violence rates, they do not provide more direct insight into which particular types of legislation may be most effective in reducing which types of violence. For that type of insight we have to turn in the next section to the literature on gun violence research that has emerged in spite of the severe Congressional limitations on federal funding discussed in Section 1.
4. The Status of Gun Violence Research
The most extensive recent survey and synthesis of the available literature on gun violence research has been carried out by the RAND Corporation in their 2018 book The Science of Gun Policy. They describe their approach as “a unique attempt to systematically and transparently assess available scientific evidence on the real effects of gun laws and policies. Our goal is to create resources where policymakers and the general public can access unbiased information that informs and enables the development of fair and effective policies.” Specifically, they survey the empirical literature to assess the impacts of 13 distinct types of firearm policies on 8 classes of outcomes, including both public health and gun rights and manufacturing outcomes. The 13 classes of gun policies considered are:
1. background checks
2. bans on the sale of assault weapons and high-capacity magazines
3. stand-your-ground laws
4. prohibitions associated with mental illness
5. lost or stolen firearm reporting requirements
6. licensing and permitting requirements
7. firearm sales reporting and recording requirements
8. child-access prevention laws
9. surrender of firearms by prohibited possessors
10. minimum age requirements
11. concealed-carry laws
12. waiting periods
13. gun-free zones.
The 8 classes of policy outcomes considered are:
1. suicide
2. violent crime
3. unintentional injuries and deaths
4. mass shootings
5. officer-involved shootings
6. defensive gun use
7. hunting and recreation
8. gun industry.
It is noteworthy that the RAND analysis excluded some studies on the basis of their methods for isolating causal effects. For example, they excluded research that “offered only correlational evidence for a possible causal effect of the law, such as showing that states with a specific law had lower firearm suicides at a single point in time than states without the law. Correlations like these can occur for many reasons other than the effects of a single law, so this kind of evidence provides little information about the effects attributable to specific laws.”
The results of the RAND analysis are reported succinctly, but still in considerable detail, in Table 1 below, reproduced from their report. The table summarizes the evidence for the 13 policy types, across the top of the table, to impact the 8 outcome areas, most subdivided further in the item listings in the leftmost column. The most striking takeaway from Table 1 is that the vast majority of evidence entries are left blank, reflecting that no published studies satisfied the team’s criteria for inclusion. That result speaks again to the paucity of gun violence research we described in Section 1 of this post.

a) We concluded that there is moderate evidence that dealer background checks decrease firearm homicides, and there is inconclusive evidence for the effect of private-seller background checks on firearm homicides.
The second most common entry in the Table is “I,” indicating analyzed studies judged to be inconclusive. “This designation was made when studies with comparable methodological rigor identified inconsistent evidence for the policy’s effect on an outcome or when a single study found only uncertain or suggestive effects.” In particular, all the policy research to date regarding impacts on mass shootings – the gun violence incidents that attract the most media attention – is judged to be inconclusive. This is true, in particular, for laws banning the sale of assault weapons and high-capacity magazines. This does not imply that such laws are ineffective, but rather that there is an enormous gap to be filled by future research. In particular, a significant contributor to inconsistent research results in this area is the lack of any consensus definition of “mass shooting,” so that different researchers have used different criteria.
The relatively most persuasive evidence in Table 1 is labeled by “S” for supportive. “This designation was made when (1) at least three studies found suggestive or significant effects in the same direction using at least two independent data sets or (2) the effect was observed in a rigorous experimental study.” The only evidence considered supportive is for the reduction in self-inflicted and unintentional firearm injuries and deaths among children and adolescents when laws restrict their access to firearms. There is additional limited (L) (i.e., from a single study) evidence that firearm suicide rates among children and adolescents may be reduced by minimum age requirements for firearm purchases. Further moderate (M) or limited evidence suggests that laws restricting access to firearms among both children and the mentally ill, as well as background check mandates, are effective in reducing not only all firearm suicides, but overall suicide rates as well. This result is consistent with a consensus among most public health experts that gun availability has a causal effect on suicide rates. But it is, somewhat surprisingly, at odds with American public opinion. The 2017 Pew Survey of gun attitudes found 73% of respondents answering in the affirmative that “people who want to kill or harm themselves will find a way to do it whether they have a gun or not.”
The RAND analysis describes the situation with regard to suicide this way:
“[T]he theoretical or logical arguments for [the causal nature of gun prevalence] are sufficiently compelling that individuals and policymakers might reasonably choose to assume that gun availability does increase the risk of suicide. These logical considerations include that guns are an especially lethal means of attempting suicide and that suicide attempts are impulsive acts that may never be repeated if the first attempt fails. Because those who impulsively attempt suicide with a gun rarely get a chance to reconsider the decision, it is reasonable to suspect that when guns are less available, fewer suicide attempts will result in fatality, more people will have the chance to reconsider their decisions, and suicide rates will therefore decline. We view this as a logical and reasonably persuasive argument but distinguish it from what empirical research can currently demonstrate persuasively about the net effects of gun prevalence on suicide rates.”
There is moderate evidence (i.e., two or more studies find similar results, with no contradictory evidence from other, comparable studies) in the RAND analysis that mandating background checks for gun purchases from dealers reduces firearm homicide rates, and that laws restricting firearm access to mentally ill purchasers tend to reduce overall violent crime rates. In the opposite direction, there is moderate evidence that so-called “stand your ground” laws – enacted to date by 30 states, permitting the use of deadly force in self-defense in public, with no duty to retreat – actually increase total homicide rates. There is also limited evidence that both violent crime and unintentional firearm injury rates increase in response to laws that guarantee the right to a concealed-carry permit for all citizens who are not prohibited from possessing a firearm.
And what does research tell us so far about the most fundamental issue in the gun violence debates: does the prevalence of firearms in the U.S. increase violent crime rates or act as a deterrent to decrease violent crime? The research here suffers from the absence of reliable information about firearm prevalence, discussed in the preceding section. Hence, most studies have used as a proxy for gun prevalence the fraction of all suicides that are firearm suicides in a given location or a given year. Accepting that limitation, the RAND analysis found that four of the six recent (since 2005) studies that satisfied their criteria for inclusion “found the prevalence of firearms to be significantly and positively associated with homicide rates, and these associations were found across reasonably independent data sets.” But the analysis could not conclude from that correlation that the prevalence of firearms causes the increase in homicides. “In particular, if people are more likely to acquire guns when crime rates are rising or high…then the same pattern of evidence would be expected, but it would be crime rates causing gun prevalence, not the reverse.”
Although the enormous remaining gaps in the research on gun violence are frustrating, the RAND survey already represents considerable recent progress over a 2004 National Research Council survey that found the evidence at that time so weak and contradictory that it could determine no convincing causal associations between the laws it examined and crime or violence rates. More than half of the recommendations made in the RAND report address policy changes to improve the quality and quantity of publicly shared data on gun sales, transport, ownership and violence, and the breadth and robustness of the scientific research.
But in order to accelerate the research needed to inform public policy on gun legislation before too many more Americans fall victim to the current epidemic of gun violence, it will be essential to restore significant federal funding for the research. That will require overcoming the so far effective political resistance to such research coming from the NRA and other gun advocacy organizations. In the end the political imperative will be similar to that in the current case of climate change: state legislatures, the U.S. Congress and the U.S. President will have to decide on policy implementations even in the face of significant remaining uncertainty as to their quantitative impacts. The voting public, including new, young voters who have been strongly affected by the devastation of multiple mass school shootings, will demand no less.
References
The Health Consequences of Smoking – 50 Years of Progress: A Report of the Surgeon General, https://www.cdc.gov/tobacco/data_statistics/sgr/50th-anniversary/index.htm
https://www.nraila.org/get-the-facts/gun-violence-research/
https://www.cdc.gov/nchs/fastats/injury.htm
Wide-ranging Online Data for Epidemiologic Research, https://wonder.cdc.gov/
K. Parker, et al., America’s Complex Relationship With Guns, 2017 https://www.pewsocialtrends.org/2017/06/22/americas-complex-relationship-with-guns/
D.E. Stark and N.H. Shah, Funding and Publication of Research on Gun Violence and Other Leading Causes of Death, Journal of the American Medical Association 317, 84 (2017), https://jamanetwork.com/journals/jama/fullarticle/2595514
A. Linskey, NRA Has Long History of Suppressing Data on Gun Violence, Boston Globe (March 25, 2018), https://www.bostonglobe.com/news/politics/2018/03/25/nra-has-long-history-suppressing-data-gun-violence/ZryFdYf3WIAIlQkQRcwf9J/story.html
A.L. Kellermann, et al., Gun Ownership as a Risk Factor for Homicide in the Home, New England Journal of Medicine 329, 1084 (1993), https://www.nejm.org/doi/full/10.1056/NEJM199310073291506
C. Jamieson, Gun Violence Research: History of the Federal Funding Freeze, https://www.apa.org/science/about/psa/2013/02/gun-violence
https://en.wikipedia.org/wiki/Dickey_Amendment
T.C. Frankel, Their 1996 Clash Shaped the Gun Debate for Years. Now They Want to Reshape It, Washington Post (December 30, 2015), https://www.washingtonpost.com/business/economy/their-1996-clash-shaped-the-gun-debate-for-years-now-they-want-to-reshape-it/2015/12/30/707bfed6-a8e5-11e5-bff5-905b92f5f94b_story.html?noredirect=on
J. Dickey and M. Rosenberg, We Won’t Know the Cause of Gun Violence Until We Look For It, Washington Post op-ed (July 27, 2012), https://www.washingtonpost.com/opinions/we-wont-know-the-cause-of-gun-violence-until-we-look-for-it/2012/07/27/gJQAPfenEX_print.html
A.L. Kellermann and F.P. Rivara, Silencing the Science on Gun Research, Journal of the American Medical Association 309, 549 (2013), https://jamanetwork.com/journals/jama/fullarticle/1487470
https://en.wikipedia.org/wiki/Mark_L._Rosenberg
https://en.wikipedia.org/wiki/Tiahrt_Amendment
M.E. Betz, M.L. Ranney and G.J. Wintemute, Frozen Funding on Firearm Research: “Doing Nothing is No Longer an Acceptable Solution,” West Journal of Emergency Medicine 17, 91 (2016), https://www.ncbi.nlm.nih.gov/pmc/articles/PMC4729430/
E. Schumaker, Doctors Condemn the NRA-Fueled Ban on Gun Violence Research, Huffington Post (June 14, 2016), https://www.huffpost.com/entry/dickey-amendment-gun-violence-research-ban_n_56606201e4b072e9d1c4eaaa
M. DeBonis, E. O’Keefe and E. Werner, Here’s What Congress is Stuffing Into Its $1.3 Trillion Spending Bill, Washington Post (March 22, 2018), https://www.washingtonpost.com/news/powerpost/wp/2018/03/22/heres-what-congress-is-stuffing-into-its-1-3-trillion-spending-bill/
The Editorial Board, Why Doesn’t America Know More About Gun Safety?, The New York Times (August 7, 2019), https://www.nytimes.com/2019/08/07/opinion/guns-shootings-research.html?nl=todaysheadlines&emc=edit_th_190808?campaign_id=2&instance_id=11484&segment_id=15967&user_id=c1558c49a4e3cd3e0fd628a032cecc8e®i_id=353363560808
M. Sanger-Katz, Gun Research is Suddenly Hot, The New York Times (April 17, 2019), https://www.nytimes.com/2019/04/17/upshot/gun-research-is-suddenly-hot.html
R. Juskalian, The Science of Gun Violence, Discover Magazine (September/October 2019), http://discovermagazine.com/bonus/gunviolence
https://www.arnoldventures.org/
R.M. Cunningham, M.A. Walton and P.M. Carter, The Major Causes of Death in Children and Adolescents in the United States, New England Journal of Medicine 379, 2468 (2018), https://www.nejm.org/doi/full/10.1056/NEJMsr1804754
https://www.ghsa.org/index.php/state-laws/issues/teen%20and%20novice%20drivers
https://www.thetrace.org/about-the-trace/
W.J. Krouse and D.J. Richardson, Mass Murder with Firearms: Incidents and Victims 1999-2013, Congressional Research Service, https://fas.org/sgp/crs/misc/R44126.pdf
There Are Now More Guns Than People in the United States, Washington Post (October 5, 2015), https://www.washingtonpost.com/news/wonk/wp/2015/10/05/guns-in-the-united-states-one-for-every-man-woman-and-child-and-then-some/
D. Azrael, L. Hepburn, D. Hemenway and M. Miller, The Stock and Flow of US Firearms: Results from the 2015 National Firearms Survey, https://gunculture2point0.files.wordpress.com/2016/10/harvard-gun-study-stock-and-flow-2015-nfs.pdf
https://huntingmark.com/gun-ownership-stats/#_ftn1%20
https://lawcenter.giffords.org/
https://lawcenter.giffords.org/scorecard/
RAND Corporation, The Science of Gun Policy (2018), https://www.rand.org/pubs/research_reports/RR2088.html
C.F. Wellford, et al., Firearms and Violence: A Critical Review (National Academies Press, 2004), https://www.nap.edu/read/10881/chapter/1
