
March 27, 2026
I. INTRODUCTION
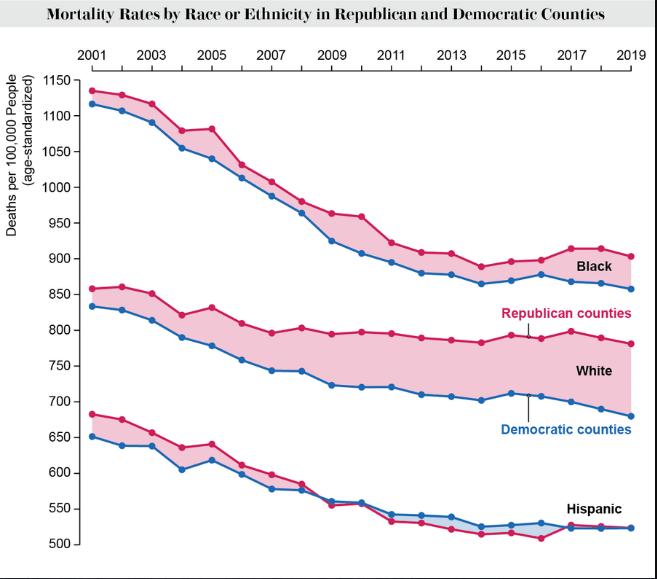
In our previous post Live Free AND Die, we presented data revealing a growing 21st-century mortality gap between white voters in predominantly Republican vs. predominantly Democratic counties in the U.S. We considered numerous factors contributing to this partisan health gap, including access to quality healthcare services, state laws relevant to citizen health, and regional differences in lifestyle and diet. However, we neglected what may be the most important contributing factor: differences in educational attainment. As the fraction of young Americans who go to college has increased rapidly over the past half-century, the differences between college graduates and those without a college degree have formed a new class distinction in the U.S. as well as in many western democracies. This “diploma divide” affects many aspects of Americans’ lives: lifetime income, life expectancy, cultural attitudes, and political preferences. Resentment on the part of non-college white Americans toward those degree-holders who have supported, and sometimes led, a rapid liberalization of social and cultural attitudes in the U.S. has become a dominant theme in 21st-century American politics. This evolution has been covered in many details in the recent book Polarized by Degrees: How the Diploma Divide and the Culture War Transformed American Politics by Matt Grossman and David A. Hopkins.
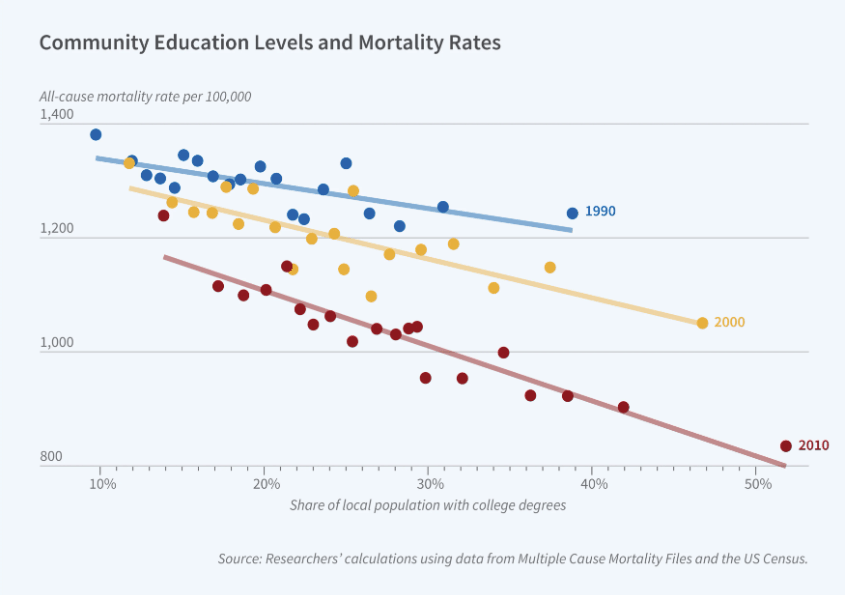
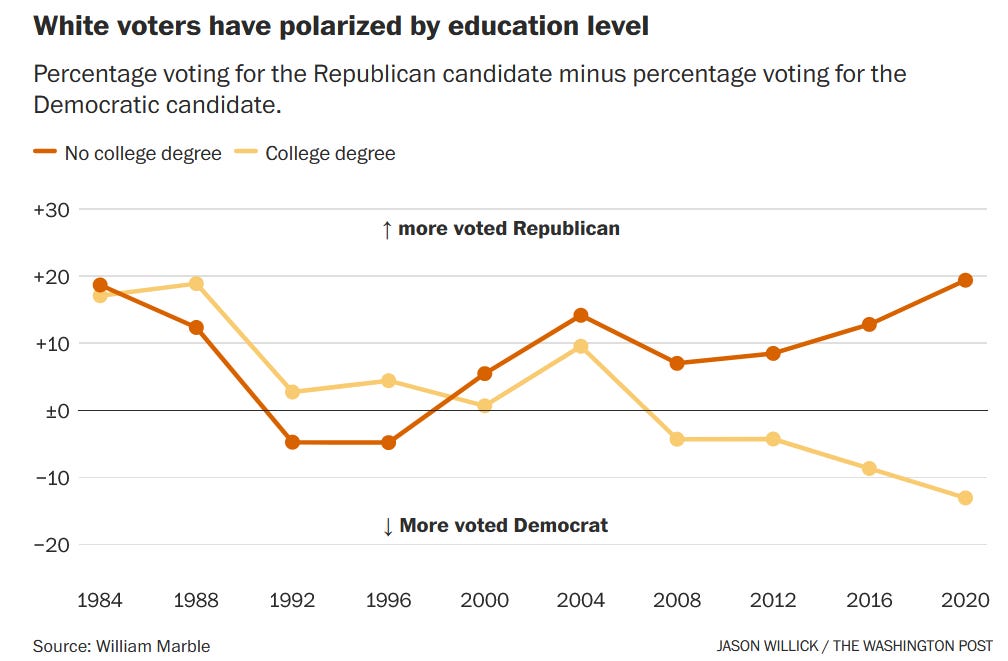
The intersection of the diploma divide with the partisan mortality gap is illustrated by Figs. I.1-3. Figure I.1 shows that the partisan mortality gap has grown steadily during the 21st century primarily among white voters in Republican vs. Democratic counties. Figure I.2 indicates that mortality rates in U.S. counties are strongly correlated with community educational attainment levels. The higher the fraction of a local population with college degrees, the lower the community’s all-cause mortality rate. And the correlation is growing stronger during the 21st century. The authors of the study that produced Fig. I.2 estimate that roughly 60% of the correlation is associated with community differences in health-related behaviors such as smoking and obesity. Figure I.3 illustrates the divergence in voting patterns in 21st-century Presidential elections between white voters with and without a college degree. Those with a college degree reside increasingly in Democratic-voting counties with reduced average mortality rates. Those without a college degree often reside in Republican-voting counties with elevated mortality rates.
We will explore these trends in more detail in this post. In Section II we will provide data detailing the changing demographic makeup of the American electorate over the past half-century. In Section III we will explore how educational attainment impacts individual’s income, health, cultural attitudes, and political preferences. Section IV will address the thorny question of why college graduates tend to take on more liberal social and cultural attitudes: is it self-selection of those who attend college, or increased exposure to people across a diverse range of ethnicities and beliefs, or indoctrination by liberal professors, or all or none of the above? In Section V we will consider briefly how the American two-party system had adjusted to and exacerbated resentment across the diploma divide.
II. THE CHANGING DEMOGRAPHICS OF THE AMERICAN ELECTORATE
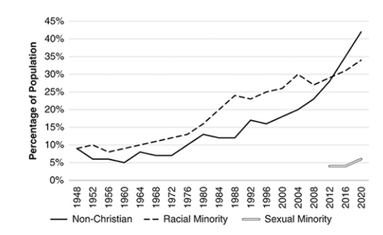
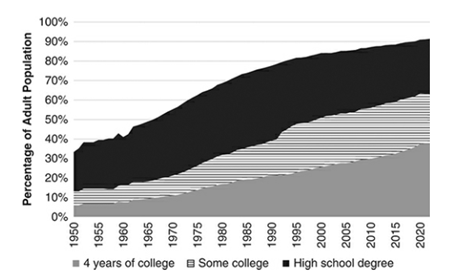
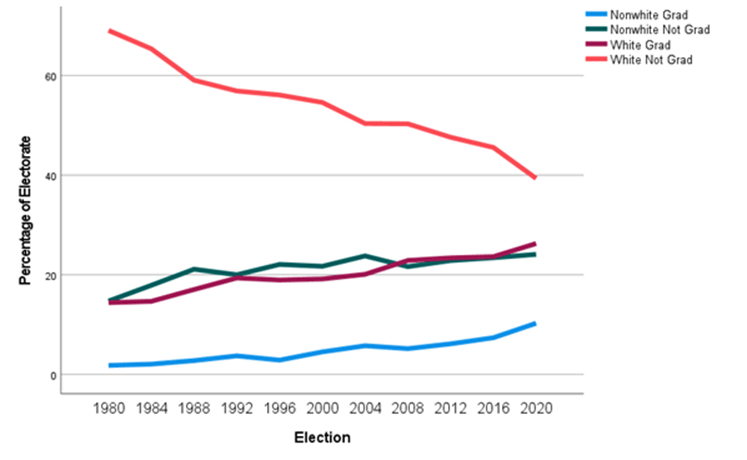
Since the end of World War II the American population has been transformed by two dominant trends: rapid growth in the presence of racial and religious minorities and rapid growth in the number of college graduates. These two trends are exhibited, respectively, in Figs. II.1 and II.2, both taken from Polarized by Degrees by Gross and Hopkins. The result of these trends, as illustrated in Fig. II.3, is that white voters without a college degree have evolved from representing more than 2/3 of the electorate in 1980 to less than 40% by 2020. Voters with a college degree, whether white or not, now constitute more than 1/3 of the American electorate. The electorate is further skewed toward the high-education side than the population at large, because voter turnout increases with educational attainment. For example, in the 2022 midterm Congressional election, the turnout rate was only 20% among those without a high school diploma but 70% among those with postgraduate education beyond a college degree.
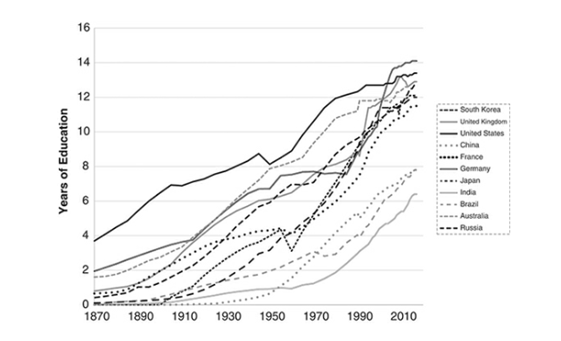
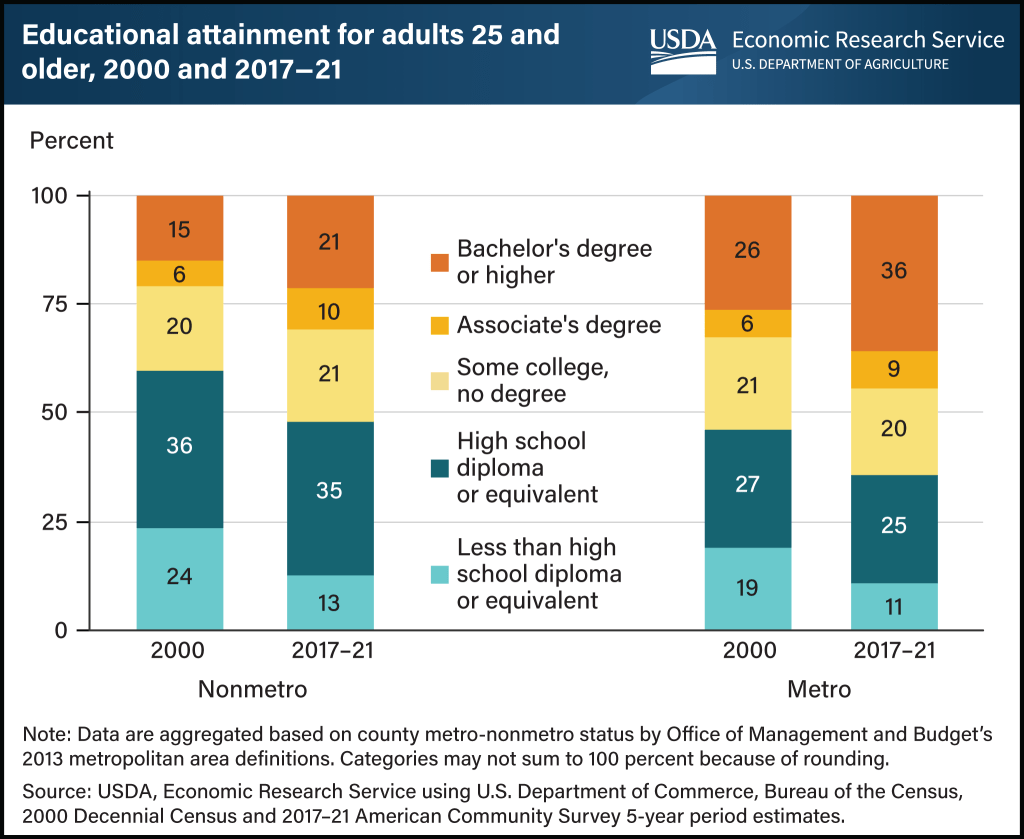
The growing education of Americans is part of a worldwide trend, as seen in Fig. II.4. And while it is growing in both urban and rural U.S. communities, there is a significantly greater concentration of college graduates in urban areas, where the majority of employment opportunities are found. As shown in Fig. II.5, the fraction of adults age 25 and above who have obtained a college degree had grown by 2017-21 to 36% in urban areas but only 21% in rural areas.
White non-college voters have seen a dwindling role not only in elections, as shown in Fig. II.3, but also in influencing the dominant social and cultural trends in the country. Their feeling that the country has been drifting away from them has fueled growing anger that has become a dominant theme in recent American elections. But while they no longer represent the dominant part of the electorate, they still retain a plurality of the votes. The situation is summarized nicely by Gross and Hopkins: “The well-educated have gained enough social, cultural, and economic power to dominate the formation of intellectual ideas and organizational policies, setting rules and promoting norms for society at large. But they are not numerous enough in the larger electorate to reliably protect their governing choices from political revolts fueled by the greater proportion of citizens with less formal education, who can easily resent what they view as a privileged and arrogant class of elites attempting to force its own beliefs upon them.”
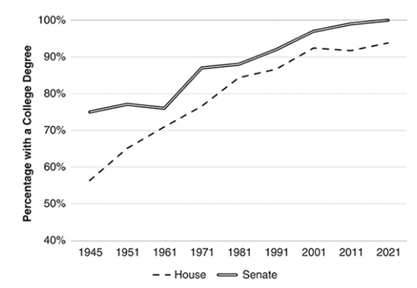
Americans with college degrees hold the most social, cultural, and economic power because they dominate leadership positions in industry, media, academia, and politics. For example, 95% of Fortune 500 company CEOs hold at least a bachelor’s college degree, while more than half of Fortune 100 CEOs hold a postgraduate degree. 77% of media executives hold a bachelor’s degree and 11% hold a master’s degree. And as shown in Fig. II.6, essentially all U.S. senators and more than 90% of all U.S. House of Representatives members currently have college degrees, even if many of them claim to understand non-college voters the best.
III. IMPACT OF EDUCATIONAL ATTAINMENT ON INCOME, HEALTH, CULTURAL ATTITUDES, AND POLITICAL PREFERENCES
Income and geographical clustering:
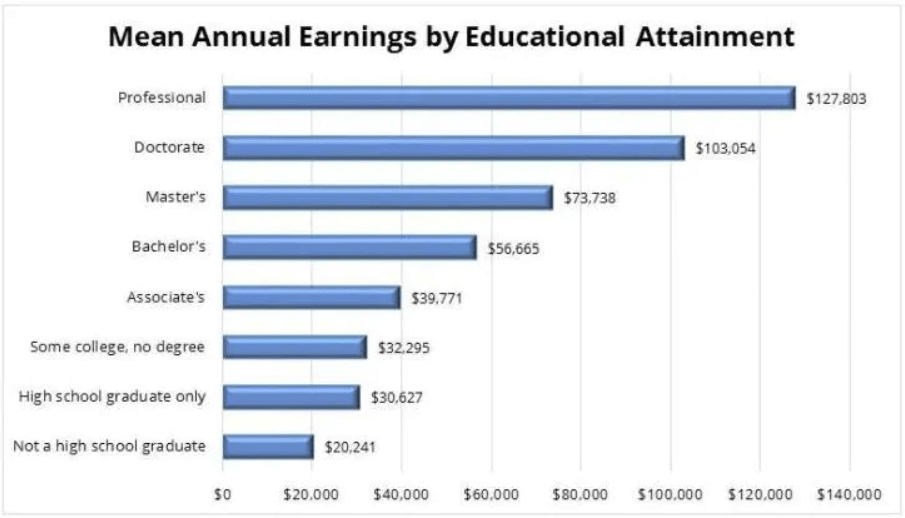
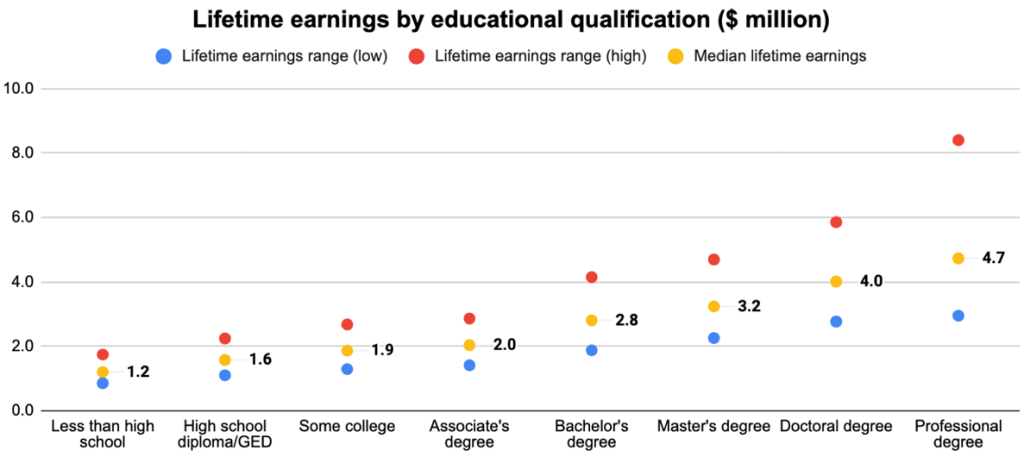
The diploma divide drives much of current American politics because so many aspects of American life hinge on educational attainment. The most obvious impact is on earnings. Figure III.1 shows the mean annual earnings of Americans at various levels of educational attainment, as of 2022. The earnings of a high school graduate are nearly doubled by those of a person with a bachelor’s degree, more than tripled by obtaining a doctorate degree, and more than quadrupled with a professional post-graduate degree. Figure III.2 shows median as well as 25th percentile and 75th percentile values of lifetime earnings for the same set of educational levels.
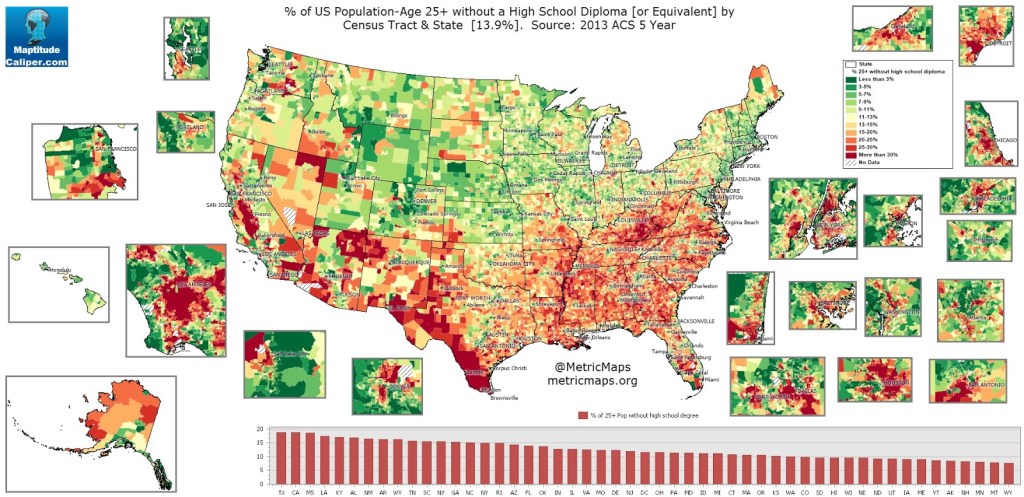
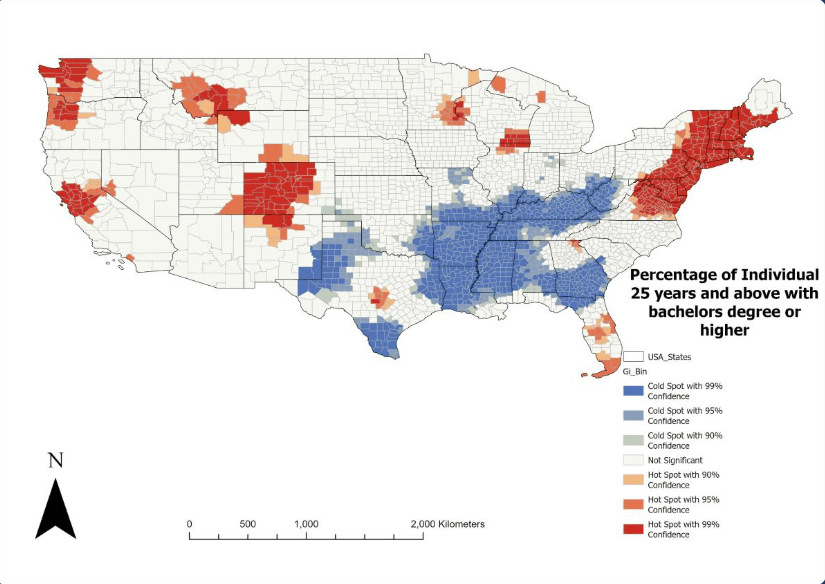
Americans strongly cluster geographically by educational attainment levels. Figure II.5 already showed that college degree holders were found in substantially larger proportions in metro than in non-metro areas, because the employment opportunities for college graduates are much greater in urban areas. But there is also significant regional clustering. The county-level map in Fig. III.3 shows that Americans with less than a high-school diploma tend to cluster in the rural South, parts of Appalachia, the Southwest, including Indian reservations and the Texas-Mexico border, and in some agricultural counties in the Great Plains and California. In contrast, Fig. III.4 shows that major clusters of those with at least a bachelor’s degree occur in major metropolitan areas and their surrounding suburbs in the Northeast, Colorado, San Francisco and Silicon Valley, the Portland-to-Seattle Northwest corridor, and scattered university towns and cities.
The geographical clustering of college graduates is in large part a result of self-sorting. People tend to prefer social interactions with others of similar levels of education. Americans with college degrees tend to be more mobile than those without, willing to relocate to find the best job opportunities, the best places to raise families, the best quality of life. Their generally higher incomes allow them to manage the higher cost of living in large cities and their suburbs. They generally have sufficient discretionary budget to enjoy the cultural events and opportunities offered in such metro areas. In contrast, those without a college degree often could not afford the cost of living in such areas. They tend to remain more geographically bound to the places where they were raised and to take the best jobs they can find there.
Mortality rates and life expectancy:
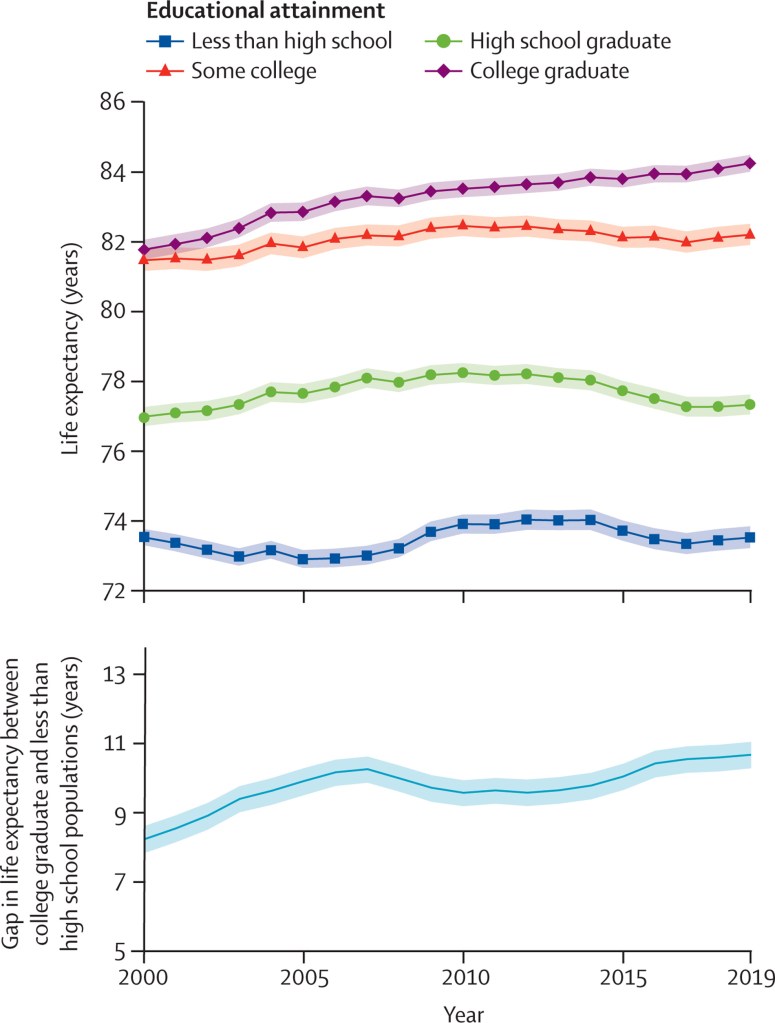
The college degree “cold spots” seen in Fig. III.4 are highly reminiscent of the chronic disease and high mortality-rate geographical hot spots we found consistently in our previous post on the partisan mortality gap. It is therefore useful to explore in more detail the correlation between life expectancy and educational attainment in the U.S. The data in Fig. III.5 indicate that a college degree adds nearly 7 years on average of life expectancy compared to a high school diploma or nearly 11 years compared to those who do not complete high school. In both cases the gap appears to be growing during the 21st century.
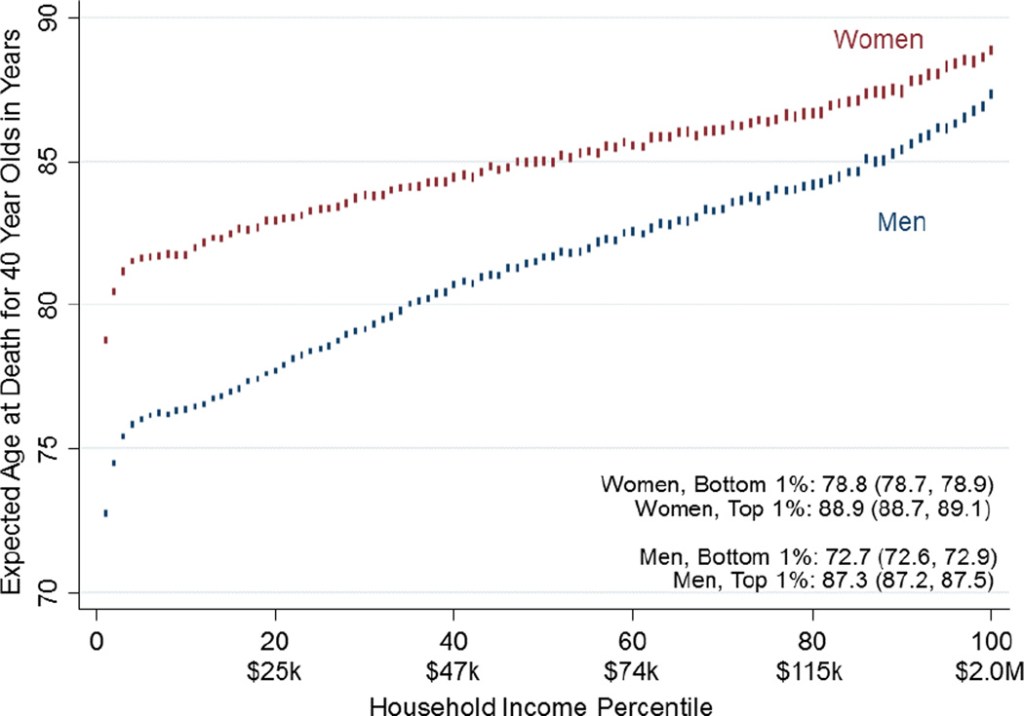
Part of the life expectancy gap can be explained, of course, by the earnings gap shown in Figs. III.1 and III.2. The strong correlation with household income level is plotted in Fig. III.6, where the gender gap in life expectancy is also displayed. Men whose households fall in the upper quintile of income live 8-9 years longer, on average, than men in the lower quintile. The absence of a National Health Service in the U.S. exacerbates this difference. The higher-income individuals can afford better doctors and better health insurance or have good health insurance provided by their employers. The lower-income people tend to live paycheck-to-paycheck and have to balance the expense of doctor visits against providing food for their families.
But there is more to the diploma divide in life expectancy than just the income differential. Non-college men tend to have more dangerous jobs than those with a college degree; one doesn’t find many college graduates among coal miners or construction workers, for example. Even for those without an inherently dangerous job, non-college workers most likely had much less opportunity to work from home during the COVID pandemic. The college graduates tend to be better informed about the dangers of unhealthy diets and smoking habits and to be less susceptible to abundant medical misinformation about vaccines. The geographical clustering of college graduates tends to place them in communities more likely to attract the best medical professionals and stable hospitals. Non-graduates in rural areas are seeing local hospitals more reliant on Medicaid funding and more vulnerable to closure.
In their book Deaths of Despair and the Future of Capitalism, Princeton University economists Anne Case and Angus Deaton have argued that mortality rates among working-class white, and especially male Americans without a college degree have stagnated during the 21st century particularly due to a surge in “deaths of despair:” suicides, drug (especially opioid) overdoses, and alcohol-related fatalities. They attribute the surge to economic stagnation, as a capitalist system with declining labor unions and increasingly powerful corporations, combined with a healthcare system that prioritizes profit over patient care, has failed this sector of the population.
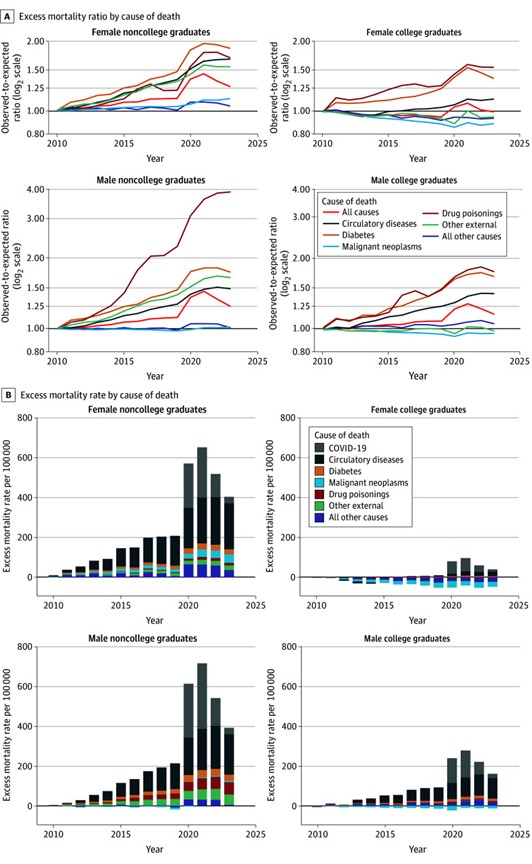
However, a recent analysis by Paglino, Wrigley-Field, and Stokes has shown that, while the growth in drug-related deaths among male non-college graduates has indeed been stark over the past two decades, this growth is not a major contributor to the stagnation in mortality rates for this sample. These authors analyzed nearly 50 million U.S. deaths between 2006 and 2023 and separated them by sex, college graduation, and cause of death. Their results, reproduced here in Fig. III.7, show the excess age-standardized mortality rates over rates expected from extrapolating the trend from 2006 to 2010, separated by cause of death, sex, and educational attainment. The results reveal that drug-related deaths of despair among male non-college graduates reached a level 4 times higher than expected from the extrapolation by 2023 but still accounted for only 15.8% of the excess mortality rate in 2023 (only 3.4% for female non-college graduates). The major contributors to the stagnation in mortality rates among non-college graduates, both male and female, have been circulatory diseases (e.g., heart attacks and strokes) and COVID-19 during 2020-22.
Finally, it is worth noting that educational disparities are not the sole explanation for the partisan mortality gap we dealt with in a previous post. The chronic disease hot spots we displayed in that previous post line up very well with the low-education rural regions seen in the South and Appalachian areas in Fig. III.3, but not at all with those along the Texas-Mexico border or in California’s San Joaquin valley. Those without a high school diploma in the latter two regions are likely dominated by recent Hispanic immigrants and Hispanic mortality rates have been systematically lower than those of white or black Americans, despite Hispanics’ often low socioeconomic status. The reasons for this “Hispanic paradox” are still not very well understood. Furthermore, as we have shown in detail in our previous post, differences in health-related laws among U.S. states play an important role in regional health disparities.
Social and cultural attitudes:
There is the general perception that advanced education leads people to adopt more liberal attitudes on questions of social policy, particularly with respect to tolerance for various minorities, acceptance of immigrants, promotion of equal rights, the social safety net for the poor and disabled, environmental issues, and the role of government. While this is generally true, there are subtleties that should be explored. In this section we intend to discuss survey data relevant to the question of liberalization. We will postpone discussion of what might cause such a shift to Section IV.
The most extensive survey of Americans’ attitudes toward social policy issues as a function of their educational attainment was carried out by the Pew Research Center in 2015. The survey was based on more than 6,000 respondents’ choices between two offered responses (liberal vs. conservative) on each of ten questions. The questions and responses are shown in Fig. III.8. The dots in the figure represent the percentage of respondents who chose the stated conservative answer to each question, with the respondents subdivided by partisan lean (blue for Democrats, red for Republicans) and four levels of educational attainment.
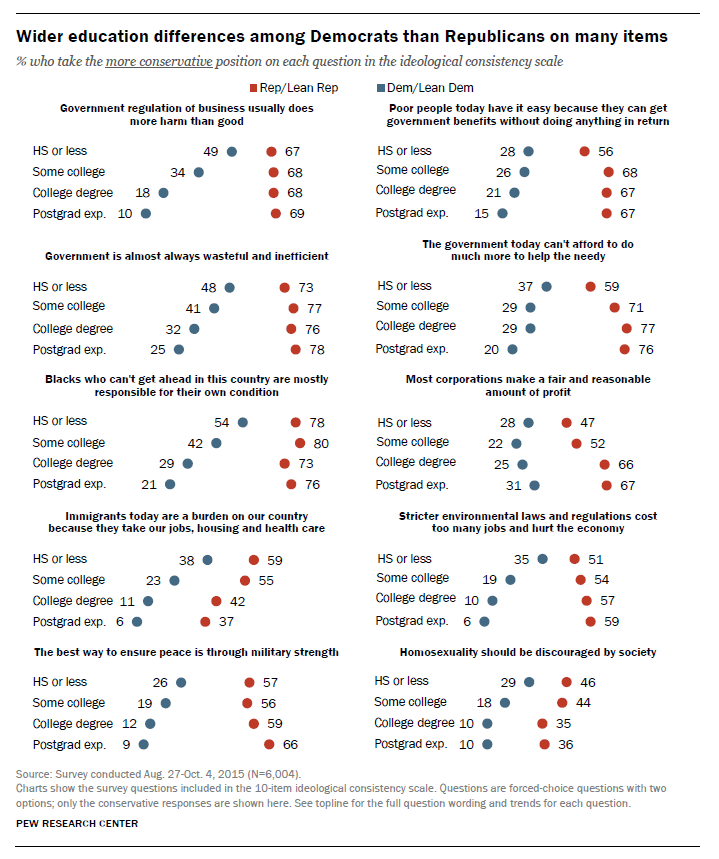
There are only two of the ten issues in Fig. III.8 for which liberalization has grown with a college degree regardless of the respondents’ partisan lean. A college or higher degree makes Americans more tolerant of immigrants and homosexuals, independent of political preferences. With the exception of the question about corporate profits, respondents who favor the Democratic Party adopt much more liberal positions with college or post-graduate degrees. However, on most questions respondents who favor the Republican Party grow somewhat more conservative with college or postgraduate degrees. There is, then, some suggestion that obtaining a college degree tends to reinforce opinions that are nascent even among high school graduates, increasing partisan divides.
Because college graduation rates are rising over time, some of the trends seen in Fig. III.8 reflect, at least in part, generational divides. For example, the Pew survey found that millennials were far more liberal than Baby Boomers and pre-Baby Boomers on the questions of tolerance for immigrants and homosexuals, independent of partisan lean. Among the Republican leaners specifically the millennials were far less conservative on a number of issues: government regulations, government waste, environmental regulations, and the use of military strength to secure peace. Since the millennials are more strongly represented among college graduates than older Americans, a college education would have been more strongly stiffening of conservative positions among Republican-leaning Baby Boomers or pre-Baby Boomers than shown for the full sample in Fig. III.8. So the argument made by many Republican politicians that U.S. colleges are churning out indoctrinated liberals is not strongly supported by this survey.
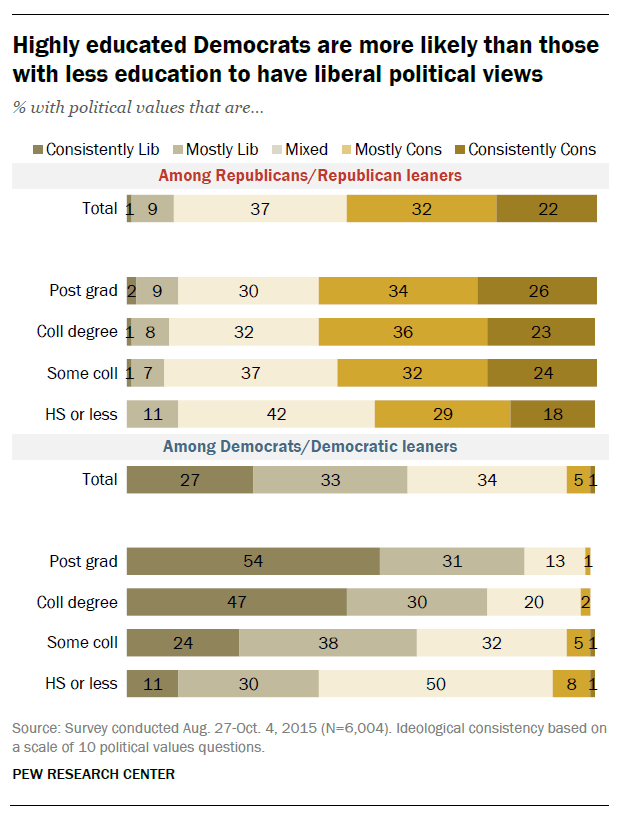
The basic observations in Fig. III.8 are reinforced in Fig. III.9, summarizing how respondents’ answers to the ten questions varied along a spectrum from consistently liberal to consistently conservative, as a function of educational attainment for Republican and Democratic partisans. Higher education tends to make Republican partisans slightly more conservative but to make Democratic partisans markedly more liberal. Thus, there is a net overall trend toward increasing liberalization on social policy among college graduates and especially postgraduates.
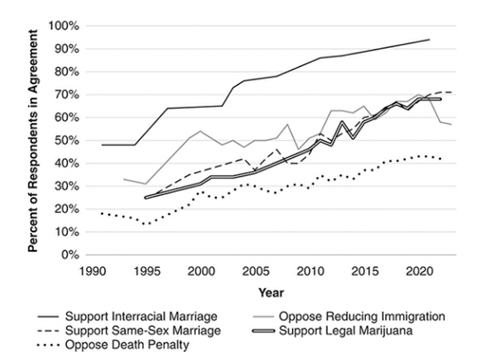
Since college graduates dominate the ranks of leadership in industry, media, academia, and politics, it is not surprising that there has been an overall liberalization of American attitudes and policies over the past few decades. This is tracked in Fig. III.10 based on Gallup polling on American attitudes on five specific cultural issues from 1990 to 2023. Over that time period, public support has increased rather steadily for interracial marriage, same-sex marriage, and legalizing marijuana, while opposition has increased to the death penalty and reducing immigration. The growing public support for same-sex marriage was undoubtedly a factor in the Supreme Court’s 2015 decision establishing the right to same-sex marriage in the case Obergefell v. Hodges. The growing support for legalizing marijuana led a number of states to pass laws doing just that.
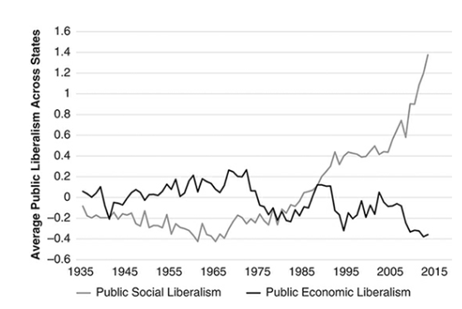
Caughey and Warshaw have analyzed general shifts in both public opinion and state policies with regard to social issues and economic issues separately, state by state, over the time period from 1936 to 2014. Their estimates are based on “survey responses to over 300 domestic policy questions spread across nearly 1,000 public-opinion surveys fielded between 1936 and 2014. Overall, the responses of nearly 1.5 million distinct individuals are represented in the data…[The dataset] includes canonical academic surveys, such as the American National Election Study and the General Social Survey, as well as hundreds of polls from commercial polling organizations such as Gallup, CBS News/NYTimes, ABC News/Washington Post, and many others…The economic questions cover issues such as taxes, social welfare, and labor regulation. The social questions include ones about alcohol, abortion, gay rights, women’s rights, school prayer, and other cultural (but not racial) issues.” The overall trends in public liberalism measures on cultural and economic issues, as extracted from the Caughey and Warshaw data by Gross and Hopkins and averaged over all states, are revealed in Fig. III.11.As the fraction of Americans with college degrees has increased, Americans have become considerably more liberal overall on social issues but somewhat more conservative on economic issues. The sharp upturn in social liberalism seen in the last years covered in Fig. III.11 coincides with the election and term in office of Barack Obama as the first black U.S. President.
Political polarization:
The Obama years represented a pinnacle of policy favored by college-educated liberalism. Having a black President shifted, but also polarized, Americans’ views on racial progress. Pew surveys found that “the share of Democratic partisans and Democratic-leaning independents who agreed that ‘the country needs to continue making changes to give Blacks equal rights with Whites’ increased from 57 percent to 81 percent between 2010 and 2017, and the share agreeing that ‘racial discrimination is the main reason that many Black people can’t get ahead these days’ grew from 28 percent to 64 percent over the same period.” LGBTQ rights advanced, with same-sex marriage approved by the Supreme Court in 2015. Obama attempted (but was overturned by the courts) to establish a pathway to citizenship for undocumented immigrants who arrived in the U.S. as children brought by their immigrant parents. Criminal justice reforms were enacted. The Affordable Care Act (ACA) established for the first time in the U.S. a federal government-backed health insurance program for the population at large, though one working through commercial insurance companies. The ACA required that health insurance plans cover costs of contraception, although the Supreme Court found that religious freedom allowed exceptions to that policy.
But these advances led to a strong backlash embodied initially in the Tea Party movement and culminating in the two elections of Donald Trump in 2016 and 2024. At the core of the backlash were white Americans without a college degree who were concerned that the country was changing too fast in directions that made them uncomfortable and worried that they were on a trajectory to become a minority in the American electorate. Although both the Republican and Democratic Parties had been placing increased emphasis on cultural issues in party platforms since the 1990s, these issues – abortion, LGBTQ rights, voting rights, gun rights, issues surrounding racial “preferences” and discrimination, environmental issues, and particularly immigration policies – came to dominate party politics during and after the Obama years. Donald Trump particularly sought to exploit these concerns by spurring resentment of “liberal elites,” an epithet he has ratcheted up to “radical left lunatics” as he’s grown even more divisive during his second term.
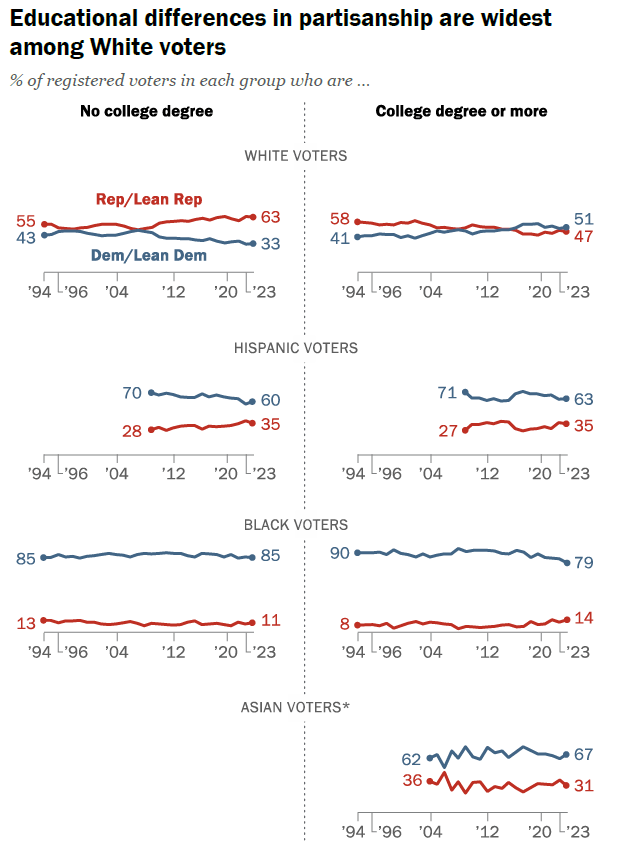
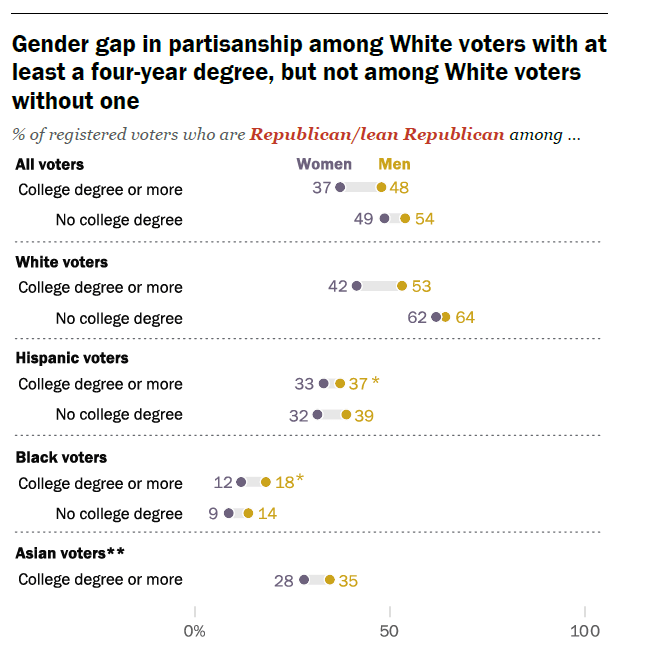
The divide over cultural liberalism is what has led to the diploma divide seen back in Fig. I.3, where white voters with a college degree, and especially with a postgraduate degree, progressively favor the Democratic Party and those without a college degree increasingly vote for Republicans. But there are modulations of these partisan preferences that are worth noting. First, as indicated in Fig. III.12, the diploma divide is only seen among white voters; Hispanic and Black voters favor Democrats by almost the same margin independent of their educational attainment. Second, as noted in Fig. III.13, the diploma divide is much stronger among white women than among white men.
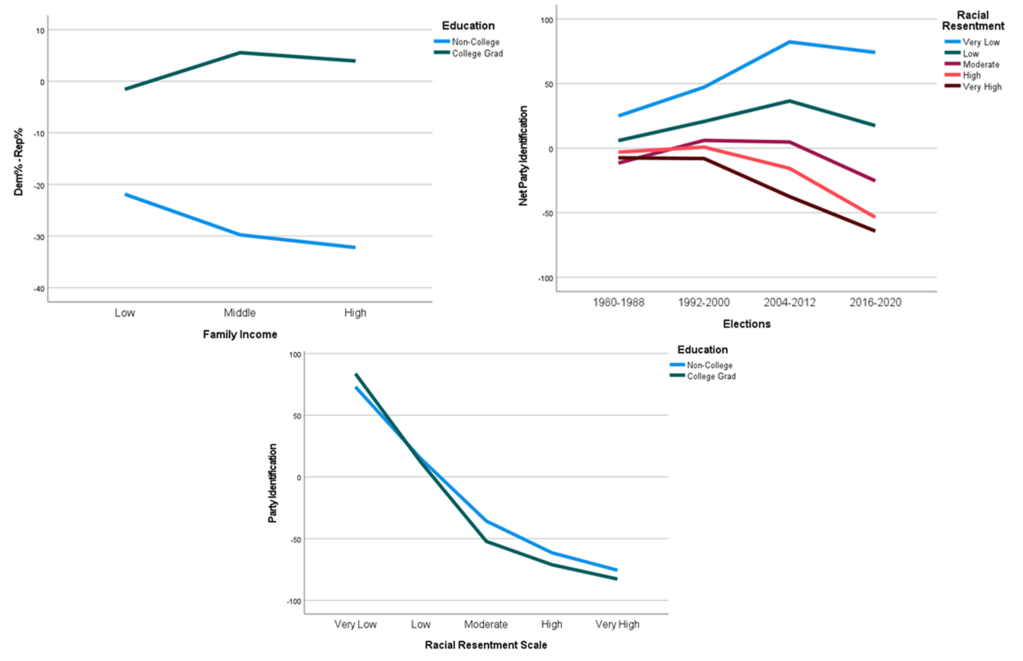
Third (Fig. III.14), the diploma divide among white voters is not strongly dependent on family income (left frame) but partisan preferences of non-college white voters are strongly dependent on the degree of racial resentment expressed by the voter (right frame). In fact, racial resentment is a much stronger determinant of partisan lean than educational attainment: even whites with college degrees strongly favor the Republican Party if they express strong racial resentment (bottom frame), although a much smaller fraction of the college graduates than of the non-college whites fall in this class. More than 150 years after American slaves were emancipated, American politics remain strongly influenced by racial animus.
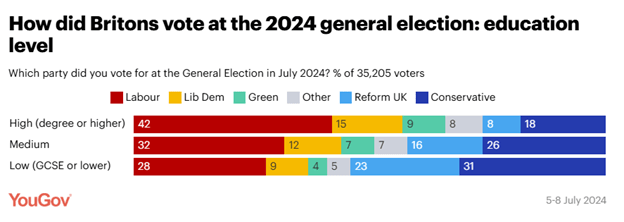
The increasing social liberalism of college graduates, on average, and the growing backlash from less educated citizens is not a uniquely American phenomenon. Similar trends are seen in most highly developed countries. But two features make the situation more polarizing in the U.S. The first is the high degree of racial resentment that lingers among many white Americans. The second is the two-party political system. In the UK, for example, Fig. III.15 shows that the educational divide was split among six parties in the 2024 Parliamentary elections. As Gross and Hopkins explain: “But in the U.S., these international trends have been channeled through a distinctively rigid two-party system with no viable outlets beyond the hegemonic Democratic and Republican parties, forcing citizens and institutions seeking to navigate today’s climate of social change to align – or be seen to align – with one side or the other in a perpetually bifurcated political conflict.” This bifurcated choice leads to increasing polarization across the diploma divide as one or both parties seek to excite and enhance their base by ratcheting up messages of us vs. them fear and resentment. We will explore the American politics of resentment further in Section V. But first, we need to explore why it is that a college degree generally increases social liberalism.
IV. WHY DO COLLEGE GRADUATES FAVOR LIBERAL SOCIAL ATTITUDES?
For more than half a century conservatives and Republican politicians have had no difficulty in pinpointing what they claim to be the sole cause of the increasing social liberalism of college graduates: indoctrination by liberal professors. This belief basically began with William F. Buckley’s influential 1951 book God and Man at Yale, in which Buckley took his alma mater to task for attempting to break down students’ religious beliefs and forcing them to embrace liberal ideas. In 2012 Rick Santorum, a candidate for the Republican Presidential nomination, called colleges and universities “indoctrination mills” for godless liberalism.
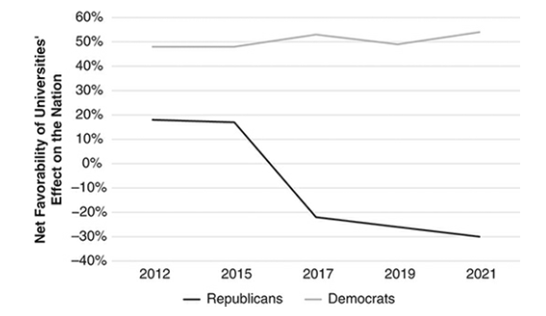
The claim has now reached a hyperbolic level under the administration of President Donald Trump and Vice President JD Vance. Vance, when he was a candidate for Senate in Ohio, gave a speech to the National Conservatism Conference whose central thesis, borrowed from Richard Nixon, was that “The Universities are the Enemy,” with university faculty giving “credibility to some of the most ridiculous ideas that exist in this country.” Trump has characterized colleges as “dominated by Marxist maniacs and lunatics,” claiming that student protesters have been indoctrinated by faculty “communists and terrorists.” During the first year of his second term in office, Trump has tried to put a financial stranglehold on several American universities, demanding, often under the pretext of fighting antisemitism on campus, that they pay him billion-dollar settlements and give him control over their curricula and faculty hiring in order to release previously approved grant funds for their researchers. The steady drumbeat of extremely negative statements has certainly had a dramatic impact on the views of colleges and universities expressed by Republican voters, as illustrated in Fig. IV.1. And it has led to a spate of state laws restricting academic freedom, such as the one in our own state of Indiana requiring faculty at state universities to teach with ill-defined “intellectual diversity” or possibly have their tenure revoked.
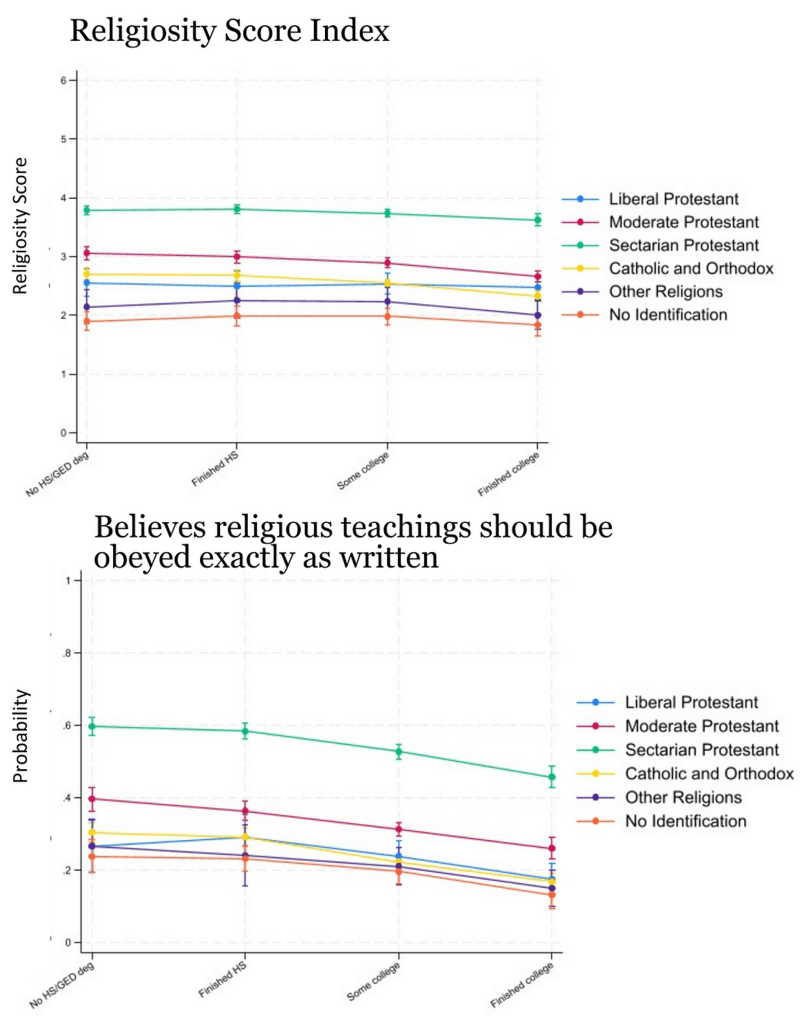
How much of this divisive political rhetoric is supported by evidence? Let’s deal first with the claims from Buckley and Santorum that liberal professors try to break down students’ religious beliefs. The Center for Mind and Culture has carried out a Modeling Religious Change (MRC) project that tracked students’ religious beliefs and practices over a 20-year period, based on a National Longitudinal Study of Youth that began with nearly 9,000 13-17 year old boys and girls in 1997 and re-interviewed the same students periodically into their 30s. The MRC created a metric for overall religiosity depending on respondents’ answers to six questions: do they attend church monthly, pray weekly, believe religious teachings are to be obeyed exactly as written, believe they need religion for good values, believe God has something to do with what happens to them personally, and ask God’s help in making decisions.
Some results from the MRC project are displayed in Fig. IV.2 as a function of the educational attainment of the respondents. One sees for various religions at most a very slight reduction in overall religiosity with college graduation. The major contribution to this slight reduction, seen in the bottom frame of Fig. IV.2, comes from the responses about believing religious teachings should be obeyed exactly as written. For all religions, there is a significant decline in the strict interpretation of scripture that sets in already in high school and reaches a roughly 70% decline by college graduation. That decline can be attributed to exposure to science classes that are neither liberal nor conservative. The evidence from cosmology regarding the age of the universe, from geology regarding the age of the earth, and from genetics regarding the evolution of species all contradict the strict interpretation of the Judaeo-Christian Bible as a record of origins and history. Some Christian conservatives may see science education as “indoctrination by godless liberals” – we have discussed Attacks on Science Education in a previous post –but we see it merely as responsible teaching.
There is very strong evidence that college and university faculty members tend to be more liberal than the population at large. This is hardly surprising because Americans with advanced postgraduate degrees, from whom faculty are chosen, are far more liberal than the public at large (see Fig. III.9). This is as true of faculty in the natural sciences as in the humanities or social sciences. But there is no compelling evidence that exposure to liberal faculty moves students significantly to the left. The longitudinal tracking approach used in the MRC monitoring of religious attitudes through college is useful to apply as well to monitoring social attitude evolution of individuals through college, because simple studies of college vs. high school graduates are subject to contributions from self-selection effects, wherein liberal-trending students may be more likely to attend college in the first place than conservative-trending students.
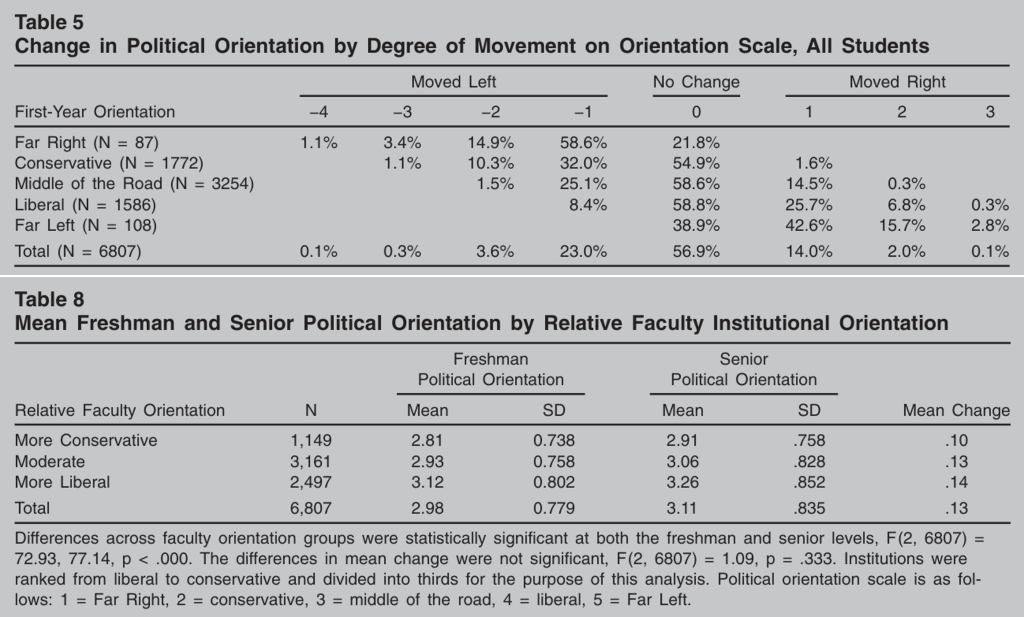
The most comprehensive such longitudinal tracking study was carried out by Mariani and Hewitt, analyzing 6,807 student responses to social surveys as 1999 freshmen and 2003 seniors, along with faculty responses to an independent ideology survey across 38 private colleges. Across those 38 colleges measures of faculty liberalism varied considerably. Students were asked both as freshmen and as seniors to evaluate their own political orientation among five choices: far right (value 1); conservative (2); middle of the road (3); liberal (4); far left (5). Essential results of the study are given in tabular form in Fig. IV.3. The upper table shows for each political orientation group during the first year how much their self-assessment changed by the time they were seniors. The lower table sorts the mean political orientation of freshmen and seniors and the mean change during college separately for different degrees of liberal faculty dominance at the college.
There are a number of interesting takeaways from the results in Fig. IV.3:
- The mean orientation of students across the 38 private colleges at the start was slightly to the conservative side of middle of the road, although for colleges with the most liberal faculty, the students began slightly to the liberal side. In all cases, however, the mean incoming student political orientation was significantly less conservative than the population at large in 2004.
- 57% of students did not significantly change their political orientation during college. Of those that did change, initially conservative students moved leftward on average while initially liberal students moved rightward on average. In other words, most of the movement was toward the center, although initially middle-of-the-road students moved leftward more than rightward.
- The mean orientation shift from freshmen to senior was by just over one-tenth of a position toward the liberal side, essentially independent of the liberal orientation of the faculty. The only significant exception to this observation was for religious colleges, where both the faculty and the student body were more conservative, on average, than at other colleges and the students were less likely to move to the left during their college career.
- The orientation distribution among the seniors was quite similar to that of 18-24 year olds from the general population.
Mariani and Hewitt draw four conclusions from their study:
- “…faculty members…are much more liberal than the general population.”
- “Students tend to enroll at institutions that have a faculty orientation makeup more similar to their own.”
- “…students whose ideology changes while in college tend to change to the left, but that movement is within the normal orientation range of 18-to-24-year-olds in the general population.”
- “…there is no evidence that faculty ideology at an institutional level has an impact on student political ideology.”
Another finding of their study, not revealed in Fig. IV.3, was that female students were more likely to move to the left during their college career than male students. This is not surprising because female college students face additional daunting future life choices than males, namely, how to balance childbirth along with marriage and career; women who bypass college may be less concerned about careers than college graduates. Since liberal ideology favors womens’ freedom of choice of career, marriage, childbirth, and lifestyle much more than conservative ideology – think of JD Vance’s denigration of “childless cat ladies” – women’s move toward the left is understandable. It is also consistent with the results in Fig. III.13, which reveal a significantly larger diploma divide among women than men.
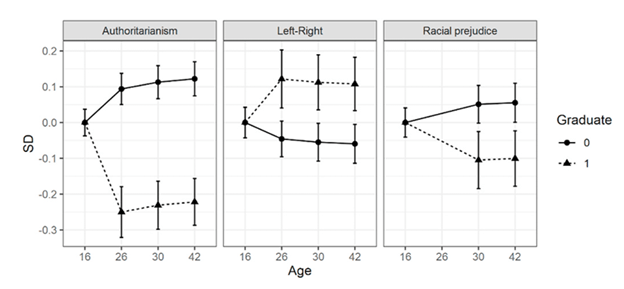
One of the issues with the Mariani-Hewitt study is that self-assessment of political orientation requires averaging over one’s attitudes toward many different questions. For example, their survey did not attempt to separate student attitudes toward social issues from those toward economic issues. A more recent longitudinal tracking study by Scott addresses the effect of college specifically on three questions: attitude toward authoritarianism, toward racial prejudice, and toward economic issues. Scott’s analysis is based on the 1970 British Cohort Study which followed more than 18,000 people born in England, Scotland, and Wales in one week in April 1970 through age 42. Scott focuses on the 1520 respondents who answered all relevant questions from birth to age 42. Examples of the questions relevant to Scott’s study are the following:
- On racial prejudice: “I would not mind if my child went to a school where half the children were of another race.”
- On authoritarianism: “For some crimes the death penalty is the most appropriate sentence.”
- On economic left-right axis: “Government should redistribute income from the better off to those who are less well off.”
The results of a model used to analyze Scott’s results are shown in Fig. IV.4. The points represent the mean values on each scale from surveys at ages 16, 26, 30, and 42 from respondents who did (triangles connected by dashed lines) or did not (circles connected by solid lines) graduate from college. Higher values on each scale represent more conservative attitudes: higher levels of authoritarianism and racial prejudice and more right-wing economic values. The error bars indicate 95% confidence intervals on the mean values. At age 16 all respondents were in the non-college sample but they separate at the higher ages. The results indicate that college graduation clearly and significantly reduces authoritarianism, somewhat reduces racial prejudice, and leads to more right-wing views on economic issues. Differences show up at age 26 and remain pretty stable until age 42.
Although Scott’s results are for a British cohort, they seem pretty consistent with the data in Fig. III.11, which shows that over time as more people graduate from college Americans’ views have become more liberal on social issues and more conservative on economic issues. Averaging over such competing trends may dampen the apparent leftward moves of students in the Mariani-Hewitt study. In a separate publication Scott subdivided the British cohort sample further and revealed some small modulations of the liberalizing effect of college graduation. For example, “while all graduates become more opposed to the death penalty, the effect is almost twice as strong among AHSS [arts, humanities, and social sciences] students…an increase in local population density [from home to college communities] leads to increased social liberalism.” On the other hand, the Scott studies do not separate responses depending on which college was attended, so one cannot judge how much, if any, of the attitude shifts were tied to the liberal vs. conservative makeup of the faculty.
There are by now many studies of the increasing social liberalism of college graduates and the even stronger liberalism of those with postgraduate degrees. None of these studies provides evidence of “indoctrination” by liberal faculty. But there is evidence of some degree of self-selection: young people tend to start out more liberal than the population mean but the students who choose to attend colleges known for liberal faculty tend to be still more liberally oriented even before they enter college. But if self-selection were the only mechanism at play one would not expect the populace at large to be growing more socially liberal, as Fig. III.11 suggests. College must be inducing net leftward shifts in cultural attitudes. So what else is at play here?
Here is our opinion. The majority of students who attend college in the U.S. move away from home to do so. They are on their own for the first time in their lives. They experience a welcome sense of personal freedom and become more open to a wide array of experiences. These life events are both liberating and liberalizing. Indeed, openness to new experiences has been judged for decades in psychological research to be a key personality trait of those with liberal attitudes. College students typically interact with a more diverse set of peers in terms of race, ethnicity, religion, sexual orientation, and size of home community. Such exposure tends to increase tolerance, just as life in large, diverse urban areas does. They are exposed to contemporary research in the sciences and other fields. But beyond that a good college education should increase students’ critical thinking, give them analytical tools to assess arguments, stimulate them to question authority, conventional wisdom, and what they might have been taught prior to college at home, in church, or in high school. As openness to use these new analytical tools increases, they often see political issues in a new and deeper light. They engage more often in political discussions with peers and changes in their outlook can be reinforced by their interactions with their peer group. There is evidence from psychological experiments that analytical thinking makes people more prone to accept liberal ideas.
Upon graduation they look forward to good-paying careers. This may change their perception of left-wing economics as they may become less prone to redistribute their own wealth. But it also makes them less worried than non-college contemporaries about competition for jobs from low-education immigrants. Together with their exposure to a more diverse group of peers, this may lead to more liberal views on immigration policy. As seen back in Fig. III.4, they will tend to live in communities with many other college graduates, so that peer interactions within their communities may reinforce and sustain liberal social attitudes they adopted in college. All of these effects become even more intense in postgraduate classes and research, where students interact with an even narrower, more self-selected, more focused, more analytical, and more incisive in thought peer group. Non-college women of postgraduate age are generally having babies already, so career-oriented postgraduate women tend to become strongly opposed to restrictions on their freedom of reproductive choice. All of these changes are not examples of indoctrination but rather of the influence of life experience. The life experiences of college graduates are systematically different from those of people who don’t go to college.
V. THE POLITICS OF RESENTMENT
Partisan preferences among white voters in the U.S. have shifted from a primary economic emphasis in the 20th century to a primary cultural emphasis in the 21st century. As illustrated in Fig. V.1, the primary division in the 20th century was between wealthy white voters who favored the Republican Party’s emphasis on support for business, small government, and low taxes versus blue-collar white workers who considered their interests better represented by the Democratic Party’s support for labor unions and social safety nets. Higher-income white voters have continued in the current century to favor Republicans but lower-income white voters have undergone a dramatic shift. Republican politicians have appealed to non-college blue-collar white voters by exploiting and stoking resentments – lingering ones based on race, worries that immigrants were taking away jobs, and concerns that college-educated Democrats were spending too much energy on expanding rights for minorities and were moving the country too far and too fast to the left on social issues. As we discussed in the preceding section, an expanding cadre of college- and especially postgraduate-educated white voters were meanwhile moving to the left on social issues and joining various minorities in the Democratic Party base.
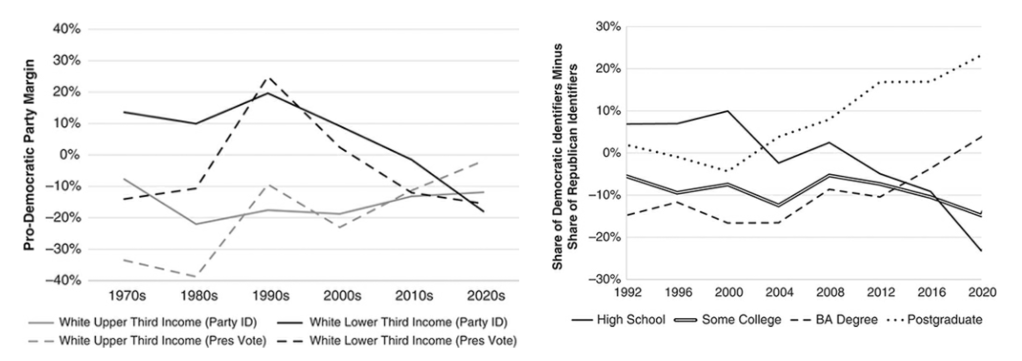
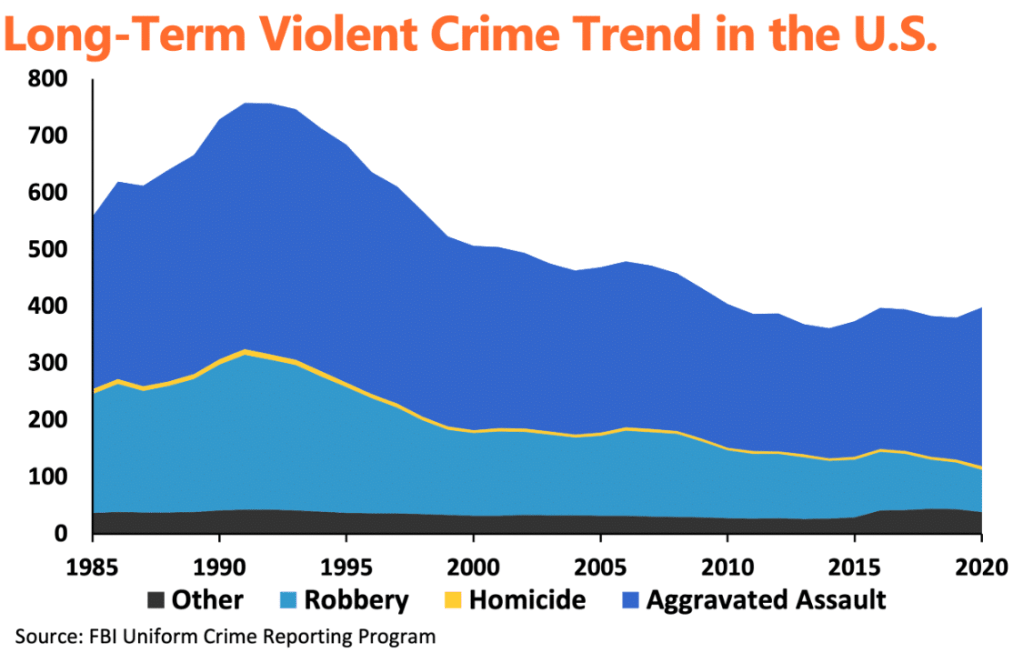
No politician has been more focused or more effective at stoking resentment than Donald Trump. His effectiveness is seen particularly in the right-hand frame of Fig. V.1 in the steep shift of white voters with no more than a high school diploma toward Republicans starting in 2016, Trump’s first Presidential campaign. His ability to attract these voters has often been based on exaggerated claims with tenuous connection to reality. For example, despite a rather remarkable reduction in U.S. crime rates, for both violent crime (see Fig. V.2) and property crime, throughout the 21st century, Trump centered much of his first campaign on convincing voters that the country had, under Obama’s leadership, descended into a period of “American carnage,” where white voters were threatened in their neighborhoods by an invading swarm of non-white criminal immigrants, which only he could stem with a wall along the U.S.-Mexico border. He welcomed claims from his white Christian Nationalist supporters that “woke” teachers and professors were intent on creating a permissive society, even “grooming” children to become homosexual or transgender. He stated that there were “some very fine people” among the marchers chanting Nazi slogans at a Unite the Right rally in Charlottesville, Virginia that resulted in the death of one counter-protester. And since he lost the 2020 election he has continuously promoted the Big Lie that the election was stolen from him, despite a lack of any convincing evidence and more than 60 rejections of his claim in U.S. courts. Nonetheless, he has made the “stolen election” lie an article of faith among many of his supporters.
The problem with campaigns based on resentment is that they only tend to divide and polarize, rather than unify. In order to remain effective, the language of resentment must become more hyperbolic over time as people become normalized to earlier divisiveness. In his second term Trump refers repeatedly to Democratic politicians as “radical left lunatics” and “traitors.” His claims are more frequently baseless. His rhetoric and his policies – often based on delusions about such issues as tariffs, climate change, and election fraud – only serve to reinforce opposing views. Partisan polarization, already at a pernicious level in the U.S., increases.
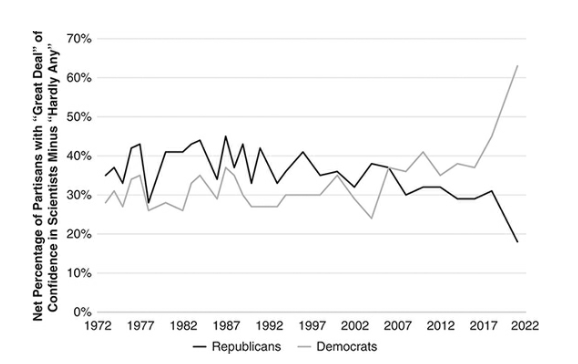
Even if stoking resentment works in winning campaigns, it provides an unworkable basis for governing. During his first Presidential term, Trump was lucky: he only had to deal with one real crisis. And that crisis – the COVID-19 pandemic – he botched. He bombarded the public at first with unfounded claims that the disease would disappear very soon, and later with incoherently mixed messages, including a suggestion that ingesting bleach might be beneficial in fighting the viral infection. His lack of leadership left the situation open for the spread of viral conspiracy theories about the origins of the disease, the nefarious motivations of scientists providing information about it, and later about the dangers of the COVID vaccines whose development Trump had spurred through his effective Operation Warp Speed. The result was a rapid and damaging partisan polarization in trust for scientists, reflected in responses to General Social Survey questions in Fig. V.3. This division was added on top of the long-simmering partisan division on trust for mainstream media and the Trump-inspired division on trust in higher education (see Fig. IV.1). The pandemic further polarized the American public in its trust in elites.
In order to win a second Presidential term in 2024 Trump had to campaign on more than mere resentment. Lingering supply chain issues and inflation left over from the pandemic had left voters focused once again on economic issues. Trump promised to bring prices down on Day 1 in office. Russia had invaded Ukraine and Trump promised to end the war promptly. In the wake of a deadly Hamas attack on Israeli citizens in October 2024, Israel was at war in Gaza. Trump promised to end that conflict as well. To quell particular concerns from his own supporters about (allegedly Democratic) pedophiles in leadership positions, Trump promised to release the full files on the criminal prosecution of Jeffrey Epstein, his former friend found guilty of sex trafficking of minors. But he also kept up his steady drumbeat about criminal immigrants, rampant crime, woke and ineffective Democrats. He claimed to know nothing about the Project 2025 Report that had been drafted by the Heritage Foundation specifically as a blueprint for a second Trump term.
Trump has failed to deliver on any of those promises. His fixation on tariffs as a tool of Presidential power and a possible long-term replacement for income taxes has led to higher prices across the board. The uncertainty caused by Trump’s frequent changes to the tariffs have stunted job growth in the U.S. Much of the money that had been raised from the American people by the regressive taxes that tariffs represent will have to be refunded to the American importing companies – but not to consumers themselves — after the Supreme Court declared a large set of his tariffs illegal. The Epstein files have become very embarrassing because of Trump’s very frequent mention in them, including serious allegations of his own participation in sexual abuse of a minor in documents his Justice Department tried hard to suppress. He not only failed to bring rapid ends to the ongoing war between Russia and Ukraine and the Israeli occupation of Gaza, but he has now embarked with Israel on a very poorly explained or thought-through invasion of Iran. Iran’s predictable response has been to block shipments through the Strait of Hormuz, leading to rapid increases in prices for oil, fertilizer, and other commodities. The oil price increases will last for some time even after this war ends, raising prices of all goods that need oil to transport them to market.
Meanwhile, he has used Project 2025 as the playbook for his administration. He has overseen Gestapo-like tactics of masked immigration enforcers forcibly detaining and deporting people, even young children, without trial, regardless of how positively those people have contributed to their communities or even of their legal status in the country. Those masked agents have also killed unarmed protestors of their tactics. He has overseen a Health and Human Services Department under Secretary Robert F. Kennedy, Jr. that has turned vaccine misinformation into policy and set back American medical research by years. He has chosen sycophants to run a Justice Department and an FBI more focused on protecting him than protecting American citizens.
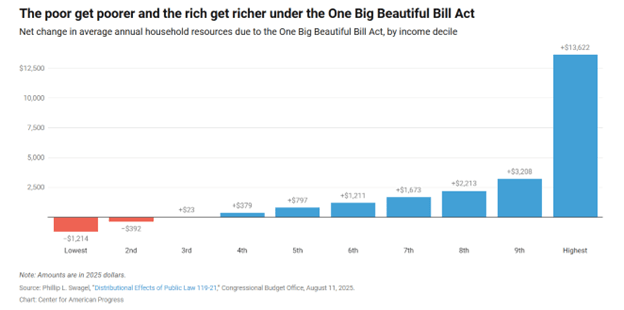
On economic matters, aside from his fixation on tariffs and his corrupt self-enrichment, he has governed as a traditional billionaire-class Republican, reducing taxes greatly on the wealthiest Americans by sacrificing government-sponsored health insurance for the neediest Americans. As illustrated in Fig. V.4 his signature One Big Beautiful Bill Act will make the rich richer and the poor poorer. He has thumbed his nose at the very real indicators of ongoing climate change by promoting fossil fuels and denigrating renewable sources of energy. The people who suffer most from Trump’s policies are low-education and low-income voters who see higher prices and poorer health, and will be disappointed by a continuing lack of accountability for the men who abused young women with Jeffrey Epstein. Those voters may be pushed to reconsider the relative weights they assign to their cultural resentments and their own economic interests.
There are lessons to be learned by all sides from America’s era of diploma-divide-driven politics of resentment. Resentment is a poor basis for governing and an unwise basis for voting. It does not put food on the table. College-educated elites and many Democratic politicians need to work harder at listening to and understanding the cultural, as well as economic, concerns of lower-education white Americans. Tolerance should extend to all Americans, not only the subjects of historical discrimination. People who have not wanted to or been able to attend college need to understand that a blanket distrust of all highly educated experts sets the stage for charlatan “populist” candidates who share their resentment of elites not because they care about these voters’ well-being, but rather because it helps to hide the candidate’s own ignorance. Electing poorly qualified people produces ignorant and dangerous policy.
VI. SUMMARY
We have documented the growing 21st-century disparities between white Americans who do not go to college and those with college and postgraduate degrees, in earnings, mortality rates, and cultural attitudes. As a steadily increasing percentage of citizens obtain college degrees, they also increasingly populate leadership ranks in industry, media, academia, and politics. Since college graduates tend to take on more liberal views on a variety of social issues, they have used their increasing influence to help move the nation toward more liberal policies, from same-sex marriage to increased opportunities for minorities to welcoming immigrants. Non-college white citizens, who still constitute a plurality of the electorate, have felt overlooked in these policy changes and been uncomfortable with the rate at which they see the nation moving to the left on social issues. Their building resentment of “elites” has caused a shift in the nature of political divisions in the U.S. The distinction between Democratic and Republican Party bases in the electorate, which was largely determined by economic issues in the 20th century, is now dominated by different views of cultural issues on the two sides of the diploma divide, including a still significant role for racial resentment among Republican voters.
Republican politicians and conservative pundits have for decades pushed the narrative that the increasingly liberal views of college graduates result from indoctrination by left-wing faculty. Surveys of students from before to after college, across a wide range of American colleges, provide no real support for that narrative. In our opinion, the trend is caused by a combination of self-selection among those students who choose to go to college and the reinforcing impact of the systematically different life experiences of college graduates compared to non-college citizens.
In order to energize their political base Republican politicians, with aid from Christian Nationalists, have adopted messages designed to stoke resentment and fear among non-college whites. Donald Trump has twice been elected President by ratcheting up these messages and spurring divisiveness. But the politics of resentment that he has championed provides no useful guidance for actually governing. The policies he is pursuing in his second term are somewhat coherent, if unpalatable, when he sticks to the smaller-government, religious-values-over-science blueprint provided in Project 2025, but they become incoherent, self-defeating, and dangerous when they are driven by his fascist tendencies, his many delusions, and his profound ignorance about economics, science, much of American law and history, and the traditions of other countries. None of the sycophants he has surrounded himself with in his Cabinet or of the fearful Republicans in Congress have dared to question his delusions. Many of his policies are most hurtful specifically to the non-college white citizens he promised to represent. For the U.S. to emerge with some semblance of its former health and status from this precarious period, we must get past the politics of resentment and that requires improved dialogue and understanding between the two sides of the diploma divide.
REFERENCES:
M. Grossman and D.A. Hopkins, Polarized by Degrees: How the Diploma Divide and the Culture War Transformed American Politics (Cambridge University Press, 2024), https://www.amazon.com/Polarized-Degrees-Transformed-American-Politics/dp/1316512010
DebunkingDenial, Live Free AND Die: Why Republican Voters are Dying Younger than Democratic Voters, https://debunkingdenial.com/live-free-and-die-why-republican-voters-are-dying-younger-than-democratic-voters/
H.J. Warraich, et al., Political Environment and Mortality Rates in the United States, 2001-19: Population Based Cross Sectional Analysis, BMJ 377, e069308 (2022), https://www.bmj.com/content/377/bmj-2021-069308.full
J. Bor, D. Cutler, E. Glaeser, and L. Ristovska, Human Capital Spillovers and Health: Does Living Around College Graduates Lengthen Life?, Aug. 2024, https://ljristovska.com/assets/docs/bor_cutler_glaeser_ristovska_areahealth.pdf
J. Willick, How the Diploma Divide Came to Dominate American Politics, Washington Post, Oct. 1, 2023, https://www.washingtonpost.com/opinions/2023/10/01/understanding-electorate-diploma-divide/
A.I. Abramowitz, The Transformation of the American Electorate, Center for Politics, March 23, 2023, https://centerforpolitics.org/crystalball/the-transformation-of-the-american-electorate/
K.A. Whitler, New Fortune 100 CEO Study: The Top Graduate Schools Attended by Fortune 100 CEOs, Forbes, Sept. 28, 2019, https://www.forbes.com/sites/kimberlywhitler/2019/09/28/new-fortune-100-ceo-study-the-top-graduate-schools-attended-by-fortune-100-ceos/
Zippia, Media Executive Education Requirements, Jan. 8, 2025, https://www.zippia.com/media-executive-jobs/education/
Edvisors, Is a College Education Worth the Cost?, May 8, 2025, https://www.edvisors.com/plan-for-college/benefits-of-college/is-college-worth-the-cost/
A.P. Carnevale, B. Cheah, and E. Wenzinger, The College Payoff: More Education Doesn’t Always Mean More Earnings, Georgetown University Center for Education, 2021, https://cew.georgetown.edu/wp-content/uploads/cew-college_payoff_2021-fr.pdf
U.S. Population Age 25+ Without a High School Diploma, https://debunkingdenial.com/wp-content/uploads/2026/03/02a50-without-a-high-school-diploma.jpg
K. Frimpong, Spatial Patterns of Educational Attainment in the Cont. US, Nov. 6, 2025, https://storymaps.arcgis.com/stories/2cb27d5db11f48c88bd3e46a4975a402
Global Burden of Disease US Health Disparities Collaborators, Life Expectancy by County and Educational Attainment in the USA, 2000-19: An Observational Analysis, The Lancet 10, E136 (2025), https://www.thelancet.com/journals/lanpub/article/PIIS2468-2667(24)00303-7/fulltext
A. Case and A. Deaton, Deaths of Despair and the Future of Capitalism (Princeton University Press, 2020), https://press.princeton.edu/books/hardcover/9780691190785/deaths-of-despair-and-the-future-of-capitalism
R. Chetty, et al., The Association Between Income and Life Expectancy in the United States, 2001-2014, Journal of the American Medical Association 315, 1750 (2016), https://jamanetwork.com/journals/jama/article-abstract/2513561
E. Paglino, E. Wrigley-Field, and A.C. Stokes, Diverging Mortality Trends by Educational Attainment in the US, JAMA Health Forum 6, e251647 (2025), https://pmc.ncbi.nlm.nih.gov/articles/PMC12166480/
Wikipedia, Hispanic Paradox, https://en.wikipedia.org/wiki/Hispanic_paradox
Pew Research Center, A Wider Ideological Gap Between More and Less Educated Adults, Apr. 26, 2016, https://www.pewresearch.org/politics/2016/04/26/a-wider-ideological-gap-between-more-and-less-educated-adults/
Wikipedia, Obergefell v. Hodges, https://en.wikipedia.org/wiki/Obergefell_v._Hodges
D. Caughey and C. Warshaw, Policy Preferences and Policy Change: Dynamic Responsiveness in the American States, 1936-2014, American Political Science Review 112, 249 (2017), https://dspace.mit.edu/bitstream/handle/1721.1/118850/DynamicResponsiveness_170627.pdf
Wikipedia, Tea Party Movement, https://en.wikipedia.org/wiki/Tea_Party_movement
Pew Research Center, Partisanship by Race, Ethnicity and Education, Apr. 9, 2024, https://www.pewresearch.org/politics/2024/04/09/partisanship-by-race-ethnicity-and-education/
A. Van Hiel, et al., Can Education Change the World? Education Amplifies Differences in Liberalization Values and Innovation Between Developed and Developing Countries, PLoS ONE 13, e0199560 (2018), https://journals.plos.org/plosone/article/file?id=10.1371/journal.pone.0199560&type=printable
YouGov, How Britain Voted in the 2024 General Election, July 8, 2024, https://yougov.com/en-gb/articles/49978-how-britain-voted-in-the-2024-general-election
Wikipedia, Racial Resentment Scale, https://en.wikipedia.org/wiki/Racial_resentment_scale
Wikipedia, God and Man at Yale, https://en.wikipedia.org/wiki/God_and_Man_at_Yale
JD Vance, The Universities are the Enemy, Nov. 2, 2021, https://www.youtube.com/watch?v=0FR65Cifnhw
L.L. Shepherd, ‘The Universities are the Enemy’: Why the Right Detests the American Campus, The Guardian, May 6, 2025, https://www.theguardian.com/commentisfree/2025/may/06/maga-republicans-us-universities
N. Gross, The Indoctrination Myth, New York Times, Mar. 3, 2012, https://www.nytimes.com/2012/03/04/opinion/sunday/college-doesnt-make-you-liberal.html
E. Sandweiss, New Indiana Law Requires Professors to Promote ‘Intellectual Diversity’ to Keep Tenure, NPR, Mar. 22, 2024, https://www.npr.org/2024/03/22/1239534856/new-indiana-law-requires-professors-to-promote-intellectual-diversity-to-keep-te
K. Parker, The Growing Partisan Divide in Views of Higher Education, Pew Research Center, Aug. 19, 2019, https://www.pewresearch.org/social-trends/2019/08/19/the-growing-partisan-divide-in-views-of-higher-education-2/
Center for Mind and Culture, https://mindandculture.org/
U.S. Bureau of Labor Statistics, National Longitudinal Surveys: NLSY97 Data Overview, https://www.bls.gov/nls/nlsy97.htm
V. Fuller, Cause or Effect? Investigating Education and Religion in the U.S., Center for Mind and Culture, Feb. 1, 2024, https://mindandculture.org/education-and-religion-us/
DebunkingDenial, Attacks on Science Education, https://debunkingdenial.com/portfolio/attacks-on-science-education/
M. Mariani and G.J. Hewett, Indoctrination U.? Faculty Ideology and Changes in Student Political Orientation, Political Science and Politics 41, 773 (2008), https://www.researchgate.net/publication/231828459_Indoctrination_U_Faculty_Ideology_and_Changes_in_Student_Political_Orientation
C. Lee, Breaking Down the Controversy Over J.D. Vance’s ‘Childless Cat Ladies’ Comment, Time Magazine, Jan. 19, 2026, https://time.com/7003456/jd-vance-childless-cat-ladies-controversy/
R. Scott, Does University Make You More Liberal? Estimating the Within-Individual Effects of Higher Education on Political Values, Electoral Studies 77, 102471 (2022), https://www.sciencedirect.com/science/article/pii/S0261379422000312?via%3Dihub
R. Scott, Why Are Graduates More Socially Liberal? Estimating the Effect of Higher Education on Political Values Through Variation in University Experience, Political Studies 73, 885 (2025), https://journals.sagepub.com/doi/pdf/10.1177/00323217241266029
D.R. Carney, J.T. Jost, S.D. Gosling, and J. Potter, The Secret Lives of Liberals and Conservatives: Personality Profiles, Interaction Styles, and the Things They Leave Behind, Political Psychology 29, 807 (2008), https://onlinelibrary.wiley.com/doi/full/10.1111/j.1467-9221.2008.00668.x
V. LoBue, How Exposure to Diversity Can Help All Children (and Adults), Psychology Today, Apr. 4, 2023, https://www.psychologytoday.com/us/blog/the-baby-scientist/202303/how-exposure-to-diversity-can-help-all-children-and-adults
O. Yilmaz and S.A. Saribay, Analytical Thought Training Promotes Liberalism on Contextualized (but Not Stable) Political Opinions, Social Psychology and Personality Science 8, 789 (2017), https://journals.sagepub.com/doi/10.1177/1948550616687092
B. Barrow, ‘American Carnage’: Looking Back at Trump’s First Inaugural Address Before His Second, Associated Press, Jan. 17, 2025, https://apnews.com/article/donald-trump-inauguration-speech-b7664360cc648dd2a5d5f2303b7490d9
R. Gray, Trump Defends White-Nationalist Protesters: ‘Some Very Fine People on Both Sides’, Aug. 15, 2017, https://www.congress.gov/118/meeting/house/116973/documents/HHRG-118-ED00-20240417-SD006.pdf
DebunkingDenial, The Demographics of Persistent Partisan Polarization, https://debunkingdenial.com/the-demographics-of-persistent-partisan-polarization/
General Social Survey, https://gss.norc.org/
A. Witherspoon, W. Craft, and A. Uteuova, Deportations Up, Job Growth Down: Trump’s Second Term So Far – in Charts, The Guardian, Jan. 22, 2026, https://www.theguardian.com/us-news/2026/jan/22/trump-first-year-second-term-charts
Center for American Progress, Poverty in American Remained Flat in 2024 But Will Likely Rise as the One Big Beautiful Bill Act Goes Into Effect, Sep. 9, 2025, https://www.americanprogress.org/article/poverty-in-america-remained-flat-in-2024-but-will-likely-rise-as-the-one-big-beautiful-bill-act-goes-into-effect/
