
January 3, 2026
III: Ancient DNA Traces Modern Human’s Genetic Origins
The rapid and efficient sequencing of DNA from living individuals has transformed the way 21st-century humans think about their ancestry. The commercial companies 23andMe and AncestryDNA have collected, respectively, about 15 million and more than 20 million DNA samples from individual humans. From these enormous samples, researchers and the companies are able to identify specific genetic markers – mostly single nucleotide polymorphisms (SNPs), or differences in single nucleotide bases that appear at precise locations along the chromosomes – that tend to distinguish different geographical populations. The most useful of these differences, known as ancestry-informative markers, or AIMs, have presumably been passed down through multiple generations to become common in specific regions. Sets of AIMs are selected for providing the highest accuracy as a marker for a specific geographic ancestry.
In general, the accuracy of geographic ancestry determination is quite good at the continent level (Europe, sub-Saharan Africa, East Asia, South Asia, Oceania and Americas), but less accurate with regard to sub-continental origins, as ancestral migration within continents lessens the predictive power of the AIMs. However, five combinations, or clusters, of AIMs have been identified that allow one some degree of discrimination of ancestors’ geographic origins within Europe, as shown in Fig. III.1.
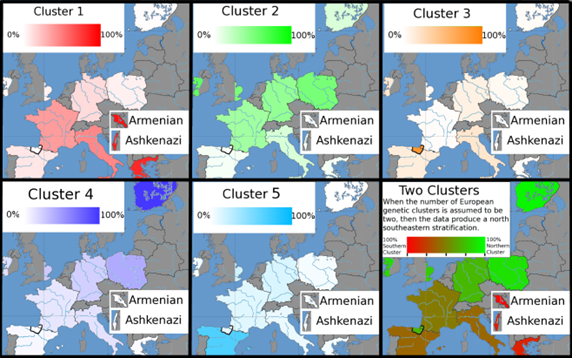
Figure III.1. Clusters of ancestry-informative markers that allow some discrimination of geographic ancestry within the European continent.
We could learn a great deal about ancient human migrations – which groups migrated where and when, and mated with whom – if we were able to carry out analogous analyses of ancient human DNA. But that requires extracting ancient DNA from the remains (bones, teeth, etc.) of large samples of prehistoric and early historic human individuals. But that task is daunting because ancient DNA is typically highly fragmented and contaminated. In living cells, DNA has self-repair mechanisms to undo temporary damage from ultraviolet or other forms of radiation or from pathogens. Not only does this repair mechanism go away in dead organisms, but enzymes contained in each cell with the function of destroying invading pathogens and cutting out damaged DNA, live on for some time to break down dead DNA. Furthermore, bacteria, possibly even from the individual’s gut, and fungi invade the decaying cells and further fragment the DNA. The longer a human has been dead, the more extensive the DNA degradation.
The first truly successful reconstruction of ancient human DNA was not from homo sapiens, but from Neanderthals, who appear to have gone extinct during the last Ice Age more than 40,000 years ago. A team led by Swedish geneticist Svante Pääbo extracted DNA samples from three different Neanderthal bones. One can get some sense of the challenges in the reconstruction from an account in Beth Shapiro’s book How to Clone a Mammoth: The Science of De-Extinction:
“Each bone contained less than 5 percent Neandertal DNA, with the remaining 95 percent or more comprising mostly environmental DNA – soil microbes and their pathogens, plants, and the like. Of the Neandertal DNA sequences that were recovered from these bones, the average fragment length was 47 base-pairs. The human genome contains 3.2 billion base-pairs, so this is a bit like having a puzzle that can only be solved by correctly assembling 68 million puzzle pieces. Of course, thanks to damage and contamination, what they actually had was far more pieces than they needed, some of which were from the same puzzle but cut in a different way and some of which actually belonged to a different puzzle.”
Pääbo’s team managed the reconstruction by using the already mapped human genome as a template, from which only a few percent differences were expected. For this monumental reconstruction Pääbo was awarded the 2022 Nobel Prize in Physiology or Medicine “for his discoveries concerning the genomes of extinct hominins and human evolution.” Pääbo’s results demonstrated for the first time that some 2% or so of modern human (non-African) DNA comprises segments characteristic of Neanderthals, a clear indication that the two species must have interbred in Eurasia during the Ice Age.
In the decade-and-a-half since Pääbo’s seminal work, the field of ancient human DNA reconstruction has expanded rapidly, with a primary contribution from the group of David Reich at the Harvard Medical School, who was one of the collaborators on the work demonstrating interbreeding of Neanderthals and homo sapiens. Reich has effectively industrialized the cost-effectiveness of extracting ancient human DNA by enriching and sequencing only those genome sections – a little more than one million of the 3.2 billion base pairs in the human genome — that are most sensitive to variations in human DNA among different populations. As seen in Fig. III.2, by 2020 the most relevant parts of human genomes had been extracted for nearly 16,000 ancient human individuals and that number is expanding rapidly (up to nearly 20,000 by 2024). That represents a strong start on a database enabling genome-wide association studies for ancient humans.
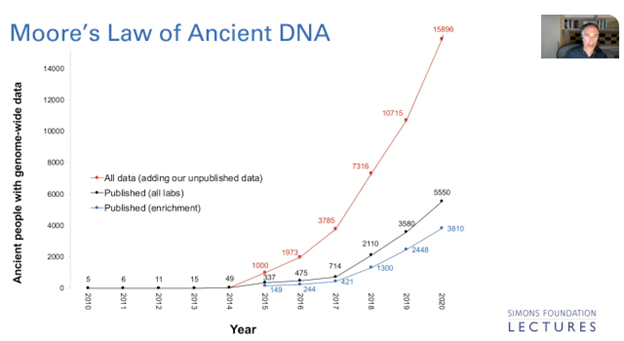
Figure III.2. The number of ancient human individuals for whom DNA has been reconstructed vs. year. The blue curve represents analyses already published by the Reich group as of 2021, the black curve includes results from other worldwide labs, and the red curve includes analyses the Reich group had done but not yet published.
Just as the calibrated radiocarbon dating discussed in Sect. II radically transformed our understanding of the independent rise of human civilizations in different geographical regions, the ancient human DNA database has radically altered earlier conceptions of the migration patterns that led to Indo-European languages. The prevailing earlier conception had European languages largely influenced by Sanskrit when early human farmers from the Anatolian region of modern Turkey migrated westward and northward to dominate modern European populations. The ancient DNA data, supplemented by radiocarbon dating of each set of analyzed human remains, paint a more complex history of human migrations into Europe.
The DNA data reveals four genetically distinct groups of humans in Eurasia more than 8,000 years ago: hunter-gatherers in Western Europe; foragers in Eastern Europe; farmers in the Levant region of the Middle East; and a distinct set of farmers in regions near today’s Iran. Reich characterizes the genomic differences among these groups as comparable to that between today’s Europeans and East Asians. Around 8.000 years ago there was a massive migration of farmers, largely from the Levant and Anatolia, into Europe, so that by 5,000 years ago European DNA samples were dominated by those farmers, with only scattered remnants of the original West European hunter-gatherer and East European forager populations, who had mixed their DNA via interbreeding by that point. But as shown in Fig. III.3, between 5,000 and 2,500 years ago, the genetic makeup of Europeans changed markedly. This was the result of a second mass migration traced to the Yamnaya people who originated in the West Asian steppe regions north of the Black and Caspian Seas, regions that today constitute parts of Ukraine, southern Russia, and Kazakhstan. The Yamnaya provide a major contribution to today’s European DNA.

Figure III.3. Ancient human DNA analyses from David Reich’s group reveal two major migrations that transformed the population of Europe: first from Near Eastern farmers between 8,500 and 5,000 years ago, and second from Asian steppe pastoralists (the Yamnaya) more recently than 5,000 years ago. DNA from these two groups have been mixed with that of original West European hunter-gatherers and East European foragers to produce the DNA mixture of modern Europeans.
By analyzing the frequency with which characteristic Yamnaya DNA shows up in ancient human DNA extracted throughout Eurasia and even into the Americas, Reich’s group and others are able to assemble an approximate map showing the worldwide spread of the Yamnaya people as a function of time. The map shown in Fig. III.4 reveals that the Yamnaya spread eastward as well as westward into Europe. They came to dominate the genetic makeup in regions of today’s Siberia and from there migrated as well to North America, where they contributed to Native American DNA. In fact, Reich’s analysis suggests that Northern Europeans today have DNA that is intermediate between that of Sardinians, who closely resemble the original Levant farmers, and Native Americans.
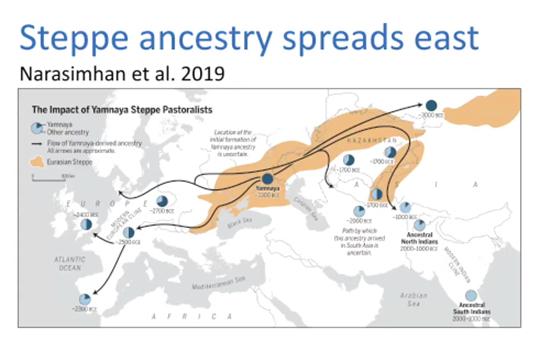
Figure III.4. Map showing the approximate spread of Yamnaya people from their ancestral homes in the Eurasian steppes (beige shading) into eastern and southern Asia, as well as into Europe. These patterns were determined from ancient human DNA analysis by David Reich’s group and other research groups. The dark shading in the circles for various regions roughly represents the frequency with which Yamnaya DNA shows up in the populations of the region at the approximate dates indicated.
It is even possible in some cases to learn something about Yamnaya mating preferences with the groups that preceded them, by specifically analyzing Y chromosome DNA, which is passed down exclusively by males, and mitochondrial DNA, which is passed down exclusively by females. For example, about 4,000 years ago there was a rapid change in the genetic makeup of Iberian populations. Yamnaya DNA shows up subsequently with a frequency of roughly 40% in the overall Iberian genome, but with nearly 100% in Y chromosome DNA. Since the Y chromosome is provided only by fathers, these ancient DNA data suggest that Yamnaya males rapidly became the preferred reproductive mates of the earlier southern European females who preceded them in the Iberian peninsula.
The analysis of ancient human DNA is a burgeoning field, with rapidly growing sample sizes, greatly expanding traditional archaeology and anthropology. The new information it has already provided about the roles of the Yamnaya people in the genomes of contemporary humans in various regions of the world is indicative of how much we have yet to learn, and will likely learn, about how human populations have arisen. The migration patterns DNA analysis reveal will also help to illuminate the spread of human languages and unexpected similarities between languages in distant geographical regions. With sufficiently large sample sizes, one can also learn about the origin – time and place — of naturally selected genetic mutations in specific genomic locations, as humans evolved to adapt to new environments.
IV: Cosmic Microwave Background Reveals Details of the Universe’s Early Existence
The discovery of cosmic microwave background radiation represents one of the great examples of serendipity in physics and astrophysics. These experiments have revealed a messenger generated some 13.4 billion years ago, carrying exceptional information about the early universe. Studies of this background radiation with new generations of land-based and space-based telescopes have transformed cosmology into a precision science. The story began with scientists Arno Penzias and Robert Wilson, shown in Figure IV.1, who were working in the early 1960s at a Bell Laboratories facility in Holmdel, New Jersey. They wanted to measure radio waves in the Milky Way as part of an effort to improve telecommunications from satellites.

Figure IV.1: Robert Wilson (L) and Arno Penzias, standing in front of the Horn Antenna at Bell Labs.
Penzias and Wilson used a Horn Antenna at Bell Labs, which had been constructed to measure radio waves that had scattered from Echo balloon satellites. Their research required them to remove all recognizable signals of microwave radiation from other sources. After accounting for all known radio and radar signals, Penzias and Wilson removed the effects of heat-related noise in their detector by cooling it to 4o Kelvin (4o Celsius above absolute zero) using liquid helium. In their efforts Penzias and Wilson detected a mysterious, persistent “noise” or hiss in their detector. The noise had no known origin. They used a number of efforts to remove it with no success. They even cleared out a flock of pigeons that had been roosting in the antenna, and cleaned pigeon droppings from the instrument, but the hiss persisted.
Penzias and Wilson carried out several tests to determine the origin of the radiation. They ruled out Earth, the Sun and our galaxy as a source of this radiation. Not only was the radiation coming from some unknown source outside our galaxy, but it was roughly 100 times as intense as they estimated and was coming from all directions. Eventually, a colleague told Penzias of a preprint by James Peebles of Princeton University. Peebles had theorized that events some few hundred thousand years after the Big Bang might have produced radiation that permeated the universe at that time. The temperature of that radiation would have decreased as the universe expanded and today would be found in the microwave region of the electromagnetic spectrum. Penzias and Wilson then contacted Robert Dicke, one of Peebles’ Princeton colleagues, to ask whether the radiation they observed might be this relic radiation produced billions of years ago in the early universe.
As it happened, a group consisting of Dicke, Peebles, David Wilkinson and P.G. Roll were at that very time planning an experiment to search for this “cosmic microwave background” (CMB) radiation. Penzias then invited Dicke to visit the Bell Labs site and look at their preliminary results. Dicke immediately recognized the Bell Labs data as an observation of the CMB radiation. He told his collaborators, “Boys, we’ve been scooped.” After that, both groups rushed to prepare papers that were submitted to Astrophysical Journal Letters in 1965. The first paper was a theoretical article by Dicke and his Princeton colleagues; they pointed out the cosmological importance of the CMB findings. The second paper was by Penzias and Wilson; it was titled “A Measurement of Excess Antenna Temperature at 4080 Megacycles per Second.” The work was very rapidly understood as a seminal contribution to our understanding of the evolution of the early universe, and Penzias and Wilson shared the 1978 Nobel Prize in Physics for their discovery. (James Peebles eventually was awarded a share of the 2019 Nobel Prize in Physics for his seminal contributions to theoretical cosmology.)
IV.1: Explanation of the Cosmic Microwave Background Radiation:
At the time of the discovery by Penzias and Wilson, there were two competing cosmological models. The first was the Big Bang theory. It posited that the universe had begun as an incredibly dense and hot ‘soup’ of particles and radiation. The universe began to expand very rapidly, as if from an explosion, about 14 billion years ago. The earlier (1929) discovery by Edwin Hubble that all galaxies in the universe were receding from us, with a velocity that increased linearly with their distance from Earth, was explained as a measurement of the outward velocities resulting from the Big Bang. A competing cosmological theory was the Steady State theory. In this cosmology, although the universe is expanding, it maintains a constant average density because new matter is continually being created. Unlike the Big Bang picture, the Steady State universe has no origin point. This theory was championed by Fred Hoyle and in the early 1960s was considered a possible explanation of the evolution of the universe. However, discovery of the CMB radiation effectively ended the Steady State cosmological picture. The CMB had a compelling origin in the Big Bang picture, while it essentially could not be understood in the Steady State cosmology. Thus, the Penzias-Wilson discovery was a major event in advancing our understanding of the universe.
In the Big Bang theory, the universe begins as an exceptionally dense and hot ‘soup’ in which an enormous amount of energy has been converted into radiation, particles and antiparticles. Following the big bang, the universe expands and cools. As the average temperature decreases, the energy of the radiation drops to levels where certain processes cease. For example, in the early universe, when electrons momentarily combine with protons to form a neutral hydrogen atom, the radiation in the universe has enough energy to strip the electrons away again from hydrogen. Thus, the early universe contains free electrons and protons, along with some light nuclei formed by combining protons and neutrons, and radiation interacts with these charged particles in a process called Thomson scattering. The net result is that the radiation does not propagate freely, it experiences interactions with these charged ions, and as a result the universe is opaque.
However, at roughly 379,000 years after the Big Bang, the radiation no longer has sufficient energy to ionize neutral hydrogen, launching what is known as the Recombination Epoch. Thus, electrons bind to protons to produce neutral hydrogen and Thomson scattering ceases. The photons thenceforth travel freely through the universe, and the universe becomes transparent. At this time in the evolution of the universe, the photons have energy corresponding to an average temperature of 3,000 Kelvin. Over time, as space expands, the wavelength of these photons increases and their temperature consequently decreases. Figure IV.2 shows the CMB radiation spectrum measured by the COsmic Background Explorer or COBE experimental collaboration. The crosses represent the intensity of the measured CMB radiation vs. frequency in inverse centimeters (1/cm). The solid curve is the predicted blackbody spectrum corresponding to a temperature T = 2.725 K, i.e., less than three degrees above absolute zero. The size of the crosses on this plot have been increased; the current uncertainty in the data is far smaller than the size of the crosses. The cosmic microwave background data represents the most precise blackbody spectrum ever measured and it determines the average temperature of today’s universe to remarkable precision.
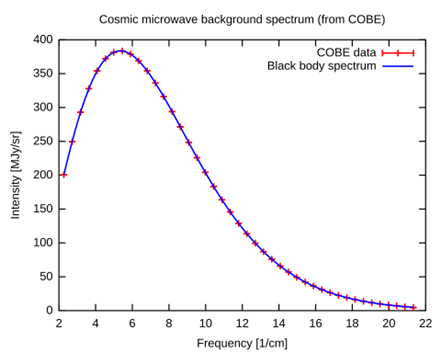
Figure IV.2: The spectrum of the cosmic microwave background radiation originally discovered by Penzias and Wilson. This shows the intensity of the CMB radiation per unit wavelength and solid angle, in MegaJoule-yr/steradian, vs. frequency in inverse centimeters. The crosses are the data measured by the COBE experiment and the solid line is the theoretical blackbody curve corresponding to temperature T = 2.725 K.
The amount of energy contained in the CMB is large. For example, the number of photons in the CMB is 400 times the number of photons in the rest of the universe. The density of photons in the CMB is a billion times the density of matter in the universe. And the current energy density of the CMB photons is much greater than the density of all photons emitted by all galaxies in the history of the universe. However, because the CMB photons have low energy, their energy density today is much smaller than the energy density associated with matter.
In addition to firmly establishing the Big Bang cosmological theory, the CMB data allows us to measure the age of the universe to great precision. If the radiation in the universe had an average temperature of 3,000 K when it was formed (when the age of the universe was about 379,000 years), and it now has an average temperature of 2.725 K, then the wavelength of the CMB photons has increased by a factor of 1,101 since that time. That implies that the universe’s dimensions have increased by the same factor, or equivalently, that its volume has increased by a factor of (1,101)3 = 1.33 billion. Combined with other cosmological data, this enables us to obtain a good estimate for the lifetime of the universe since the Big Bang. The current best value for the lifetime of the universe is about 13.8 billion years (13.77 ± 0.04 billion years from the Atacama Cosmology Telescope in 2020, and 13.799 ± 0.021 billion years from the Planck Satellite in 2015).
IV.2: Fluctuations in the CMB:
The early measurements of the cosmic microwave background radiation by Penzias and Wilson revealed remarkable evidence for the evolution of the universe. First, the existence of the CMB firmly established the Big Bang theory as the dominant evolutionary cosmology. The CMB was a natural feature of Big Bang theory, while the inability of the Steady State Model to account for the CMB led to its abandonment as a cosmological principle. Furthermore, details of the CMB provided a much more precise figure for the age of the universe. The CMB is remarkably isotropic across the universe; the temperature it reveals varies by less than one part in 25,000 with the direction from which we detect it.
But details of the CMB variations provide much more evidence for the specifics of cosmic evolution. Although extremely small, the anisotropy of the CMB now provides much more information. If we look at the present structure of the universe, we see many galaxies of varying sizes, in addition to dense clouds of gas in some regions and more or less empty space in others. We can understand the existence of galaxies as being due to the self-organizing properties of the gravitational force. If the early, dense universe had precisely the same matter density at all points, then any point in the universe would feel an equal gravitational force in all directions. However, if various locations had slightly greater matter density than others, then those points would exert a larger gravitational force on surrounding matter. The force of gravity would cause points with higher matter density to accrete more and more mass. Eventually, the clouds of matter (mainly hydrogen and helium) would reach sufficient density and temperature for nuclear fusion reactions – basically fusing protons to make helium nuclei — to take place in the center of the mass cloud. This would result in the formation of stars; and when groups of stars reached a sufficient number and density they would form galaxies.
Scientists can run simulations to determine the size of matter density variations in the early universe that would lead to the formation of galaxies. One could vary the size of these matter variations and follow the simulations to compare the number and density of galaxies with what we see today. These simulations showed that matter density fluctuations in the early universe of roughly one part in 100,000 would evolve to galaxy sizes and densities that we now observe. Scientists then hypothesized that the density of radiation in the universe would vary in the same way as matter density fluctuations, because the CMB photons we observe on Earth today last scattered toward Earth from matter at the start of the Recombination Epoch. This line of reasoning led scientists to expect that the CMB radiation should show fluctuations in temperature of the order of parts per 100,000.
Therefore, researchers designed new CMB probes that had the ability to measure these very small temperature fluctuations as a function of the angle from which the radiation reached Earth. The first experiment was the COsmic Background Explorer or COBE satellite. This NASA satellite orbited the Earth from 1989 to 1996. COBE obtained a much more precise value for the current average CMB temperature of 2.725 K. Data from the COBE experiment of the blackbody spectrum of the CMB were shown in Figure IV.2. Figure IV.3 shows details of the angular distribution of the CMB from three different experiments. The figure on the left shows the COBE results. Two of the leaders of the COBE experiment, George Smoot and John Mather, were awarded the Nobel Prize in physics in 2006. In Figure IV.3, areas colored in red show regions where the temperature was very slightly warmer than the average temperature, while blue areas show very slightly colder regions. The variations in temperature were a few parts in 100,000. Although the COBE results clearly showed that the CMB temperatures were anisotropic, they were unable to measure the fine details of angular fluctuations.
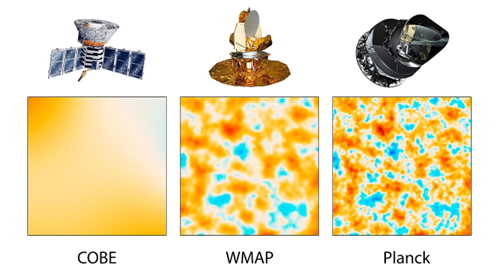
Figure IV.3: Measurements of the cosmic microwave background radiation over one section of sky by three different probes. At left: the NASA Cosmic Background Explorer (COBE) satellite, which orbited the Earth from 1989 – 1996. Although COBE established the anisotropy of the CMB (red areas are slightly hotter and blue areas colder than average), it did not have sufficient precision to provide details of the CMB structure. Middle: the Wilkinson Microwave Anisotropy Probe (WMAP), which orbited Earth from 2001 to 2010. The blue areas are those with a slightly lower temperature than the average, while the red areas represent locations with a slightly higher temperature. Right: the European Space Agency’s PLANCK satellite orbited Earth from 2009 to 2013. It managed to map out temperature variations of a part per million; as with WMAP, red areas are hotter and blue areas colder than the average.
The satellite experiments after COBE were designed to measure these CMB fluctuations with even more precision. The middle graph in Figure IV.3 shows the results of the Wilkinson Microwave Anisotropy Probe or WMAP. This satellite orbited the Earth from 2001 to 2010. It clearly had significantly greater angular resolution than the COBE satellite. It could measure fluctuations in parts per 100,000. A third satellite was the PLANCK spacecraft that was produced by the European Space Agency with assistance from NASA. The PLANCK satellite orbited the Earth from 2009 to 2013. It measured anisotropies in the CMB down to one part per million, thus with significantly higher precision than the WMAP observatory. Figure IV.4 shows the stunning results from PLANCK of angular distributions of the CMB radiation. Red areas are those with slightly higher temperature than average, while blue areas are slightly colder (in parts per million). The darker red (darker blue) areas are even warmer (colder) than average.
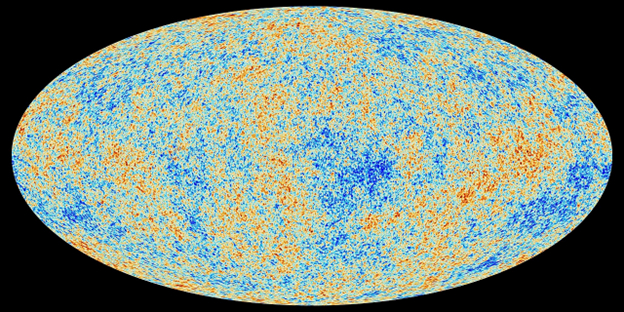
Figure IV.4: Measurement of fluctuations in the cosmic microwave background radiation temperature as a function of the angle from which the radiation reaches Earth. This was measured by the PLANCK satellite of the European Space Agency. The blue areas represent a colder than average temperature, while the red areas are slightly warmer than average. The differences are in parts per million degrees, with the largest fluctuations (deepest red or blue) corresponding to deviations of ±0.0003K from the average CMB temperature. The horizontal center line in this image corresponds to the plane of the Milky Way galaxy.
IV.4: What Can Be Tested With the CMB Data?
The exquisite measurement precision of the latest cosmic microwave background radiation and its fluctuations allows us to test models of cosmology to a level that was previously unheard of. Several of the quantities now known to a precision of 1% or better were known only to within a factor of two by the turn of this century. For example, the CMB data (together with other precise measurements of cosmic structure) provides us with the following information:
- The age of the universe (time since the Big Bang) is about 13.8 billion years.
- The Hubble constant (the rate at which distant objects are currently receding from us) is 67.80 ± 0.77 kilometers/second/Megaparsec (km/s/Mpc). This is the value determined from CMB studies, but there is currently a small tension with values determined independently from the redshifts of distant stars whose luminosity we think we know. This so-called “Hubble tension” could possibly point toward yet additional discoveries about the evolution of the universe.
- The geometry of the universe is flat, rather than curved. This means that (to within experimental accuracy) the mass-energy density of the university exactly equals a critical density. Current measurements of both matter and dark energy are consistent with the universe being flat. In terms of Euclidean geometry, in a flat universe parallel lines in the universe would remain parallel forever; as opposed to a positively curved universe, where parallel lines would eventually converge like longitude lines on Earth, or a negatively curved universe, where parallel lines would diverge as in a saddle. Measurements from both WMAP and the PLANCK satellite constrain the curvature of the universe to be zero within their margins of error.
- The energy composition of today’s universe is made up of 4.82 ± 0.05 % ordinary matter, 26.8 ± 0.4 % dark matter, and 69 ± 1 % dark energy. Dark matter is matter that does not interact with radiation (electromagnetic fields) but does exert gravitational pulls, and its presence has been inferred from measurements of the rotation of outer stars in galaxies and gravitational lensing experiments. In 1998, supernova measurements by Riess and by Perlmutter showed that nearby galaxies were receding from Earth at a faster rate than distant galaxies. This meant that the expansion of the universe is currently accelerating. For such acceleration to oppose the gravitational attraction that should lead toward contraction requires a new source of energy in the universe. That energy has been labeled “dark energy” because its source is currently unknown. The exceptional precision of the energy density breakdown hides the fact that the origin of 95% of the universe’s energy – dark matter and dark energy – is not yet understood.
- The most successful cosmological models to date have identified this “dark energy” contribution with the cosmological constant Λ first introduced by Einstein in his general relativity equations. In Einstein’s original equations the matter in the universe was assumed to be static, so a repulsive contribution was needed to counterbalance the effects of gravity (a system of masses initially at rest would collapse under the gravitational attraction) and provide stability for the universe. Following Hubble’s discovery that all galaxies were receding from one another and that the speed of recession was proportional to the distance between galaxies, Einstein’s cosmological constant was dropped from general relativity equations. However, in light of the discovery that nearby galaxies were now receding from each other faster than remote galaxies, some repulsive force was necessary. Until recently, the quantity Λ was introduced, which corresponded to a repulsive force that was constant throughout space and over time. If the dark energy density were truly constant over cosmological time it would have been completely dwarfed by radiation and matter energy densities in the early universe, but the latter densities have rapidly decreased as the universe has expanded, until today the dark energy dominates cosmic evolution. The dark energy thus corresponds today to 69% of the mass-energy density of the universe. Recent experiments have cast some doubt on the exact nature of dark energy. Experiments at the Dark Energy Spectroscopic Instrument indicate that dark energy might be changing over time, while researchers from the Atacama Cosmology Telescope claim that their latest data reinforces the notion of an unchanging cosmological constant.
- Details of the CMB lend considerable support to models of the time evolution of the universe. At present, the most successful cosmology for the universe is the ΛCDM model, or “Λ cold dark matter” cosmology. In addition to using the cosmological constant to represent dark energy, this model assumes that dark matter at lower temperature than ordinary matter was the main gravitational attractor in the early universe. A schematic picture of the evolution of the universe is shown in Fig. IV.5. The universe evolves from left to right over time. The bright area at the extreme left represents a hypothesized cosmic inflation period of extraordinarily rapid growth (which will be discussed in sub-section IV.5), the “afterglow light pattern” shows the origin of the CMB. After a period of time labeled the “Dark Ages,” the first stars are produced, followed by the development of galaxies and planets. The influence of dark energy is shown as the recent acceleration in the expansion of the universe, illustrated by the recent “opening up” of the cylinder in the picture.
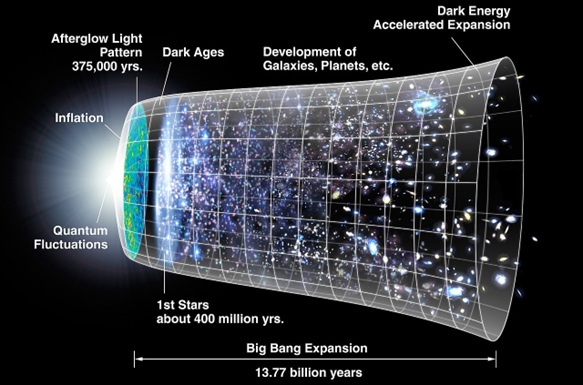
Figure IV.5: The timeline of the universe according to the ΛCDM model, the most successful cosmological picture to date of the evolution of the universe. The universe evolves from left to right over time. The bright area at the left represents the effect of cosmic inflation, the “afterglow light pattern” shows the origin of the CMB. Next, the first stars are produced, followed by the development of galaxies and planets. The influence of dark energy is shown as the recent acceleration in the expansion of the universe.
The tiny temperature deviations seen in Fig. IV.4 do not appear random. Rather they seem to exhibit some periodic behavior as a function of angle. Scientists have analyzed this pattern by expanding the measurements in a series of periodic functions, akin to the way a musical synthesizer builds up a complex sound by overlaying many different frequencies. The dependence of any one of the functions in the expansion, labeled by an index l, has a repetition period in polar angle given by 360°/l. Figure IV.6 plots the amplitude associated with each value of l needed to fit the CMB data from the Planck satellite. The curve represents an exquisite fit to the data using a ΛCDM model including inflation. The various peaks, and ratios of the peaks, provide great information on the nature of the CMB and of the matter distribution in the early universe.
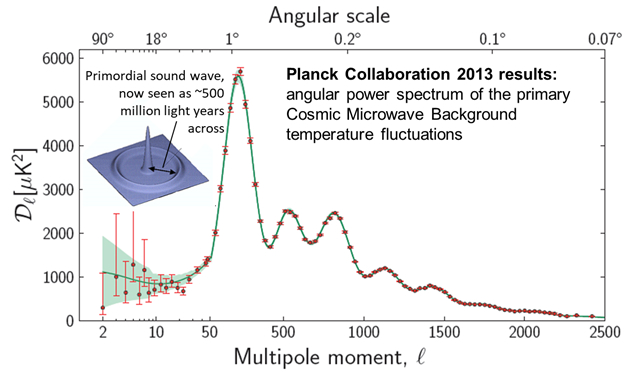
Figure IV.6: The distribution of mean-square temperature differences between pairs of points in the Planck spacecraft full-sky CMB map shown in Fig. IV.4, plotted as a function (upper scale) of the angular separation between the points in the map and (lower scale) of the index number of the periodic functions in the angular expansion. The red points are Planck measurements. The solid curve is a theoretical fit to the measurements with the ΛCDM model, from which various cosmological parameter values — including the universe’s age and energy breakdown — are deduced. The regularly spaced peaks in the data are interpreted as remnants of outgoing sound waves from overdense regions in the early universe, as suggested by the inset illustration of early universe matter densities with sound wave period spacing now equivalent, after expansion of space, to 500 million light years. The figure is from the 2013 release of Planck Collaboration results.
IV.5: Cosmic Inflation and the CMB:
Starting in the late 1970s, it was observed that various features of the distribution of the mass-energy density and the cosmic microwave background radiation were problematic. For example, as we have discussed previously, the universe is very nearly isotropic (i.e., it looks the same in all directions), the universe is flat to a very high degree of precision (to within about 1%), and the CMB radiation is isotropic to one part in 100,000. If we look at the molecules of a gas in a container with no outside forces, then after many collisions any anisotropies in the gas molecules will cancel out and the gas will achieve isotropy. However, that is because the gas particles have reached equilibrium. In the Big Bang theory, the early expansion of the universe occurs so fast that radiation does not have the time to equilibrate. For example, if you run the film of the universe’s expansion backward, the matter and radiation we now see from opposite ends of the visible universe would never seem to have been close enough to each other to communicate at light speed in the time available to them. Why, then, is our current universe flat and isotropic? The concept of cosmic inflation was developed by Alan Guth, Alexie Starobinsky and Andrei Linde. It posits that the infant universe expanded exponentially for a period between roughly 10-35 seconds and 10-33 seconds after its birth. In that time interval the universe is hypothesized to have doubled in size every 10-35 seconds! All of the mass-energy that we now find in the observable universe would have started out in an incredibly small sphere; after inflation it would have increased in size by a factor of at least 1020; but in some scenarios the amount of inflation is much greater. At the end of the inflationary period, this humongously “stretched” universe will appear flat and nearly isotropic. A schematic picture of cosmic inflation is shown in Figure IV.7. In the inflationary model behind that diagram, the universe expands by roughly 55 orders of magnitude during the blue inflationary period.
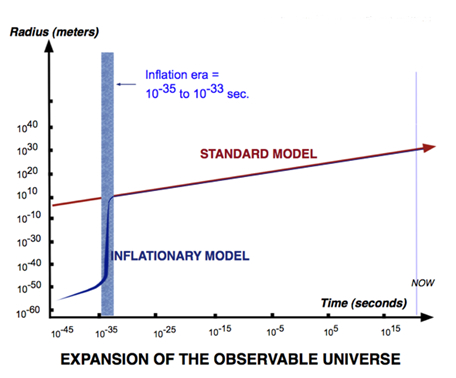
Figure IV.7: Comparison of the “standard model” of expansion of the universe with the “inflationary model.” The plot shows the radius of the universe in meters vs. time in seconds. Note that both axes are logarithmic. The inflationary model posits that between the time of 10-35 seconds after the Big Bang to 10-33 seconds, the observable universe expanded by a tremendous amount; in this schematic picture the expansion is about 55 orders of magnitude.
In addition to the process of inflation producing a universe that is flat and nearly isotropic, the inflationary theory is able to predict the size and distribution of minute anisotropies in the temperature of regions of the universe following the period of inflation. Inflation predicts the scale of these anisotropies that have been strikingly confirmed by satellite measurements WMAP and PLANCK, supplemented by ground-based measurements. Successful prediction of these anisotropies in the CMB represents a major success of the inflationary picture.
During the period of inflation, the average temperature of radiation in the universe drops by five orders of magnitude. In the theory of inflation, the energy associated with the inflation is converted at the end of the inflationary period into particles and radiation. But quantum fluctuations that occur during inflation seed tiny deviations from uniformity in the distributions of matter and radiation. Among the cosmological parameters deduced from the model fit in Fig. IV.6 are measures of such deviations that fall within the ranges predicted by inflation. These agreements are considered additional strong evidence for inflation.
More recent CMB experiments have been devised to test inflation theory further. This theory predicts a specific structure for the polarization of the CMB, i.e., the orientation of the electric and magnetic field vectors with respect to the direction of propagation of the radiation. There are two types of polarization of radiation, one called “E-modes” and a second called “B-modes” (after the decomposition of electromagnetic radiation into electric or E fields and magnetic or B fields, respectively). In particular, inflation theory predicts a specific form and magnitude for the B-modes of the CMB.
Now, how can inflation affect the polarization of radiation that originated during the Recombination Epoch, long after the inflationary period? First, the density variations originating from quantum fluctuations during inflation would have established a small preference for the last scattering direction of CMB photons, in order that they might reach Earth today. But the scattering probability for different directions may have been influenced by gravitational waves that should have been produced from the beginning by inflation. Gravitational waves squeeze and stretch space in perpendicular directions and, hence, introduce small wavelength differences between photons propagating in perpendicular directions, in an alternating pattern. The combination of density variations and primordial gravitational waves is predicted to have introduced small preferences for the CMB photons scattered in some directions over others and these preferences should show up in the CMB polarization.
In March 2014, the BICEP2 collaboration, which operated a cryogenic telescope at the South Pole, announced that it had detected B-mode polarization in agreement with some inflation-model predictions. However, later revision of the BICEP2 results showed that their measurement was dominated by effects of interstellar dust on the radiation on its path toward Earth and not of primordial gravitational waves.
Several groups are attempting to measure the predicted B-mode polarization of the CMB radiation. These experiments are particularly difficult as B-mode polarization contains several terms, one of which is produced by dust along the CMB’s path and a second which is produced by transitions from E-mode polarization (which is much larger than the B-mode contributions from inflation). These terms must be separated from the B-mode polarization due to inflation. These experiments are ongoing. Figure IV.8 shows another schematic diagram of the history of the universe. At top are shown two different types of waves generated by cosmic inflation: gravitational waves and density waves. Interference between the two waves should generate a very specific B-mode polarization of the CMB.
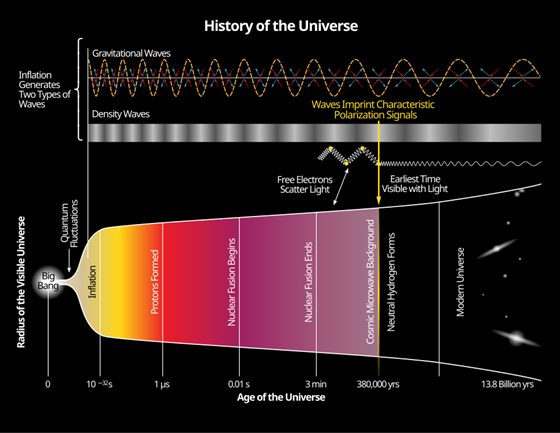
Figure IV.8: A schematic picture of the evolution of the universe. At top is shown two different types of waves generated by inflation. One is gravitational waves and the second is density waves, and both have wavelengths that increase as space and the universe expand. Interference of these two waves generates characteristic B-mode polarization signals in the CMB radiation. Several experimental groups are attempting to measure these B-mode polarization signals and to use them to check the predictions of cosmic inflation.
In summary, the cosmic microwave background story began with an accidental discovery by two researchers who were trying to remove unwanted noise from a microwave detector. However, once the significance of the discovery was understood, scientists developed microwave detectors of unparalleled precision. The details of the CMB have revolutionized modern cosmology. First, the existence of the CMB invalidated the Steady State cosmology in favor of the Big Bang theory. Later, anisotropies in the CMB have revealed details of the evolution of particles and radiation. As a result, we now know many fundamental features of cosmic evolution to a precision that was unthinkable before these experiments were carried out. At the same time, we currently remain ignorant about the microscopic origins of dark matter and dark energy, which combine to account for 95% of the energy density in today’s universe. Although the CMB photons last scattered toward Earth about 380,000 years after the big bang, it is possible we may be able to peer still much further back in time if the impacts of cosmic inflation on CMB polarization can be detected and measured. Details of the cosmic microwave background will continue to play a major role in our understanding of cosmology and the evolution of our universe.
V: Summary
One of the profound offshoots of contemporary science has been the development of measurement techniques that allow us to reconstruct the distant prehistory of humans, of the Earth, and of the universe with unprecedented precision. The results have radically altered earlier preconceptions of those histories, whether those were based on human prejudices, biblical accounts, or other invalidated theories. In this post we have considered three examples in some detail.
The measurement of decay half-lives for many radioactive isotopes has provided the input for radiometric dating of ancient objects. The calibrated measurement of ratios of carbon-14 to the naturally dominant isotope carbon-12 has revealed that Stonehenge and other prehistoric monuments were built well before the examples from early human civilizations in Egypt, Mesopotamia, Greece, or Rome that supposedly inspired them. Those results have upended the older archaeological theory known as diffusionism, which assumed that advanced cultures arose only by the migration of humans or artifacts from the classical societies. In fact, advanced societies seemed to spring up independently in different parts of the world, without clear knowledge of each other.
Measurement of isotope ratios of uranium decay daughters have upended earlier estimates of the age of the Earth and our solar system based on the Bible. They have also illuminated prehistoric collapses – long before the advent of human civilization — of the Atlantic Meridional Overturning Circulation that fuels the Gulf Stream. In light of those distant past collapses, we have reason to be concerned that ongoing melting of the Greenland Ice Sheet might lead in the future to another disastrous collapse and a deep freeze in the North Atlantic region.
The extraction and analysis of DNA samples from the remains of ancient humans have illuminated migration patterns that are upending earlier assumptions about the distant ancestry of Europeans. In particular, the mating of early Europeans with the Yamnaya people who migrated from the western Asian steppes has strongly influenced modern European DNA.
And finally, the accidental discovery of the Cosmic Microwave Background (CMB) radiation that permeates the universe has fueled measurements that underlie our modern understanding of the universe, its origins, its age, and its energy breakdown among ordinary matter, radiation, and the still mysterious dark matter and dark energy. The very existence of the CMB has invalidated earlier Steady State models of the universe, while remarkably precise satellite measurements of tiny variations in the temperature of CMB photons arriving at Earth from different directions have quantified various aspects of Big Bang cosmology.
As humans’ technology advances in the future, we are likely to learn ever more details about our distant past.
References:
J.R. Arnold and W.F. Libby, Age Determinations by Radiocarbon Content: Checks With Samples of Known Age, Science 110, 678 (1949) https://www.science.org/doi/10.1126/science.110.2869.678
Nobel Prize in Chemistry, 1950, Willard Libby https://www.nobelprize.org/prizes/chemistry/1960/summary/
Wikipedia, Dead Sea Scrolls https://en.wikipedia.org/wiki/Dead_Sea_Scrolls
Wikipedia, Carbon Dating the Dead Sea Scrolls, https://en.wikipedia.org/wiki/Carbon_dating_the_Dead_Sea_Scrolls
Wikipedia, Partial Test Ban Treaty https://en.wikipedia.org/wiki/Partial_Nuclear_Test_Ban_Treaty
Wikipedia, Dendrochronology https://en.wikipedia.org/wiki/Dendrochronology
Wikipedia, Sir Flinders Petrie https://en.wikipedia.org/wiki/Flinders_Petrie
Wikipedia, Oscar Montelius https://en.wikipedia.org/wiki/Oscar_Montelius
Wikipedia, Sir Grafton Elliot Smith https://en.wikipedia.org/wiki/Grafton_Elliot_Smith
Wikipedia, Gustav Kosinna https://en.wikipedia.org/wiki/Gustaf_Kossinna
Wikipedia, Kon-Tiki https://en.wikipedia.org/wiki/Kon-Tiki_expedition
Wikipedia, Stonehenge https://en.wikipedia.org/wiki/Stonehenge
Gerald Hawkins, Stonehenge Decoded, Doubleday and Co., 1965 https://www.abebooks.com/servlet/BookDetailsPL?bi=31293111579
Wikipedia, Aubrey Holes https://en.wikipedia.org/wiki/Aubrey_holes
Mike Pitts, Gerald Hawkins Obituary, The Guardian, July 24, 2003 https://www.theguardian.com/news/2003/jul/24/guardianobituaries.highereducation
Wikipedia, Convergent Evolution https://en.wikipedia.org/wiki/Convergent_evolution
23andMe, https://www.23andme.com/
C. Gramling, Benchmarks: May 18, 1952: Stonehenge’s Age Solved with Carbon-14, Earth Magazine, Oct. 26, 2015, https://www.earthmagazine.org/article/benchmarks-may-18-1952-stonehenges-age-solved-carbon-14
C. Renfrew, Before Civilization: The Radiocarbon Revolution and Prehistoric Europe {Alfred A. Knopf, New York, 1973), https://www.amazon.com/Before-civilization-radiocarbon-revolution-prehistoric/dp/0394481933/
Stonehenge: The Heel and Station Stones, http://www.lundyisleofavalon.co.uk/stonehenge/stnpik05.html
D. Graeber and D. Wengrow, The Dawn of Everything: A New History of Humanity (Farrar, Straus and Giroux, 2021), https://www.amazon.com/Dawn-Everything-New-History-Humanity-ebook/dp/B08R2KL3VY
Wikipedia, Age of Earth, https://en.wikipedia.org/wiki/Age_of_Earth
DebunkingDenial, Climate Tipping Points: Coming Soon to a Planet Near You?, https://debunkingdenial.com/climate-tipping-points-coming-soon-to-a-planet-near-you/
E. Böhm, et al., Strong and Deep Atlantic Meridional Overturning Circulation During the Last Glacial Cycle, Nature 517, 73 (2015), https://www.nature.com/articles/nature14059
Wikipedia, Younger Dryas, https://en.wikipedia.org/wiki/Younger_Dryas
Ancestry DNA, https://www.ancestry.com/dna/
Wikipedia, Svante Pääbo, https://en.wikipedia.org/wiki/Svante_P%C3%A4%C3%A4bo
B. Shapiro, How to Clone a Mammoth: The Science of De-Extinction (Princeton University Press, 2015), https://www.amazon.com/How-Clone-Mammoth-Science-Extinction/dp/0691157057/
Nobel Prize in Physiology or Medicine 2022, https://www.nobelprize.org/prizes/medicine/2022/paabo/facts/
Wikipedia, David Reich (geneticist), https://en.wikipedia.org/wiki/David_Reich_(geneticist)
C. Renfrew, Archaeology and Language: The Puzzle of Indo-European Origins (Cambridge University Press, 1987), https://www.amazon.com/Archaeology-Language-Puzzle-Indo-European-Origins/dp/0521354323/
D. Reich, Ancient DNA and the New Science of the Human Past, Simons Foundation Lecture, March 3, 2021, https://www.youtube.com/watch?v=QoGmPJJS3X8&t=2318s
D. Reich, Who We Are and How We Got Here, Simons Foundation Lecture, June 27, 2025, https://www.youtube.com/watch?v=rfLxqV03PcE
R.H. Dicke et al., Cosmic Black-Body Radiation, Astrophysical Journal 142, 414 (1965) https://adsabs.harvard.edu/full/1965ApJ…142..414D
A.A. Penzias and R. W. Wilson, A Measurement of Excess Antenna Temperature at 4080 Mc/s, Astrophysical Journal 142, 419 (1965), https://ui.adsabs.harvard.edu/abs/1965ApJ…142..419P/abstract
Wikipedia, Fred Hoyle https://en.wikipedia.org/wiki/Fred_Hoyle
Wikipedia, Thomson Scattering https://en.wikipedia.org/wiki/Thomson_scattering
NASA, COBE (Cosmic Background Explorer) https://science.nasa.gov/mission/cobe/
Wikipedia, Cosmic Microwave Background https://en.wikipedia.org/wiki/Cosmic_microwave_background
Louise Lerner, New View of Nature’s Oldest Light Adds Fresh Twist to Debate Over Universe’s Age, U of Chicago News, July 15, 2020 https://news.uchicago.edu/story/new-view-natures-oldest-light-adds-fresh-twist-debate-over-universes-age
European Space Agency, Planck Science Highlights, 2015 https://www.esa.int/Science_Exploration/Space_Science/Planck/Planck_science_highlights
Wikipedia Wilkinson Microwave Anisotropy Probe https://en.wikipedia.org/wiki/Wilkinson_Microwave_Anisotropy_Probe
Wikipedia Planck (spacecraft) https://en.wikipedia.org/wiki/Planck_(spacecraft)
Anil Ananthaswamy, The Hubble Tension is Becoming a Hubble Crisis, Scientific American Apr. 2, 2025 https://www.scientificamerican.com/article/the-hubble-tension-is-becoming-a-hubble-crisis/
Wikipedia, Gravitational Lens https://en.wikipedia.org/wiki/Gravitational_lens
A.G. Riess et al., Observational Evidence from Supernovae for an Accelerating Universe and a Cosmological Constant, Astronomical Journal 116, 1009 (1998) https://iopscience.iop.org/article/10.1086/300499
S. Perlmutter et al., Measurements of Ω and Λ From 42 High-Redshift Supernovae, Astrophysical Journal 517, 565 (1999), https://arxiv.org/abs/astro-ph/9812133
Planck Collaboration, Planck 2013 results. I. Overview of products and scientific results, Astronomy & Astrophysics 571, A1 (2014), https://arxiv.org/abs/1303.5062
Wikipedia Cosmological Constant https://en.wikipedia.org/wiki/Cosmological_constant
Katrina Miller and Dennis Overbye, ‘More Than a Hint’ That Dark Energy Isn’t What Astronomers Thought, New York Times, Mar. 19, 2025 https://www.nytimes.com/2025/03/19/science/space/astronomer-desi-dark-energy.html
Wikipedia Dark Energy Spectroscopic Instrument https://en.wikipedia.org/wiki/Dark_Energy_Spectroscopic_Instrument
Wikipedia Atacama Cosmology Telescope https://en.wikipedia.org/wiki/Atacama_Cosmology_Telescope
BICEP2, Kavli Institute for Particle Astrophysics and Cosmology, Stanford University https://kipac.stanford.edu/bicep2
Ron Cowen, Gravitational Waves Discovery Now Officially Dead, Nature News, Jan. 30, 2025 https://www.nature.com/articles/nature.2015.16830
