
October 27, 2023
IV. likely impacts in the 21st century
When it was first introduced by Warren Thompson in 1929, the Demographic Transition Model shown in Figure II.1, had four stages. In the fourth and final stage of a nation’s demographic transition, life expectancy was high and continued to rise slowly, while the fertility rate dropped to a value near 2.1, the value needed to maintain a stable population. However, we now realize that there is a fifth stage. In that stage, while life expectancy continues to increase slowly, fertility rates drop below 2.1. In this scenario, a country’s population will decline. At this point in time, nearly every developed country has a fertility rate below 2.1, as was shown in Figure II.3. In that figure, it is apparent that the U.S., Iran, Brazil, China, Canada, Thailand, Italy and Japan, for example, all have fertility rates below the stable number of 2.1.
Countries that are in stages 4 and 5 should experience a life expectancy that is high and slowly increasing. This is shown in Figure IV.1 for fifteen of the countries in the group of 37 democratic countries that make up the Organization of Economic Cooperation and Development or OECD. The graph covers the five-year period 2015 – 2020, and it shows the years of remaining life expectancy in these countries for men aged 65 years. At present, the OECD country with the greatest years of life expectancy for men aged 65 is Australia with 20 years; the lowest in this survey is Turkey with just over 16 years.
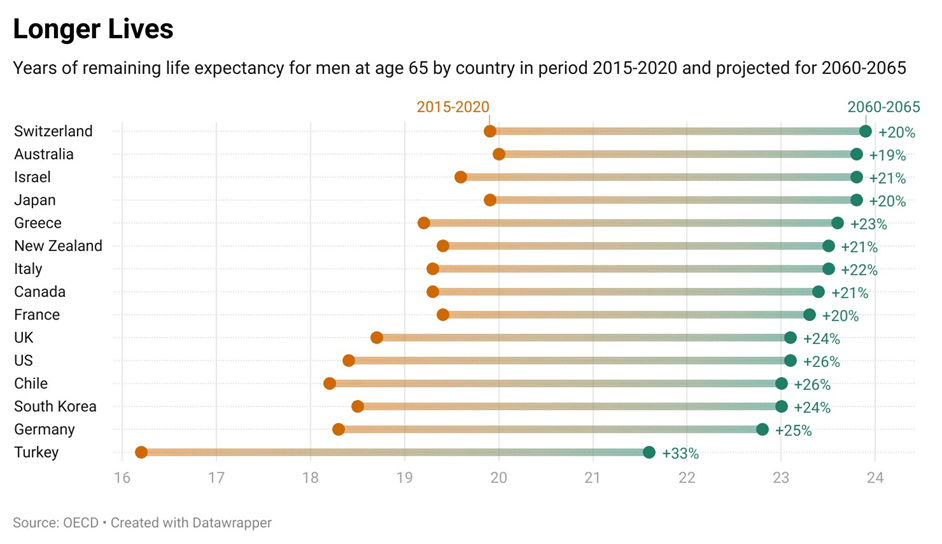
When extrapolated to the interval 2060 – 2065, the remaining life expectancy is predicted to increase for all 15 countries in this survey. Furthermore, the life expectancy curves for nearly all countries except Turkey and Germany are predicted to show a significant compression, with 13 of these OECD countries having a life expectancy for males aged 65 between 23 and 24 years. Thus, people in all of these OECD countries are expected to live longer later in the 21st century.
In Figure II.3, projections of fertility rates are made into the near future (2045-2050) and somewhat more distant future (2095 – 2100). In those projections, based on calculations made in 2012 by the UN Population Division, by 2095 only Zambia and a few African countries will have fertility rates above the stable number 2.1. What are the near-term implications (in this post, we choose 2100 as the end of the “near term”) of this rapid drop in fertility rates? First, we expect to see the rapid decrease in recent births to skew the age distribution of the population. A convenient visual representation of this phenomenon is to plot the “old age dependency ratio” (OADR) in various countries over time. The age dependency ratio is the ratio of that segment of the population aged 64 or older to the segment of the population in the 20-64 age group, the group where we expect to see the bulk of the working population. This ratio is typically multiplied by 100 and we adopt this convention.
Age dependency ratios are shown in Figure IV.2. It plots the old age dependency ratio for six countries – South Korea, Japan, Germany, Spain, Sweden and the U.S. – together with the average of the 37 democratic countries that make up the OECD. The graph was compiled in 2015; it plots the age dependency ratios of these countries from 1950, and it includes projections up to the year 2075. In 1950, the age dependency ratio was less than 20 in all countries studied. By 2015, the smallest age dependency ratio of these six nations was South Korea with a value of 19.6, while the largest was Japan with a value of 48; the U.S. was second lowest with a ratio of about 24. However, when we project to 2075, all of these OECD countries are predicted to have age dependency ratios greater than 40. South Korea is predicted to have the highest age dependency ratio of 80.1, while the U.S. would have the lowest ratio in this group of about 46.

One of the results of a dramatic increase in the number of senior citizens, together with a corresponding decrease in the 20 – 64 year age range, is a decrease in the number of economically productive citizens. Figure IV.3 shows the relationship between age, labor income and consumption for a group of 24 developed nations. Here, ‘labor income’ includes wages, benefits, income of self-employed, and an estimate of the value of labor by unpaid family members. Figure IV.3 shows clearly that adults in the prime age range of 25 – 59 produce more income than they consume, while very young and old citizens consume more than they produce. Thus, as a population ages, a smaller cohort of prime-age citizens will be required to produce more for an increasing number of senior citizens. Furthermore, it is the working age population that is needed to contribute essential services as well as tax revenue in support of programs for the seniors. As the 21st century progresses, more essential jobs may be taken over by robots and automated systems, but these will not contribute to a country’s tax base.

We will now discuss short-term results (that is, results projected from now until 2100) of current declines in fertility rates for three countries. The first country, South Korea, is an example of an Asian country with a very low fertility rate. The results from South Korea should be similar to those projected for countries such as Japan and China. The second example will be Kenya. This will serve as an example of an African country that currently has quite a large fertility rate. However, if current trends of migration from rural to urban areas continue, and if women receive more education and become more empowered, one could see a rapid decline in African fertility rates. We will discuss the changes that could ensue if those trends continue. The last country will be the United States. This can serve as a model for the democracies in North America and Europe.
South Korea: A Glimpse Into the Future?
In the projections of the age profile of a country in Fig. IV.2, the “canary in the coal mine” is South Korea. As was mentioned in Section III, the South Korean population increased very rapidly after the Korean War, and the population doubled between 1950 and 1985. However, in recent years the South Korean fertility rate has dropped precipitously to a level of about 1.17 in 2018, as shown in Figure III.3, and even further to a level near 0.8 most recently. Because that country’s fertility rate is so far below the rate needed to stabilize the population, South Korea is likely to experience a number of dramatic changes in the coming decades. First, the extremely rapid rise in the age dependency ratio will mean that a large fraction of the country will be above retirement age; conversely, the population able to attend school, to work and to make up the military will dramatically decrease. The predicted effect on the total population is shown in Figure IV.4. The red curve starting in the upper left corner is the South Korean fertility rate (values on right-hand axis); in 2018 it was 1.17, far below the 2.1 necessary for a stable population. The total South Korean population in 2018 was 51.2 million. The graph shows three different scenarios for the South Korean population (left-hand axis) up to 2100. The amber curve is the prediction of the UN Population Division. Most economists consider this estimate to be significantly higher than the most likely result. The dashed purple curve shows the population if the fertility rate remains at about a value of 1.17, while the dashed blue curve shows the population if the fertility rate continues to decrease, as suggested by the most recent data for Korea. The two more pessimistic scenarios project a Korean population of between 40 – 48 million people in 2050, and 20 – 30 million in 2100.

As we explained in Section III, in general there are a number of causes for declining fertility rates, most prominently:
- Empowerment of women, as represented by more education for women, increased opportunities for women in the workforce, and more bodily autonomy as represented by access to birth control
- Movement of the population from rural to urban regions
- A decline in the power of organized religion, which often advocates for larger families and supports male dominance in society.
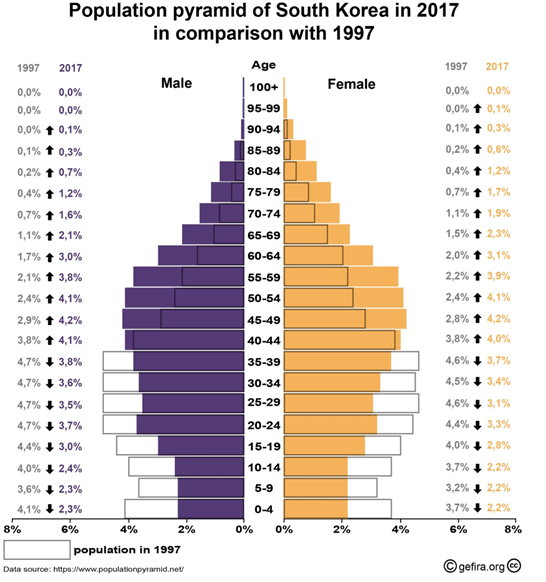
All of these factors have contributed to the sharp decline in South Korean fertility rates. The effect on the age distribution in South Korea is shown in Fig. IV.5. This depicts the “population pyramid,” which shows the fraction of the population in 5-year bins from 0 to 100 years. Blue bars depict the age distribution for the male population and orange bars the female population in 2017, and the figure compares that with the population distribution (transparent bars) in 1997. From Fig. IV.5 it is apparent that in 2017 there were fewer South Koreans in the age group 0 – 40, and more in the age group 40 – 100, than in 1997. These are dramatic changes over a single generation.
In addition to the general causes for low fertility rates, there are additional factors that are specific to South Korea. For one, South Koreans have the longest working hours in the free world. This leaves relatively little family time. In large cities the cost of living has increased sharply, making it difficult for families to raise children. This difficulty is exacerbated when those families have to support more elders. In addition, in response to the rapid increase in senior citizens, South Korea has raised the retirement age. This makes it harder for young Koreans to find employment. When women become pregnant, they frequently lose their jobs; and maternity leave is rare. All of these factors provide a disincentive to have children. A relatively large number of South Koreans are atheists, so the power of religion is low in this country; also, South Korea has one of the highest suicide rates in the world. Many of these suicides are elderly persons living alone in circumstances of poverty. South Korea also has the world’s highest consumption of hard liquor, and most suicides are committed under the influence of alcohol.
In a country such as South Korea, the number of schools and universities are expected to decline rapidly, as there are fewer and fewer school-age citizens. On the other hand, the dwindling number of working-age citizens will have to provide financial and health support to an ever-increasing population fraction of South Korean seniors. Providing seniors with pensions and social security would place tremendous financial burdens on the small working-age population. In these circumstances, it is not clear how countries can maintain their support to retired seniors. One suggestion is that South Korea might dramatically increase the number of women in the workforce, to compensate for the sharp decrease in the 20 – 64 age group. This might increase the number of people in the Korean workforce, but it would probably also further decrease the fertility rate, since there is very little childcare available in that country. At present, the South Korean government has developed plans to raise pensions, dramatically increase the number of jobs and wages for older workers, and increase the availability of housing for the elderly. Regardless of how the South Korean government chooses to handle this, it suggests that the country will need to consider dramatic changes from their current cultural practices.
Another area that will be exacerbated by declining populations of working-age people is that there will be many fewer South Koreans able to serve in the military. It is unclear how this will affect South Korea’s military and diplomatic posture. It is conceivable that South Korea might consider military action in the near future, before their ranks begin to shrink. Alternatively, it might prove an incentive for increased reliance on diplomacy rather than military might. It might also provide an incentive for South Korea to rely more on weapons systems that don’t require a large number of troops; for example, it could cause an increased focus on the use of drones for surveillance and attack. The South Korean government is also considering a dramatic increase in robots in the workplace, in homes and in the military. In any case, South Korea will be entering uncharted territory as the large demographic changes begin to take hold.
One potential “fix” for these circumstances would be to raise the age at which people retire. The government would not have to provide pensions until workers reached the retirement age, and these older citizens could still be part of the workforce. We note that in April 2023, French President Macron received permission from the Constitutional Council to raise the retirement age from 62 to 64; Macron claimed that without this change (enacted without a popular vote), the French pension system would be running an annual deficit of 13.5 billion Euros by the year 2030. Macron’s proposal has proved exceptionally unpopular with French workers. However, it is a useful exercise to calculate the magnitude of the change in retirement age that would be necessary to keep the labor force at roughly its current level.
Such a calculation has been carried out by Geppert and Boulhol. They looked at the OECD countries and calculated the increase in the retirement age that would keep the old-age dependency ratio or OADR constant from 2015 to 2050. The old-age dependency ratio is given by the ratio of the people over the working age (now defined as 65 years old) to the working-age population (this is defined as the number of people in the 20 – 64 age range). For example, if the maximum working age was re-defined as 70 years instead of 65, then the new old-age dependency ratio would be the ratio of citizens 70 and older to those between 20 and 69. For the average of all OECD countries, keeping the old-age dependency ratio constant would require increasing the retirement age by 8.4 years. This is a stunning result and shows that ‘normal’ increases considered by OECD countries in the retirement age of roughly 2-4 years (represented by black triangles in Fig. IV.6, and roughly matched to expected increases in life expectancy by 2050, indicated by red dots in the figure) will generally fall far short of keeping the OADR constant.
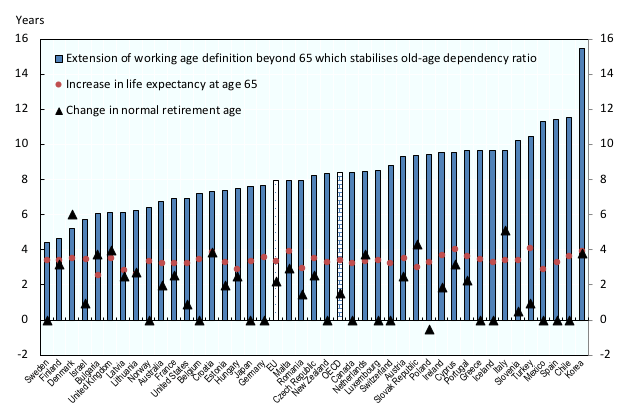
The results of Geppert and Boulhol are shown in Fig. IV.6. They show the increase in retirement age beyond 65 necessary to keep the OADR constant for all OECD countries; the extension of the working age for each country is represented in the figure by blue bars, increasing from left to right. On this graph, the United States comes in at #12 among OECD countries, and the retirement age would have to increase by about 7 years to keep the OADR constant. Note that the country with by far the largest necessary increase in retirement age is South Korea, with a whopping proposed extension of nearly 16 years!
One may conclude from Fig. IV.6 and the recent experiences in France that addressing the problem of rapidly increasing OADR values by increasing retirement ages alone is likely to be politically untenable in most OECD countries. Dramatic increases in retirement age may have the collateral effect of drying up employment opportunities for young people. That, in turn, could lead many young people to emigrate, further exacerbating the country’s age distribution problems. And since most creative advances in the arts, science, and technology are introduced by people at the lower end of the prime age group, countries that see a young person drain are likely to become stagnant and susceptible to hostile takeovers.
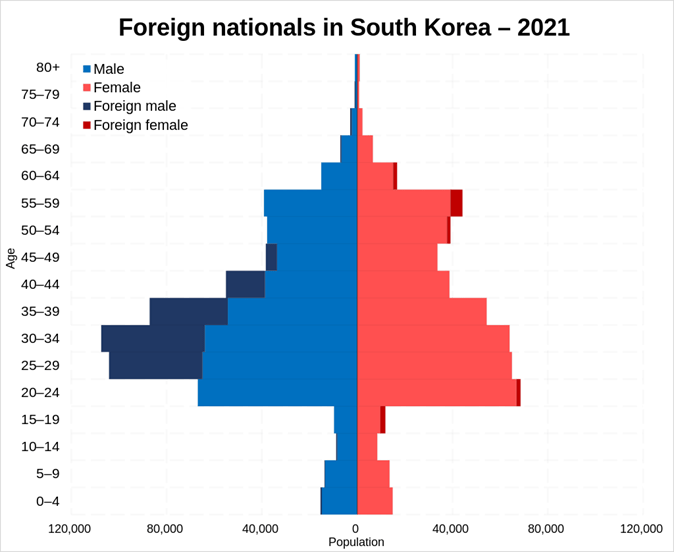
Perhaps the most effective way for developed countries to avoid a population decrease despite low fertility rates is for countries to welcome immigrants. We will discuss this in more detail in our discussion of short-term impacts for the United States. However, this is probably not a feasible option for South Korea. In 2022, 4.4% of the South Korean population were foreigners, and this includes temporary workers. The age distribution of the foreign-national South Korean population in 2021 is shown in Figure IV.7. Foreign males are shown in the blue areas and foreign females in red, with foreign nationals (mostly Chinese) of Korean descent represented by lighter colors and all other foreign nationals by darker colors. The male foreign nationals are most numerous in the 25 – 50 age range. Although the number of foreign residents in South Korea has been steadily increasing since 1980, half of the foreign residents are Chinese, and more than half of those are Chinese citizens who are ethnic Koreans.
While the South Korean government is receptive to immigrants, the country is still one of the most ethnically homogeneous in the world. People wishing to emigrate to South Korea are aware of the necessity to speak Korean, and the difficulty of fitting in to such an insular culture. A similar difficulty is faced by Japan (where 2.4% of the citizens are foreign) and China (where roughly 0.1% of the population is foreign). Without dramatic increases in immigration, these three countries are projected to lose population during this century. In 2017 the population of South Korea was 51.4 million, that of Japan was 120 million, and the Chinese population was 1.4 billion. By 2100, the projected population of South Korea is 30 million, that of Japan 75 million, and the 2100 population of China is projected to be 750 million people. Note that these projections are subject to considerable uncertainty. This is reflected in the wide spread of future projections of the total world population shown in Figure II.6.
Population projections for Kenya:
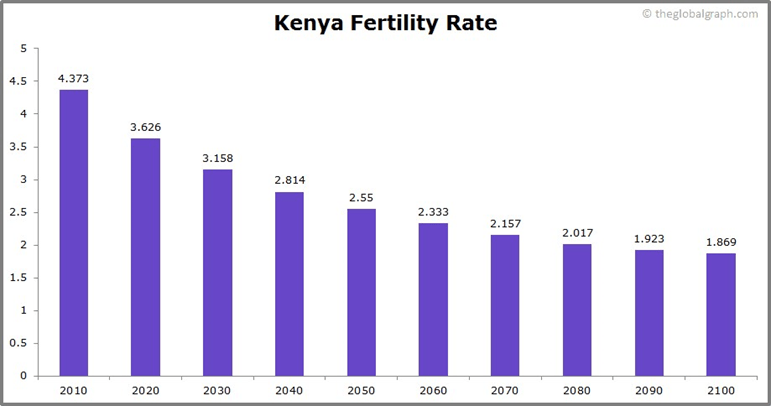
We choose Kenya as the archetype of an African nation, and we will discuss current trends and future projections for this country. In 2020 the population of Kenya was 53.5 million. At present, the population is increasing. In 2023, the birth rate per 1,000 people was 27.36, a 1.2% decline from 2022; the death rate per 1,000 people was 5.34, a 0.65% decline from the previous year. The fertility rate in Kenya is currently very high – in 2020, it was 3.63, giving Kenya the 43rd largest fertility rate in the world. Figure IV.8 shows the projected fertility rate in Kenya as a function of time. The current fertility rate of 3.63 will produce a large increase in population; even with the fertility rate falling steadily, by 2100 Kenya is projected to have a population of 140 million, which would make it the 19th largest population of any country. Life expectancy in Kenya is also projected to increase steadily; in 2020 it was 67.9, which ranked 150th among world countries. In 2100 life expectancy is projected to be 80.3 years.
Projections of the population and fertility rate in Kenya depend strongly on trends in that country. The population will increase very rapidly if the fertility rate remains high, the country remains mainly rural, educational and employment opportunities for women remain low, and women are largely not empowered. The fertility rate could also remain high if Kenyan society remains centered around kinship ties; this tends to keep fertility rates higher than in urban environments where kinship bonds tend to be weaker. On the other hand, economists such as Bricker and Ibbitson predict that trends toward urban living, and opportunities and empowerment of women, are likely to increase fairly rapidly in Kenya. The use of contraceptives by Kenyans has also increased greatly in the past 15 years. Conservative estimates for African demographics suggest that the population of Kenya would likely be approaching a stable peak number in 2100. While organizations such as The Global Graph.com predict that the Kenyan population growth rate will be 0.44% in 2100, Bricker and Ibbitson suggest that the growth rate could approach zero as early as 2050. They believe that recent demographic trends in Kenya will continue or accelerate, leading to much lower population figures by the end of the 21st century.
Fertility rates in many African countries are much higher than in the rest of the world, as is shown in Fig. II.4. If current trends persist with large migration of Africans from rural areas to cities, by the year 2100 several African cities are projected to have massive populations. City population projections have been carried out by Hoornweg and Pope. The three largest cities in the world in 2100 are all projected to be in Africa: Lagos, Nigeria with a population of 88.3 million; Kinshasa, Congo with a population of 83.5 million; and Dar es Salaam, Tanzania with a population of 73.7 million. Nairobi, Kenya is projected to have a 2100 population of 46.7 million, making it the 12th largest city in the world at that time. It will be difficult for such massive cities to provide adequate employment opportunities for so many citizens. Thus, it is likely that the 21st century will also see massive migration from such cities out of Africa. Africans may come to dominate the supply of immigrants sought by more highly developed countries to supplement their labor forces.
At present, several African countries are unable to provide sufficient housing for the large numbers of people moving from rural areas to large cities. As a result, the largest African cities typically have very large ‘tent cities.’ In these areas, there is frequently no running water or sewers, which exposes the inhabitants to disease. Much of the population in these areas lives in tents or other substandard housing, and enormous garbage heaps provide home to rats and other vermin. If such conditions persist, by the year 2100 one could see truly massive amounts of poverty and disease in the largest African cities.
Projections of population in Africa have significantly higher uncertainty than in other continents. There are several developments that generally lead to decreases in fertility rates, such as movement of populations from rural to urban environments, increased education for women, use of contraceptives, and a decrease in the influence of religions that advocate for large families. However, in Africa today there are countervailing trends that could keep fertility rates high. One of these is the prevalence of male dominance. One way that this manifests itself is in physical or sexual violence towards women; currently one in three African women is the victim of such violence. Most African countries have strong prohibitions against abortion, such that one-third of all unsafe abortions in the world occur in Africa. A third statistic is that 125 million African women today were married before the age of 18. If trends such as these remain strong in Africa, populations there could increase much more rapidly than is expected.
And it should be noted that dramatic changes can occur when either warfare or radical government change takes place. Exhibit A for this type of change is Afghanistan. During the two-decade war between the US-backed regime and the Taliban, the human rights of Afghan women were dramatically increased. However, almost immediately following the U.S. military withdrawal from Afghanistan in August 2021, the situation for women deteriorated drastically. In March 2023, the U.N. Office of Human Rights reported that since the takeover by the Taliban “Girls in Afghanistan have been banned from secondary school and women from tertiary education. Women and girls have been banned from entering amusement parks, public baths, gyms and sports clubs for four months. Women have been banned from working in NGO offices … [they] have been wholly excluded from public office and the judiciary. Today, Afghanistan’s women and girls are required to adhere to a strict dress code and are not permitted to travel more than 75 km without a mahram [a family member with whom marriage would be considered permanently unlawful]. They are compelled to stay at home … it’s a sobering reminder of how swiftly and aggressively women’s and girls’ rights can be taken away.”
As changes in the status of women can occur virtually overnight in situations of war, coups or natural disasters, one must take future population projections with a grain of salt. Unpredictable occurrences can make major changes in future population projections.
Near-Term Projections for the United States:
Like all developed countries, the United States currently has a birthrate below 2.1, the rate needed to produce a stable population. In 2020 the U.S. fertility rate was 1.9, slightly below replacement level. As shown in Fig. III.9, the fertility rate has been falling steadily for all regions of the U.S., although fertility rates tend to be highest in rural areas and lowest in large metro areas. It would thus seem that the United States would experience the same trends as those that are predicted for other developed countries, but more gradually than in South Korea, Japan or China. The number of senior citizens would increase as life expectancy increases, while the number of prime-age Americans in the age range 25 – 59 would slowly, but steadily, decrease. Eventually, the number of Americans of working age would be so small that it would be difficult to maintain support for senior citizens. This could put strains on our senior citizen support systems such as Social Security and Medicare.
Decreasing numbers of prime-age males could also make it difficult for the U.S. to maintain its military presence. Currently the U.S. maintains 800 military bases in 50 countries around the world. It would be difficult or impossible for the country to continue this level of military support if the numbers of young adult males plummeted.
Since the current U.S. fertility rate is below the number needed to stabilize the population, it might seem as though the United States is going to suffer the same fate as other developed countries with low birth rates. However, Bricker and Ibbitson claim that the U.S. is likely to maintain its dominance in global affairs through the end of the 21st century. The difference, they say, is that the U.S. has historically welcomed immigrants. In 2016 a Pew Research survey found that 59% of Americans felt that immigrants “strengthen our country because of their hard work and talent,” as compared with 34% who agreed with the statement that immigrants “are a burden on our country because they take our jobs, housing and health care.” If the U.S. continues to welcome immigrants, then the country can avoid losing population because of its low birth rates. In 2022, over 420,000 immigrants were issued immigrant visas or attained permanent resident status. Although that number is smaller than the number of immigrants that came to the U.S. before the Trump administration, it is still a sizable number compared with most developed countries.
And there are an additional 11 million undocumented immigrants in the U.S. Most of them have jobs, and in many of these occupations they are not competing directly with American workers. They pay taxes and perform valuable services to our country. From the point of view of population demographics, both legal and undocumented immigrants have higher birth rates than other American citizens (at least for a while; as immigrants reside in the U.S., their birth rates eventually decrease to those of the average American). Bricker and Ibbitson conclude that “Thanks for immigration and a higher fertility rate, the U.S. is far better placed than most developed nations to sustain its population through the course of this century.”
During the recession beginning in 2008, the fertility rate for white women in the U.S. dropped 11%, while the fertility rate for African-American women dropped 14% and that of Latinos dropped by 26%. The result is that the fertility rate for African-Americans and Latinos in the U.S. is becoming very similar to that for white American women. The convergence of fertility rates between white, African-American and Latino women is evident in Figure III.11. So, the U.S. will need to rely on a steady influx of young immigrants in order to avoid the decline in population, especially during productive adult years, that other nations are beginning to suffer.
There are two possible outcomes for American demography in the 21st century. The first scenario is that the U.S. will continue to welcome immigrants and their families to our country. The influx of young immigrants will compensate for the dearth of American children due to the low fertility rate in this country. Presumably the U.S. will need to develop a comprehensive policy on immigration that welcomes foreigners to our shores and provides them with a path to citizenship. In this way, the country will be able to avoid the decrease in population, and in particular the decrease in youth, that will beset other developed nations. The U.S. will then maintain a sufficient population in the 25 – 50 age group that is necessary to staff our farms, our manufacturing sector, and our health and services sectors.
However, there is another possible scenario. Beginning with the 2016 election of Donald Trump, the Republican party has shifted from an economically conservative and business-friendly party to more of a white Christian nationalist populist organization. A major aspect of Trumpism is the demonization of immigrants. They are portrayed as invaders whose values are inconsistent with those of white Christians. President Trump was particularly outspoken regarding illegal immigration from Central and South Americans whom he described as bringing criminals, drug dealers and rapists into our society. Trump also railed against Muslim immigrants, and he tried to enforce a ban on immigration from several Arab countries. He also spoke of contempt regarding U.S. immigrants from “shithole countries,” including South American and African countries; these are the most likely sources of 21st century immigrants, because these are countries whose population will still be growing rapidly.
Of course, we have seen nativist prejudice against foreign immigrants throughout our country’s history. Immediately following our Revolutionary War, laws were passed that were aimed at restricting immigration from France. In the 19th and early 20th century, Irish immigrants were accused of being shiftless and being Papists whose religious beliefs were incompatible with Protestant ethics. The Immigration Act of 1924 severely limited immigration from southern European and Slavic countries and banned immigration from Japan and China altogether. However, if Republicans (and most explicitly, Donald Trump) win the presidency in 2024, we will almost certainly see very strong restrictions on immigration, and mass deportations of undocumented populations currently residing in the U.S. All of these actions would exacerbate the situation with regard to future demography in this country. Bolstered by current levels of immigration, the U.S. population is projected to rise from 349 million people at present to 450 million in 2100. In this scenario, the United States will maintain its population, and even increase its population by 100 million people, by the end of the 21st century, in contrast to nearly every other developed country. If new immigrants are not only restricted, but undocumented aliens are deported, then we can expect similar population outcomes to those we are presently seeing in countries such as South Korea, China and Europe.
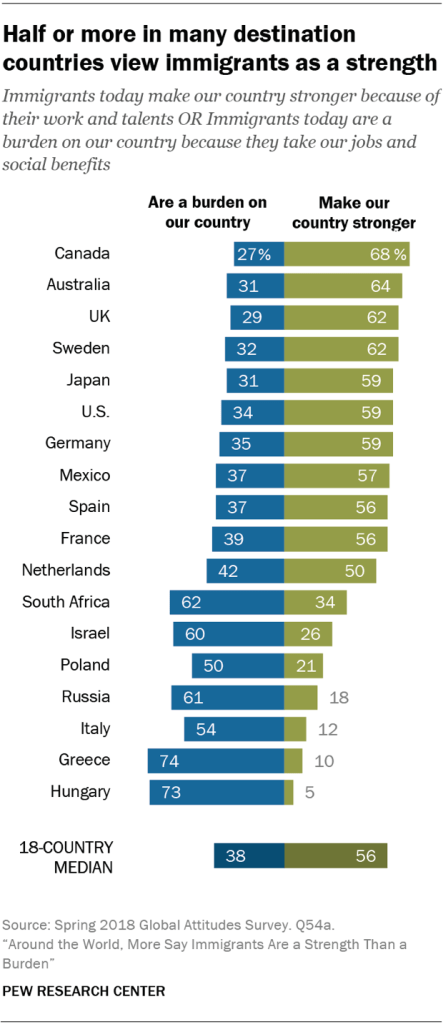
Around the world, attitudes towards immigrants vary dramatically depending on the extent of nativist sentiment in a country. Figure IV.9 shows the responses in a 2018 Global Attitudes Survey carried out by the Pew Research Center. People were asked which statement about immigrants they agreed with: either “Immigrants today make our country stronger because of their work and talents,” or “Immigrants today are a burden on our country because they take our jobs and social benefits.” The percentage of positive responses is shown in green, vs. negative responses in blue. There are dramatic differences in responses among countries. The most favorable attitude towards immigrants was in Canada, where 68% of respondents felt that immigrants “make our country stronger,” as opposed to 27% who felt they were “a burden on our country.” The U.S. came in sixth most positive in this survey, with 59% positive and 34% negative. However, in four of these countries (Russia, Italy, Greece and Hungary), less than 20% agreed with the positive statement regarding immigrants; in Hungary, the most negative of all countries, 73% agreed with the negative attitude towards immigrants while only 5% agreed with the positive statement. Most of the deeply anti-immigrant societies included in Fig. IV.9 also have quite low fertility rates. The governments of those countries will soon be desperately searching for ways to either increase fertility or change public attitudes about immigrants, lest they follow South Korea into deep economic and social turmoil.
What About Climate Change?
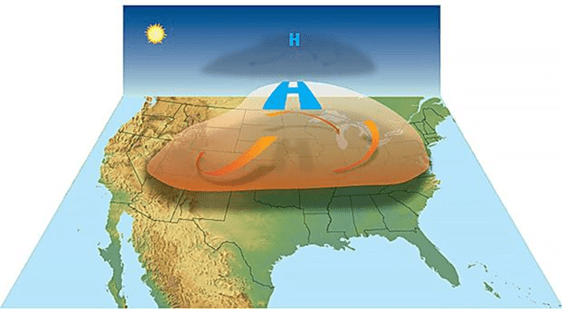
Until now, we have not discussed the role that global climate change will play in future population trends. If CO2 levels in the atmosphere continue to rise, a number of grim scenarios can be predicted. Glaciers are melting extremely rapidly, as is Arctic ice, and the Greenland and Antarctic ice shelves. As a result, many countries that depend on ice melt from glaciers to provide water to rivers that nourish their crops and produce a source of drinking water will be beset by drought. Melting Arctic and Antarctic ice, together with warming seas, could raise sea levels to a degree where many coastal cities are inundated, and low-lying islands may eventually be underwater. The ice melt may also dramatically weaken the dominant ocean currents, leading to severe droughts in other regions of the globe, such as the “Fertile Crescent.” Severe weather events such as wildfires and hurricanes could increase in intensity. Temperatures will rise dramatically; we are already experiencing “heat domes,” where a region of high atmospheric pressure traps and heats up air beneath it. Figure IV.10 shows a schematic illustration of the effects of a heat dome. Under such circumstances, ground temperatures can reach dangerously high levels. In 2021 a heat dome in British Columbia produced a temperature of 50o Celsius in Lytton, B.C.; this was the highest temperature ever recorded in Canada.
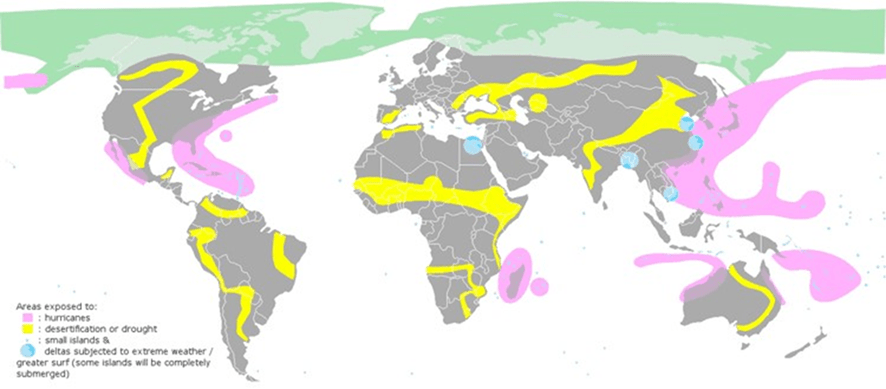
Global climate change is expected to create extreme conditions that are likely to cause people to emigrate from their homelands because of changing conditions that interfere with their ability to earn a living. Figure IV.11 shows areas of the globe that are likely to produce climate refugees. The pink areas are those that can expect to experience hurricanes or typhoons of much greater severity. Yellow areas are those where desertification and/or drought are likely to be more severe in the future. And blue represents small islands and deltas that will be subjected to more extreme weather; some islands are expected to be submerged because of increasing sea levels. The areas shown in Fig. IV.11 will likely produce forced migrations of populations. In some cases, climate refugees will migrate to other countries. Climate refugees will join with refugees fleeing wars or other volatile situations; in the future, many countries may experience significant numbers of refugees fleeing conditions that make their land uninhabitable.
Climate change may make it more difficult to provide food to the world’s population. Around the world, coral reefs are threatened by increasing temperatures and chemical runoff from agricultural production. Marine life is also in jeopardy from rapidly rising temperatures in the sea – recently, a buoy off the Miami coast registered a water temperature greater than 100o Fahrenheit. Many low-lying rice-growing areas are threatened by rising sea levels which could replace fresh water by salty seas. And many countries are in jeopardy as glaciers continue to rapidly melt, and where water levels in rivers and dams drop to dangerously low levels. All of these could lead to increased migration. At present many nations are reacting quite negatively to immigrants who wish to re-settle in countries that are relatively free of poverty and authoritarian rule. For example, countries such as Hungary, Italy and Poland have recently elected nationalist governments that are extremely hostile to immigrants from the Middle East and Africa. (The situation in Poland may be reversed by their October 2023 election.) It remains to be seen whether the situation might shift in the future – countries with aging and decreasing populations might welcome an influx of able-bodied refugees who could add to their workforce.
There are many potential effects from global climate change. These could make profound changes in agriculture and aquaculture and could potentially lead to forced migration of large segments of various countries. However, there are also positive effects due to population demographics. If the population of many countries decreases in coming decades, this could lead to less pressure on the environment. It might serve to make it easier to meet goals of limiting the use of fossil fuels and might decrease demands for agricultural production. Perhaps the most important aspect of global climate change, coupled with populations that are aging and decreasing in size, is that the outcomes are difficult to predict. However, we should be planning to account for these demographic changes as we attempt to develop strategies to cope with impending changes.
The bottom line is that the number of unprecedented changes facing 21st-century societies – low fertility, climate change, rapid advances of artificial intelligence and robots in the workplace, rampant misinformation spread electronically – will favor forward-looking governments able to generate creative policies to adapt. For some countries, it may already be too late to avoid debilitating consequences.
V. possible longer-term impacts
We can only speculate in general terms on the possible impacts of the Baby Bust beyond the end of the 21st century. By then, even conservative projections (see Section II) suggest that the global human population will be dwindling and fertility rates will be at or below replacement level in nearly all countries. Nonetheless, still high 21st-century fertility rates will have led to dense urban populations in many African countries, as well as some in the Middle East and South America. A number of Western countries may have survived 21st-century economic upheaval by tapping into these abundant sources of humans, as well as the supply of climate refugees, to fill voids in their labor forces, if those countries had succeeded in attracting and integrating large numbers of immigrants without causing debilitating social tensions. But the demographics of global human population will have shifted from the current distribution and countries that accepted large numbers of immigrants may also have seen significant waves of intermarriage.
21st-century shifts in the distribution of human phenotypes – caused by large differences in fertility rates among different parts of the globe – together with massive human migrations and intermarriage, will lead to alterations in the human gene pool in subsequent centuries, via the gene migration mechanisms summarized in Fig. V.1. For example, the ethnic and racial distributions of American and Canadian populations may have changed substantially from those at the start of the 21st century. Alleles that were once naturally selected for benefits – for example, in disease resistance – in the original environment may then increase in frequency among populations in new environments to which those alleles are less well adapted.

One can imagine that ongoing natural selection may lead to further evolutionary shifts in human gene pools. For example, women may evolve toward longer child-bearing years as larger segments of the population result from late births among women who delay the start of marriage and childbirth. The data in Fig. V.2 show that the percentage of all U.S. births occurring for women aged between 40 and 44 has increased by more than a factor of four from 1990 to 2016. This trend is expected to continue throughout the 21st century as women wait longer to start a family and medical treatments for pregnant women continue to improve. But the trend may also be influenced by genetic makeup among women most likely to experience late menopause. Increasing fractions of late births may pass along alleles that favor late menopause to matrilineal descendants and lead to even further increases in the late birth fraction in future generations. Perhaps such changes can produce an eventual uptick in human fertility.

Even allowing for immigration, many developed countries may have depleted labor forces by the end of the 21st century, strained to support still growing old-age dependency ratios. Furthermore, the nature of work available to young and middle-aged humans is likely to be altered radically by continuing developments in technology, artificial intelligence, and automation. Meanwhile, growing numbers of seniors will increase their collective political clout and influence over public policy. The geopolitical balance of power will have shifted by virtue of different 21st-century population trends in different countries. All of these trends are likely to require re-evaluation of economic and political systems in many countries.
The pressure on Earth resources from humans may finally relax as the global population decreases. This will provide minimal comfort if 21st-century humans have allowed their appetites to already exhaust some resources, to contribute to massive species extinctions, and to leave climate change unchecked. Even as their numbers dwindle, humans will continue to exert major influence on Earth’s environment in the ongoing Anthropocene Epoch. The long-term future of human societies will depend on how rapidly humans adapt during the 21st century to the dramatic changes their own technologies – including birth control, advanced medicine and pharmacology, fossil-fuel burning, the internet, and AI – have wrought.
VI. summary
Human fertility rates began to decrease when populations in industrialized societies became more concentrated in urban areas. But the decrease has accelerated since the mid-20th century by virtue of the combination of improved female education and ready access to birth control. Women’s increasing control over their own bodies and their choices regarding marriage, advanced education, work, and child rearing, abetted by the rising cost of raising children in urban areas and by the dwindling pressures for large families from organized religions and their parents and grandparents, have led to an ongoing Baby Bust in the developed world. Current trends suggest that the Baby Bust will not only accelerate in the developed world, but will spread during the 21st century to countries that may presently be considered as parts of the third world. It thus appears likely that the global population will peak during the lifetimes of today’s children.
At the same time, advances in medicine, pharmacology, hygiene and environmental conditions are extending human life expectancy. As a result, human populations will not only start to decrease, as they already have in several countries, but also to age during this century. Many countries will face difficult economic and social conditions as a depleted working sector is called upon to support a growing senior sector. South Korea (we know little about demographics in North Korea), Japan and China are likely to form the leading edge of these demographic changes. But a number of European countries – prominently, Spain, Italy, Germany, and Albania – are not far behind. Meanwhile, fertility rates are still high in much of Africa and several countries in the Middle East and South America. Although we anticipate that those fertility rates will also decline throughout this century, their populations will grow rapidly before their fertility rates reach the replacement level of 2.1 childbirths per woman who lives past child-bearing age.
Some governments have tried to formulate family-friendly policies that would encourage increased fertility, but with limited success. The most likely path to maintain adequate work forces and taxation bases to support increasing numbers of seniors during the 21st century, as well as adequate military forces, will involve acceptance of immigrants from high-fertility countries, or from countries hit hardest by climate change, to low-fertility countries. But in many countries such acceptance of immigrants faces strong nativist and political headwinds. Changing demographics may well lead to important shifts in the balance of economic and geopolitical power among countries during the 21st century and beyond.
Even when global human populations begin to decrease, humans will continue to exert major influence on Earth’s environment and on the survival of other species. If humans do not soon begin to seriously address their negative impacts on the environment, most especially on Earth’s climate, they will face increasing environmental challenges in the future that further complicate adaptation to the demographic challenges we have described in this post. The need for forward-looking governments capable of crafting and implementing creative policies to deal with all these upcoming changes has never been greater.
references:
D. Bricker and J. Ibbitson, Empty Planet: The Shock of Global Population Decline (Crown Publishing, 2020), https://www.amazon.com/Empty-Planet-Global-Population-Decline/dp/1984823221/
Wikipedia, An Essay on the Principle of Population, https://en.wikipedia.org/wiki/An_Essay_on_the_Principle_of_Population
Wikipedia, Thomas Robert Malthus, https://en.wikipedia.org/wiki/Thomas_Robert_Malthus
P.R. Ehrlich, The Population Bomb (Ballantine Books, 1971), https://www.amazon.com/population-bomb-Paul-R-Ehrlich/dp/0345021711/
Wikipedia, The Limits to Growth, https://en.wikipedia.org/wiki/The_Limits_to_Growth
Wikipedia, Club of Rome, https://en.wikipedia.org/wiki/Club_of_Rome
Wikipedia, One-Child Policy, https://en.wikipedia.org/wiki/One-child_policy
G. Turner, Is Global Collapse Imminent?, Melbourne Sustainable Society Institute, 2014, https://sustainable.unimelb.edu.au/__data/assets/pdf_file/0005/2763500/MSSI-ResearchPaper-4_Turner_2014.pdf
Sense and Sustainability: Is a Species Set on Endless Growth Sustainable?, 2015 Documentary Film, https://www.imdb.com/title/tt5932924/
R. Patel, Stuffed and Starved: The Hidden Battle for the World Food System (Melville House, 2012), https://www.amazon.com/Stuffed-Starved-Hidden-Revised-Updated/dp/1612191274/
D. Rieff, The Reproach of Hunger: Food, Justice and Money in the Twenty-First Century (Simon & Schuster, 2015), https://www.amazon.com/Reproach-Hunger-Justice-Twenty-First-Century-ebook/dp/B00URY5CWK/
J.K. Bourne, Jr., The End of Plenty: The Race to Feed a Crowded World (W.W. Norton & Company, 2015), https://www.amazon.com/End-Plenty-Race-Crowded-World-ebook/dp/B00OD8Z5KU/
C. Goldin, The Quiet Revolution That Transformed Women’s Employment, Education, and Family, Richard T. Ely Lecture, 2006, https://pubs.aeaweb.org/doi/pdfplus/10.1257/000282806777212350
Nobel Prize in Economic Sciences 2023 awarded to Claudia Goldin, https://www.nobelprize.org/prizes/economic-sciences/2023/press-release/
H. Ritchie, et al., Population Growth, Our World in Data, https://ourworldindata.org/population-growth
United Nations Population Division, https://www.un.org/development/desa/pd/
D. Spears, The World’s Population May Peak in Your Lifetime. What Happens Next?, New York Times, Sept. 18, 2023, https://www.nytimes.com/interactive/2023/09/18/opinion/human-population-global-growth.html
Wittgenstein Centre for Demography and Global Human Capital, https://www.wittgensteincentre.org/en/index.htm
Institute for Health Metrics and Evaluation, University of Washington, https://www.healthdata.org/
A. Stevenson and Z. Wang, China’s Population Falls, Heralding a Demographic Crisis, New York Times, Jan. 16, 2023, https://www.nytimes.com/2023/01/16/business/china-birth-rate.html
D. Grover, What Is the Demographic Transition Model?, Population Education, Oct. 13, 2014, https://populationeducation.org/what-demographic-transition-model/
Encyclopedia.com, Warren S. Thompson, https://www.encyclopedia.com/social-sciences/encyclopedias-almanacs-transcripts-and-maps/thompson-warren-s
Wikipedia, Great Chinese Famine, https://en.wikipedia.org/wiki/Great_Chinese_Famine
Wikipedia, Great Leap Forward, https://en.wikipedia.org/wiki/Great_Leap_Forward
H. Ritchie and M. Roser, Urbanization, Our World in Data, https://ourworldindata.org/urbanization
Wikipedia, Margaret Sanger, https://en.wikipedia.org/wiki/Margaret_Sanger
Wikipedia, Comstock Laws, https://en.wikipedia.org/wiki/Comstock_laws
Wikipedia, Roe v. Wade, https://en.wikipedia.org/wiki/Roe_v._Wade
Dobbs v. Jackson Women’s Health Organization, U.S. Supreme Court case, 2022, https://constitutioncenter.org/the-constitution/supreme-court-case-library/dobbs-v-jackson-womens-health-organization
M. Roser, Fertility Rate, Our World in Data, https://ourworldindata.org/fertility-rate
Wikipedia, Projections of Population Growth, https://en.wikipedia.org/wiki/Projections_of_population_growth
J. Gallagher, Fertility Rate: ‘Jaw-Dropping’ Global Crash in Children Being Born, BBC News, July 15, 2020, https://www.bbc.com/news/health-53409521
World Population Prospects 2022, U.N. Population Division, https://population.un.org/wpp/Graphs/Probabilistic/POP/TOT/900
L. Silver and C. Huang, Key Facts About China’s Declining Population, Pew Research Center, Dec. 5, 2022, https://www.pewresearch.org/short-reads/2022/12/05/key-facts-about-chinas-declining-population/
Ipsos, We Need to Talk About Generations, April 26, 2023, https://www.ipsos.com/en/we-need-talk-about-generations-topic-conversation
M. Kearney, P. Levine, and L. Pardue, The Mystery of the Declining U.S. Birth Rate, Econofact, Feb. 15, 2022, https://econofact.org/the-mystery-of-the-declining-u-s-birth-rate
A. Morse, Stable Fertility Rates 1990-2019 Mask Distinct Variations by Age, U.S. Census Bureau, Apr. 6, 2022, https://www.census.gov/library/stories/2022/04/fertility-rates-declined-for-younger-women-increased-for-older-women.html
J.A. Martin, B.E. Hamilton, and M.J.K. Osterman, Births in the United States, 2014, Centers for Disease Control and Prevention, https://www.cdc.gov/nchs/products/databriefs/db216.htm
U.N. Population Division, World Population Prospects: The 2000 Revision – Highlights, https://enerpedia.net/images/2/2c/Wpp2000h.pdf and The 2015 Revision, https://population.un.org/wpp/publications/files/key_findings_wpp_2015.pdf
U.N. Department of Economic and Social Affairs, World Population Monitoring, 2000: Population, Gender and Development, https://unesdoc.unesco.org/ark:/48223/pf0000124480
J. Bongaarts and D. Hodgson, The Impact of Voluntary Family Planning Programs on Contraceptive Use, Fertility, and Population, chapter in Fertility Transition in the Developing World (Springer, 2022), https://www.researchgate.net/publication/363184369_The_Impact_of_Voluntary_Family_Planning_Programs_on_Contraceptive_Use_Fertility_and_Population
J. Kim, Female Education and Its Impact on Fertility, IZA World of Labor, https://wol.iza.org/articles/female-education-and-its-impact-on-fertility/long
L. Stone, Do Schooling and City Living Equal Fewer Babies?, Institute for Family Studies, Sept. 24, 2018, https://ifstudies.org/blog/do-schooling-and-city-living-equal-fewer-babies
E. Pradhan, Female Education and Childbearing: A Closer Look at the Data, World Bank Blogs, Nov. 24, 2015, https://blogs.worldbank.org/health/female-education-and-childbearing-closer-look-data
R. Butt, 2 Years Ago the Taliban Banned Girls from School. It’s a Worsening Crisis for All Afghans, Associated Press, Sept. 18, 2023, https://apnews.com/article/afghanistan-taliban-high-school-ban-girls-7046b3dbb76ca76d40343db6ba547556
G. Livingston and D. Thomas, Why is the Teen Birth Rate Falling?, Pew Research Center, Aug. 2, 2019, https://www.pewresearch.org/short-reads/2019/08/02/why-is-the-teen-birth-rate-falling/
G. Galvin, As Fertility Rates Fall in U.S., Gap Widens Between Urban and Rural Counties, U.S. News and World Report, Oct. 17, 2018, https://www.usnews.com/news/healthiest-communities/articles/2018-10-17/as-fertility-rates-fall-across-us-gap-widens-between-rural-and-urban-counties
D.M. Ely and B.E. Hamilton, Trends in Fertility and Mother’s Age at First Birth Among Rural and Metropolitan Counties: United States, 2007-2017, Centers for Disease Control and Prevention, https://www.cdc.gov/nchs/products/databriefs/db323.htm
J. Campbell, Africa is the Fastest Urbanizing Place on the Planet, Council on Foreign Relations, Sept. 12, 2018, https://www.cfr.org/blog/africa-fastest-urbanizing-place-planet
J.-M. Bos, Africa Drives Global Urbanization, May 17, 2023, https://www.dw.com/en/africa-drives-global-urbanization/a-65653428
Human Fertility Database, https://www.humanfertility.org/
C. Ingraham, A Breakdown of American Religion by Fertility Rates, Washington Post, May 13, 2015, https://www.register-herald.com/cnhi_network/a-breakdown-of-american-religion-by-fertility-rates/article_08d9d640-70f0-5c79-94bc-274fa90fa291.html
L. Stone, America’s Growing Religious-Secular Fertility Divide, Institute for Family Studies, Aug. 8, 2022, https://ifstudies.org/blog/americas-growing-religious-secular-fertility-divide
L. Stone, A ‘New’ Normal? An Updated Look at Fertility Trends Across the Globe, Institute for Family Studies, Oct. 15, 2019, https://ifstudies.org/blog/a-new-normal-an-updated-look-at-fertility-trends-across-the-globe
In Rich Countries, Working Women and Babies Go Hand in Hand, The Economist, Aug. 23, 2022, https://www.economist.com/graphic-detail/2022/08/23/in-rich-countries-working-women-and-more-babies-go-hand-in-hand
C.C. Miller, Americans are Having Fewer Babies. They Told Us Why, New York Times, July 5, 2018, https://www.nytimes.com/2018/07/05/upshot/americans-are-having-fewer-babies-they-told-us-why.html
Wikipedia, Crisis in the Population Question, https://en.wikipedia.org/wiki/Crisis_in_the_Population_Question
E. Bauer, Is Sweden Our Fertility-Boosting Role Model?, Forbes, Aug. 9, 2019, https://www.forbes.com/sites/ebauer/2019/08/09/is-sweden-our-fertility-boosting-role-model/?sh=7c511e9513cb
D. Yoon and T.W. Martin, World’s Lowest Birth Rate Sinks Further Despite Cash Payouts to Parents, Wall Street Journal, Aug. 31, 2023, https://www.wsj.com/world/asia/worlds-lowest-birthrate-sinks-further-despite-cash-payouts-to-parents-23a92210
OECD (2017), Pensions at a Glance 2017: OECD and G20 Indicators, OECD Publishing, https://www.oecd-ilibrary.org/social-issues-migration-health/pensions-at-a-glance-2017_pension_glance-2017-en
Wikipedia, Dependency Ratio, https://en.wikipedia.org/wiki/Dependency_ratio
Korea’s Old-Age Dependency Ratio to Spike, Korea Herald, May 25, 2017, https://www.koreaherald.com/view.php?ud=20170525000557
R. Lee and A. Mason, Cost of Aging, International Monetary Fund Finance & Development, March 2017, https://www.imf.org/external/pubs/ft/fandd/2017/03/lee.htm
Gefira.org, The Collapse of the South Korean Population: The Countdown Has Begun, https://gefira.org/en/2018/01/11/childless-south-korea/
Asia Pacific Foundation of Canada, Robots Bring Profit – and Unease – to South Korea’s Shaky Labour Market, Jan. 21, 2023, https://www.asiapacific.ca/publication/robots-bring-profit-and-unease-south-koreas-shaky-labour
M. Parks, Despite Fierce Protests, France Has Raised the Retirement Age From 62 To 64, NPR, April 15, 2023, https://www.npr.org/2023/04/15/1170246219/despite-fierce-protests-france-has-raised-the-retirement-age-from-62-to-64
C. Geppert and H. Boulhol, Pension Policies Alone Will Not Prevent the Decline in the Relative Size of the Labour Force, VoxEU, June 4, 2018, https://cepr.org/voxeu/columns/population-ageing-pension-policies-alone-will-not-prevent-decline-relative-size
Wikipedia, Minorities in Korea, https://en.wikipedia.org/wiki/Minorities_in_Korea
The Global Graph, Kenya Population, https://worldpopulation.theglobalgraph.com/p/kenya-population.html
Macrotrends.net, Kenya 2023, https://www.macrotrends.net/countries/KEN/kenya/
UN Office of Human Rights, Afghanistan: UN Experts Say 20 Years of Progress for Women and Girls’ Rights Erased Since Taliban Takeover, March 2023, https://www.ohchr.org/en/press-releases/2023/03/afghanistan-un-experts-say-20-years-progress-women-and-girls-rights-erased
Sustainability Today, Ontario Tech University, World’s Largest Cities, https://sites.ontariotechu.ca/sustainabilitytoday/urban-and-energy-systems/Worlds-largest-cities/population-projections/city-population-2100.php
D. Hoornweg and K. Pope, Socioeconomic Pathways and Regional Distribution of the World’s 101 Largest Cities, Global Cities Institute Working Paper No. 4, Jan. 2014, https://shared.ontariotechu.ca/shared/faculty-sites/sustainability-today/publications/population-predictions-of-the-101-largest-cities-in-the-21st-century.pdf
T. Hernandez, A Brief History of Anti-Immigrant Propaganda, Immigrant Archive Project, https://immigrantarchiveproject.org/brief-history-anti-immigrant-propaganda/
A. Gonzalez-Barrera and P. Connor, Around the World, More Say Immigrants are a Strength than a Burden, Pew Research Center, March 14, 2019, https://www.pewresearch.org/global/2019/03/14/around-the-world-more-say-immigrants-are-a-strength-than-a-burden/
Wikipedia, Heat Dome, https://en.wikipedia.org/wiki/Heat_dome
E. Borneman, Climate Refugees, Geography Realm, May 27, 2016, https://www.geographyrealm.com/climate-refugees/
P.N. Cohen, Births to 40-Year Olds are Less Common, But a Greater Share Than in 1960, Family Inequality, May 14, 2017, https://familyinequality.wordpress.com/2017/05/14/births-to-40-year-olds-are-less-common-but-a-greater-share-than-in-1960/
National Geographic, Anthropocene, https://education.nationalgeographic.org/resource/anthropocene/
