
October 26, 2023
I. introduction
Humanity has been warned for several centuries now by a variety of social commentators that the evolutionary pressure to reproduce will lead to a population explosion, in which human consumption will deplete Earth resources and lead to inevitable conflicts over the remains. The first warning came at the turn of the 19th century in a pamphlet entitled An Essay on the Principle of Population as it Affects the Future Improvement of Society, by Thomas Malthus, a British pastor and later professor of political economy. The pamphlet was first published in 1798 but expanded into book form in several following editions. Malthus argued that, since no progress had been made “towards the extinction of the passion between the sexes,” population would grow at a geometric rate (i.e., it would double and redouble in fixed time intervals), outstripping possible improvements in food production. The poor would suffer the most from shortages of food, and population growth would impede sustainable increases in prosperity.
Malthus’ prediction was quite influential in 19th century intellectual life because it heavily influenced Charles Darwin’s conception of natural selection as a driving force in evolution of the species. But further warnings of human overbreeding did not really follow until the middle of the 20th century, when it seemed we were actually in the midst of the exponential global population growth Malthus had foreseen. The most influential of the new dire warnings was The Population Bomb, a 1968 bestseller by Stanford University biologist Paul Ehrlich (see Fig. I.1).
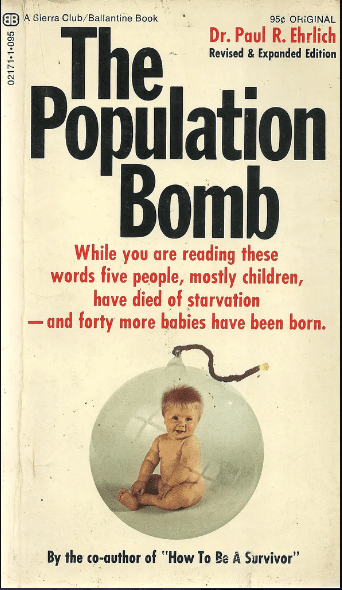
Ehrlich launched immediately into doomsday scenarios by opening his book with the assertion: “The battle to feed humanity is over. In the 1970s and 1980s hundreds of millions of people will starve to death in spite of any crash programs embarked on now.” Ehrlich’s pessimism was driven by sustained high birth rates in underdeveloped countries, despite great reductions in death rates arising from recent improvements in medicine and in agricultural productivity. He predicted that continued overpopulation would contaminate Earth’s environment to the point of collapse. He saw only two possible long-term solutions for a population “bomb,” neither of which could avoid the short-term crises he foresaw: “One is the ‘birth rate’ solution, in which we find ways to lower the birth rate. The other is the ‘death rate’ solution, in which ways to raise the death rate – war, famine, pestilence – find us.”
Ehrlich’s book was followed in 1972 by The Limits to Growth, reporting computer analyses of global trends by the non-profit think tank Club of Rome. The authors concluded that: “If the present growth trends in world population, industrialization, pollution, food production, and resource depletion continue unchanged, the limits to growth on this planet will be reached within the next one hundred years. The most probable result will be a rather sudden and uncontrollable decline in both population and industrial capacity.” They argued that a 21st century collapse of human civilization could be prevented only by “immediate and drastic curbs to population and capital growth.” Perhaps this analysis influenced China’s imposition of a One-Child Policy in 1980. It has certainly influenced continuing warnings of humans’ exhaustion of Earth’s resources within the foreseeable future.
The dire warnings have continued into the 21st century. In 2014, researchers at the University of Melbourne argued that the global financial recession of 2008-9 was a harbinger of the coming apocalypse: “Limits to Growth was right: New research shows we’re nearing collapse.” In a 2015 documentary, Paul Ehrlich doubled down on his pessimism, claiming that population growth remains out of control and the day of reckoning for civilization is near. Recent additions to the population doomsday literature include: Stuffed and Starved: The Hidden Battle for the World Food System by Raj Patel; The Reproach of Hunger: Food, Justice and Money in the Twenty-First Century by David Rieff; and The End of Plenty by Joel Bourne.
The authors of most of these doomsday scenarios have failed to foresee (or have been slow to acknowledge in the rearview mirror) several central human developments of the 20th and 21st centuries. First, a significant number of previously underdeveloped countries – most importantly China and India, which together hold more than one third of humans on Earth — have undergone or are undergoing rapid economic development. Second, the increased urbanization of industrialized countries significantly reduces the pressure on families to have many children. Third, worldwide agricultural productivity has increased dramatically, growing even faster than global population between 1950 and 2010, driven by improvements in fertilizers, herbicides, pesticides, genetically modified crops, and land use. And fourth, and most importantly, wide access to reliable birth control has had a radical impact on birth rates in a majority of the world’s countries. In addition to these developments, organized religion, which often promotes high fertility, has waned in influence in much of the developed world. Birth rates declined without government interventions, which proved to be blunt and unnecessary tools that caused, in China’s case, unanticipated collateral damage.
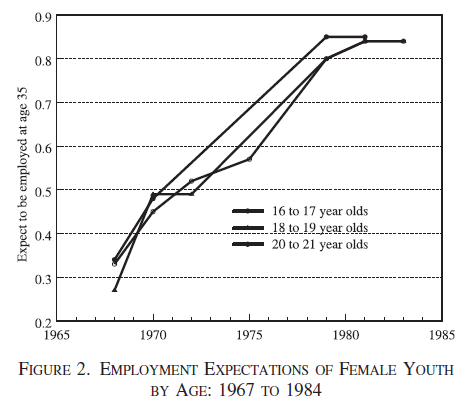
With the advent of the birth control pill around 1960, along with advancements in the education of girls, women became capable of satisfying evolutionary pressures for sexual desire without risking pregnancy. Women gained control of their reproductive choices, became better educated, entered the workforce in greater numbers, and often made personal choices to have fewer babies. These transformations constituted a “quiet revolution” in the words of Claudia Goldin, the Harvard economist who was just awarded the 2023 Nobel Prize in Economics for her seminal work providing the data and the analyses of women’s impact on labor markets. Two aspects of that mid-20th century revolution in female experience and expectations in the workforce are shown in Fig. I.2, taken from Goldin’s work. Labor force participation rates for married white American females of age 35-44 rose from about 15% in 1940 to about 75% by 1990. And the attitudes of young women changed even more rapidly: in 1968 about 30% of white American females aged 16-21 expected to be employed at age 35, but that percentage rose to 85% by 1980.

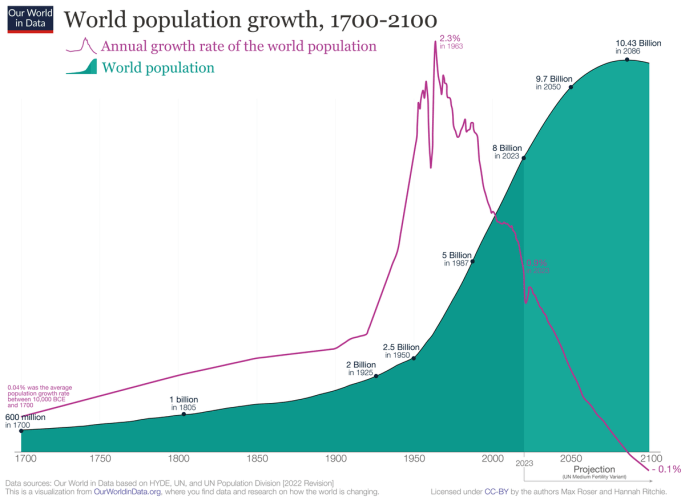
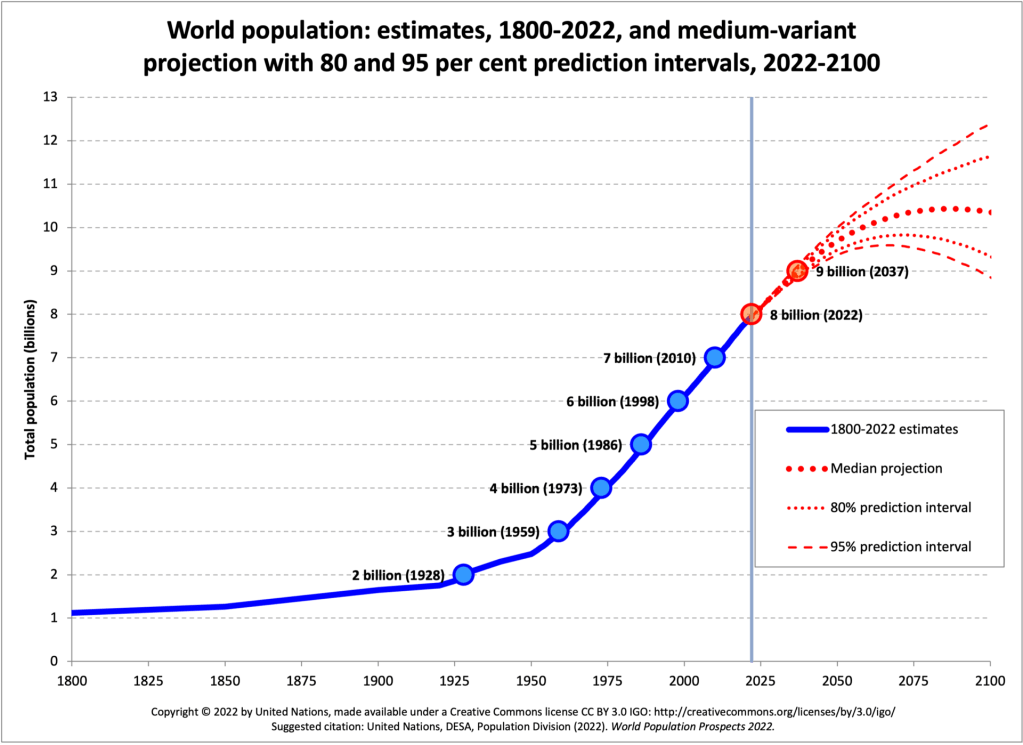
But we are focused here on the impacts of the above developments on human fertility. The impact on the rate of growth of human populations is clearly evident in the purple curve in the population graph of Fig. I.3. Global population exploded during the 20th century despite that century featuring: two World Wars that caused some 70 million worldwide military and civilian deaths; the 1918 influenza epidemic that resulted in some 40-50 million worldwide deaths; Stalinist purges that caused tens of millions of deaths in the Soviet Union; and the Great Chinese Famine of the late 1950s, resulting from Mao Zedong’s Great Leap Forward, that resulted in more than 45 million human deaths. The global population is still growing in 2023, but at less than half the rate it was in the 1960s. Population continued to grow rapidly through the beginning of this century because even though the post-World War II Baby Boomers had fewer children on average than their parents, there were a lot more of them around. Furthermore, birth rates remain high in countries where economic development is just getting started. However, an extrapolation of current trends is justified by exploring its causes (as we do in Section III of this post), and it leads to a projection of likely global population decline before the end of the 21st century. While the 20th century will always be viewed as one of population explosion, the 21st century will probably be recorded as the period when human population peaked.
The timing of the projected global population peak depends on how various groups predict human fertility rates to evolve into the future. The United Nations Population Division, whose median projection is the one shown in Fig. I.3, makes generally conservative projections and predicts a population peak in the 2080s. However, as pointed out by Dean Spears in an opinion piece in the Sept. 18, 2023 New York Times, the Wittgenstein Center for Demography and Global Human Capital in Vienna projects a peak in the 2070s. The Institute for Health Metrics and Evaluation at the University of Washington puts the peak in the 2060s. In all likelihood, global population will begin to decline during the life span of today’s children. And it has already begun to decline in some countries. China saw the number of deaths exceeding the number of births in 2022, for the first time in six decades. Japan’s population peaked in 2010 and is currently declining slowly.
The dwindling birth rates in the developed world – the accelerating “Baby Bust” – offer some hope for eventually (perhaps too late) limiting human-caused problems such as climate change, but it also brings with it a new set of serious problems, especially when coupled with rapid advances in life expectancy brought about by medical and environmental progress. A number of countries are already facing a population inversion, with decreasing numbers of people of working age to support growing numbers of seniors, and more countries will be following this trend soon enough. In this post we will explore the data, the causes, and the impacts of the accelerating Baby Bust. A number of the points we make are based on reports in a recent book: Empty Planet: The Shock of Global Population Decline by Darrell Bricker and John Ibbitson.
II. the data
The Demographic Transition Model:
Features of the global population and population growth curves in Fig. I.3 are most easily discussed within the framework of a Demographic Transition Model, introduced in 1929 by the American demographer Warren Thompson and illustrated in Fig. II.1. The model describes the stages of population growth that most human societies progress through. In the original model there were four stages, as follows:
Stage 1: Both birth rates and death rates are high, and population growth is slow and fluctuating. Humanity was stuck in this stage from its dawn until the 18th century.
Stage 2: Birth rates remain high but death rates gradually decline, leading to rapidly growing population. Most of Europe entered this stage in the 18th century as the Industrial Revolution, improvements in medicine, sanitation, and the cleanliness of the water supply reduced mortality.
Stage 3: Birth rates begin to decline, while death rates continue declining. The population growth rate slows. Most of the developed world entered this stage during the 20th century, as increasing urbanization resulting from the Industrial Revolution continued, women gained more rights and control of their own bodies with the widespread availability of the birth control pill, and later of safe medical abortion, and the growing education of women, as well as their entry into the workplace, all contributed to falling birth rates. Life expectancy grew rapidly as medicine, diet, hygiene, and sanitation all continued to improve.
Stage 4: Birth rates are near the value needed to just sustain a stable population, while life expectancy continues to increase slowly. Population is either stable or slowly growing. Much of the world is today in Stage 4 or beyond. The fertility rate needed to maintain a stable population is 2.1 live childbirths/woman when one accounts for childhood mortality and premature deaths among women of child-bearing age.
Thompson did not envision a Stage 5, but that is where a sizable portion of the developed world currently finds itself: birth rates fall below the level needed to sustain population levels. Thus, even while life expectancy remains steady or improves very slowly, population declines. Some developed countries (e.g., Japan, South Korea, Singapore, Spain, Italy, Russia, etc.) are presently squarely within Stage 5, while others in the developed world teeter between Stage 4 and Stage 5.
The 20th Century Population Explosion:
Prior to the 18th century most human societies were in Stage 1 of the demographic transition; population growth was slow. The rapid rise in population growth in the early part of the 20th century, seen in Fig. I.3, resulted in large part from a rapid reduction in mortality, caused by improvements in medicine and hygiene. Some specific contributions to this increase in life expectancy were: the onset of modern sewage systems greatly reduced cholera outbreaks in the developed world; chlorination of water supplies greatly reduced the incidence of other infectious diseases, such as typhoid fever; advances in vaccinations, treatments, and surgery dramatically reduced other causes of early death; other medical improvements greatly reduced infant mortality and female deaths in child delivery. And these improvements outweighed the impacts of the World Wars, the Spanish flu epidemic, the Stalinist purges, and the Great Chinese Famine (which caused the significant dip in population growth rate seen in Fig. I.3 immediately before the 1963 peak).
While many countries were within Stage 2 during the early 20th century, parts of the developed world were already entering Stage 3 of the demographic transition. Birth rates were beginning to decline in addition to death rates in North America and Europe. Those declines, however, were interrupted by the post-World War II Baby Boom, which led to the peak population growth in the 1950s and 1960s seen in Fig. I.3.
What were the causes of the Stage 3 decline in fertility rates? In the late 19th and early 20th centuries, the primary cause was increasing education and rights for women, who increasingly exercised the right to choose when to have children. The increasing concentration of population density in urban areas also played an important part. As shown in Fig. II.2, the Industrial Revolution led to rapidly increasing percentages of populations living in urban, rather than rural, areas in the United States and Western Europe already in the 19th century. Japan followed suit during the 20th century and China and India are now catching up. Worldwide, urban population has surpassed rural population beginning in 2007. Once cities are built up they become centers of employment opportunity and thereby attract further generations of young people. On farms, children provide needed extra helpers. But in urban centers, they are not necessary for work and raising them was becoming more and more expensive to families. The costs became a dominant concern during the Great Depression of the 1930s, when many people were unemployed.

Economic prosperity in the West after World War II along, of course, with the return home of millions of young men, spurred the Baby Boom. Couples began to marry younger and have larger families. But once the boom had played its course, fertility rates in much of the developed world began to drop rapidly. The most important development leading to that drop was that of the birth control pill. After Margaret Sanger’s campaign to get such a pill developed – a campaign that would see her jailed for violation of the U.S. Comstock Act – it was approved for use in the U.S. in 1957, but only for women suffering severe menstrual disorders, which produced a sudden upsurge in complaints of severe menstrual disorders. But then the Food and Drug Administration approved the pill for contraceptive use in 1960. As the pill became widely available, the Baby Boom came to an end and the developed world entered Stage 4 of the demographic transition.
Natural selection favors species that reproduce with high fertility. In humans the way that evolutionary pressure is manifested is in a strong desire for sex. The pill gave women of child-bearing age the means to enjoy sex while avoiding the financial and caregiving burdens of child rearing. The trend was reinforced in the U.S. by the 1973 Roe v. Wade Supreme Court decision, which concluded that women had a constitutional right (since rescinded in 2022 by the Court’s Dobbs v. Jackson decision) to abortion during the first two trimesters of pregnancy. By the end of the 1970s, “access to the pill and to a safe, legal abortion was common throughout the developed world. And fertility rates continued to plunge.” They have also been driven lower by women entering the workforce en masse (see Fig. I.2) and by the dwindling influence, in at least some western countries, of religious pressures to produce large families.
Worldwide Fertility Rates:
Figure II.3 shows how fertility rates have evolved in many countries since 1950. There are numerous take-aways from this chart. The primary message is that fertility rates have been dropping rapidly since the 1950s in most of the world’s populous countries, regardless of culture or form of government. Averaged over the period from 1950-55 about two-thirds of the world’s population had fertility rates around 5 or above. The U.S. fertility rate at that point was about 3.3. But just about one-third of the entire global population resided in China and India, which both had fertility rates near 6. China and India, along with many other countries, were then still in Stage 2 of the demographic transition, with declining death rates but still high birth rates. They dominated the seemingly exponential rise in global population in the mid-20th century.

By 1975-80 the Chinese economy and standard of living had begun to improve rapidly, while a growing fraction of the population became urban (see Fig. II.2). These trends, along with the availability of birth control, led the Chinese fertility rate to drop precipitously from 6 to 3, with a very large effect on global population growth. China had entered Stage 3 of the demographic transition and this was prior to the imposition of China’s One Child Policy (about which more later in this section). India, however, was still in Stage 2, though its fertility rate had dropped from just under 6 to just under 5. Including India, then, it was about 40% of the world’s population with fertility rates near 5 and above in 1975-80. Meanwhile, several countries, including the U.S., Japan, and Germany had dipped below the replacement fertility level of 2.1, entering Stage 5.
A further precipitous drop in global fertility levels occurred by 2005-10, when India had undergone sufficient economic development to enter Stage 3, dropping its fertility rate to 2.6. By that point, only about 10% of the world’s population still had fertility rates of 5 or above. China underwent a further precipitous drop by 2005-10, passing rapidly through Stage 4 and joining many developed countries in Stage 5, with fertility rates below 2.0. We will examine the specific situations for the U.S. and China in more detail below. Because India has lagged behind the economic development of China, it is now on the verge of becoming the world’s most populous country. In 2023, the global population growth rate is less than half what it was during the peak years of the 1960s. And fertility rates in countries still in Stage 2 are projected to continue their decline throughout the rest of the present century.
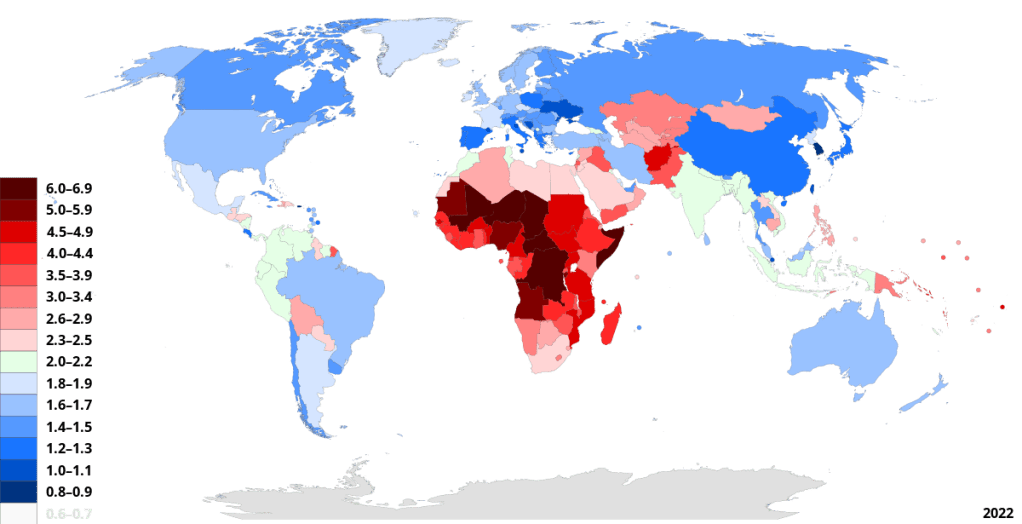
Current worldwide fertility rates are indicated via color-coding in the map of Fig. II.4. High fertility rates remain in much of Africa and several countries in the Middle East. But most of the developed world is now in Stage 5, with fertility rates below replacement level. Especially low fertility rates are found in China, Japan, South Korea, Singapore, Spain, Italy, Germany, Albania, and Ukraine (clearly influenced in the latter case by the ongoing war with Russia).
The fertility rate trends in various countries allow projections of how their populations may vary throughout the remainder of this century. As shown in Fig. II.5, China and Japan are expected to lose considerable population by 2100. In fact, 2022 was the first year in many decades when Chinese deaths outnumbered Chinese births, signaling the beginning of population decline. India’s population will also decline, but not as dramatically as in China and Japan. Note that by 2100 the population of Nigeria may well exceed that of China. The U.S. population is expected to continue to grow very slowly, despite a fertility rate below 2.1, largely by virtue of anticipated immigration into the country, but that depends on political will to support immigration going forward.

When one includes every country, one can project global population out to 2100. The U.N. Population Division makes such projections regularly, and those from 2022 are shown in Fig. II.6. The projections depend on models of how fertility will decline within countries just beginning the transition to demographic Stage 3. Under their medium assumptions of fertility trend continuation, the U.N. now projects (median projection in Fig. II.6) that global population will peak at about 10.4 billion (up from the current value of 8.0 billion) before the end of this century, and then will start decreasing. But other groups consider the U.N. projections too conservative and think the curves in Fig. II.6 representing the lower bounds on the U.N. projection range to be more realistic.
Fertility Evolution in China:
We can learn more about the nature of the Baby Bust by examining the fertility trends in more detail in China and the U.S. We begin with China, where the fertility rate trend since 1950 is illustrated in Fig. II.7. China’s trend demonstrates the sometimes large effects of government policies gone awry and the very limited impact of government policies in reversing a trend toward declining birth rates. The precipitous dip in fertility rates from about 6 to a low of 4 in the early 1960s reflects the impact of the Great Chinese Famine that resulted from Mao Zedong’s imposed Great Leap Forward, a misguided attempt to transform China too rapidly from an agrarian economy to an industrialized society. The famine, starting in about 1958 and extending into 1962, led to tens of millions of deaths from starvation and great hesitancy to bring new children into the starving nation. Once the famine ended, pent-up demand for sex and social pressures for large families led to a temporary spike in fertility to about 7.5 by the mid-60’s. China accounted for such a large fraction of the world population that the dip and spike in Fig. II.7 are clearly reflected even in the global population increase rate seen in Fig. I.3.
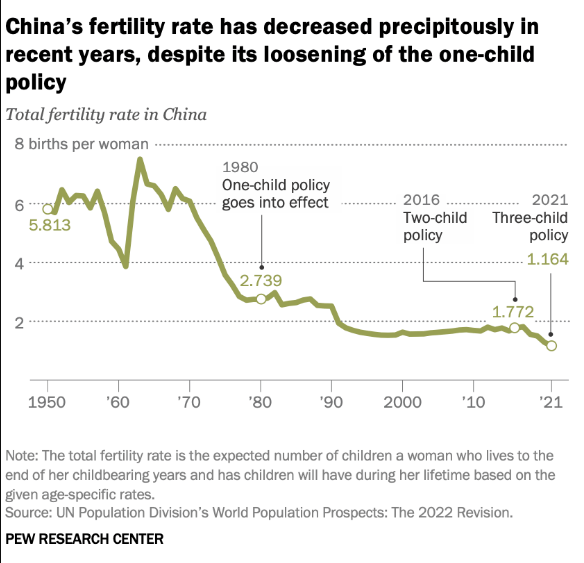
After 1970 the Chinese fertility rate dropped following the same trend as in most other developing nations, reaching 2.7 by 1980. But government concerns about the trend toward over-population led to the imposition by Deng Xiaoping in 1980 of the One-Child policy, which limited many families to having only a single child. The policy was encouraged by propaganda and enforced by hefty fines, or even sometimes forced abortions or sterilization, as penalties for violations. Although many exceptions were introduced during the 1980s, especially for rural parents, the policy led to a much larger reduction in fertility rate than originally anticipated, as well as to unanticipated impacts on the demographic makeup of a generation. By the 1990s Chinese fertility rates had dropped to around 1.6, well below the level needed to maintain a stable population. Furthermore, since the Chinese had a strong cultural preference for sons, families often aborted or abandoned unwanted daughters, leading to a generation of “missing women,” which further affected birth rates.
The fertility rate recovered slowly to 1.77 by 2016, but the government was by then concerned about population loss, so it relaxed the policy to allow two children per family “to improve the balanced development of population,” i.e., in the hope of matching males to females in the subsequent generation. Despite that government program, the fertility rate then dropped precipitously to 1.16 by 2021, and that does not even yet include the major effect the COVID-19 pandemic has had on Chinese births and population. In response, the government has further relaxed the family size limits to allow three children. But by now, Chinese women have largely adopted the socially acceptable view that giving birth to one child is enough; former family pressures to produce larger families have largely disappeared. In a recent Ipsos survey of worldwide attitudes about “ideal” family size, an astonishing 91% of Chinese respondents said the ideal family should have no more than two children. In 2022 Chinese deaths exceeded Chinese births for the first time in six decades and a steady decline in China’s population going forward may well be unavoidable. The global trends seen in Fig. II.3 have been exacerbated by Chinese government policies.
Fertility Evolution in the U.S.:
Fertility rates in the U.S. followed the same trend as in most other developed countries from the Baby Boom 1950s to about 1980, but then more or less stabilized until 2007. This is reflected in Fig. II.8, which plots birth rate (number of births per 1,000 women of childbearing age) rather than fertility rate. The birth rate fluctuated between 6.5% and 7%, depending on economic conditions within the country. When the economy was robust, as in the early 1990s and the early years of the current century, birth rates were relatively high, and they dipped when recessions hit and families became more concerned about being able to financially support more children. As Bricker and Ibbitson put it in their book Empty Planet, “Economic uncertainty is a powerful form of birth control.”
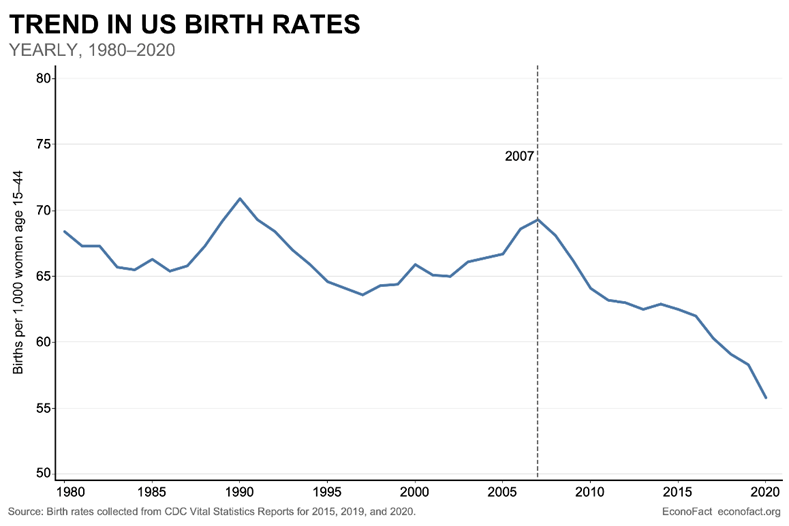
The Great Recession that began during 2008 and caused widespread unemployment through 2010 led to a substantial drop in birth rates around the world, including in the U.S. But while the U.S. birth rate stabilized for several years at a relatively low rate, it has dropped rapidly since about 2016, again without even yet factoring in the impact of the COVID-19 pandemic of 2020-21. The causes of this recent decrease are not yet well understood, but they seem to reflect personal choices more than economic conditions or government policies. We will explore some of the attitudes behind those personal choices in Section III.
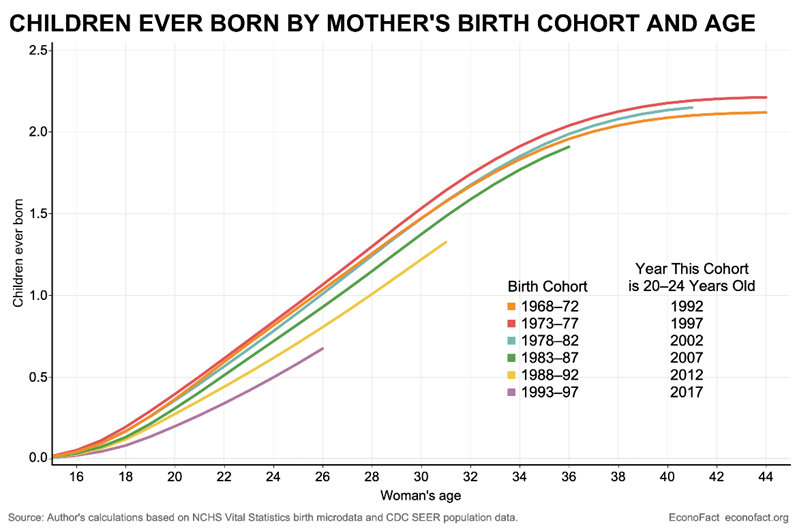
As seen in Fig. II.9, a significant part of the U.S. trend results from women delaying childbirth, on average, as they seek higher education, a stable entry into the workforce, and family economic stability before taking on the increasing costs of child rearing. U.S. Census reports have documented an increase in the median age at which women give birth from about 27 in 1990 to 30 in 2019. And that delay affects all ethnic groups of women in the U.S. similarly. A delayed start in raising a family runs up against women’s biological clocks and leads to a reduced overall birth rate. As in China, the social acceptability of women having only one or zero children has advanced rapidly over a generation. This effect is illustrated in Fig. II.10, where women born in the mid-1980s and later have shown a steadily decreasing tendency to bear children by any given age of the woman than was typical of earlier generations.

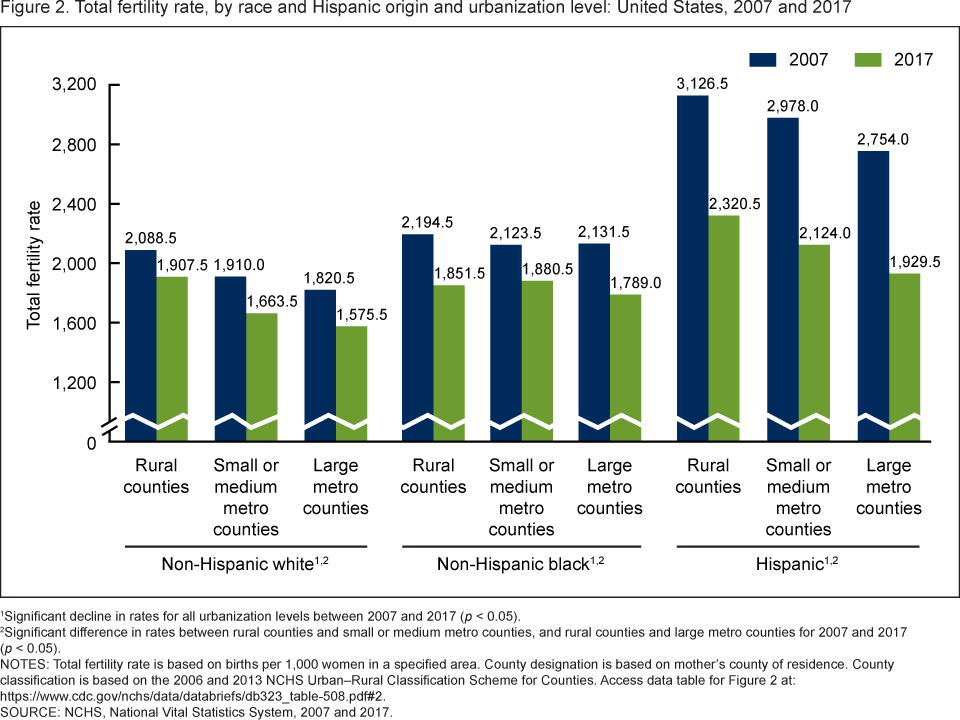
Although women of all ethnic groups in the U.S. are delaying having their first child, the decrease in fertility since 2007 is most prominent among Hispanics, as shown in data from the Centers for Disease Control (CDC) in Fig. II.11. (The percentage drop in fertility is also very large among indigenous communities, though these represent a much smaller fraction of the overall U.S. population.) Hispanic women have been relatively recent additions to the higher education and workforce pools. Many U.S. Hispanic families are relatively recent immigrants and the rapid decrease in Fig. II.11 may reflect not only the impact of the Great Recession, but also a generational change, as younger Hispanic women get more integrated into American, rather than Latin American, culture. A number of Western populist governments are trying to greatly restrict immigration because some fraction of their citizens fear that new groups with high fertility rates will rapidly take over both the existing culture and political power in the country. But what has actually been observed in most cases is that within a generation of their entry into the country, immigrant communities tend to adapt to the existing culture and to existing birth rate trends among the already established population.

III. the causes
Usage of contraceptives:
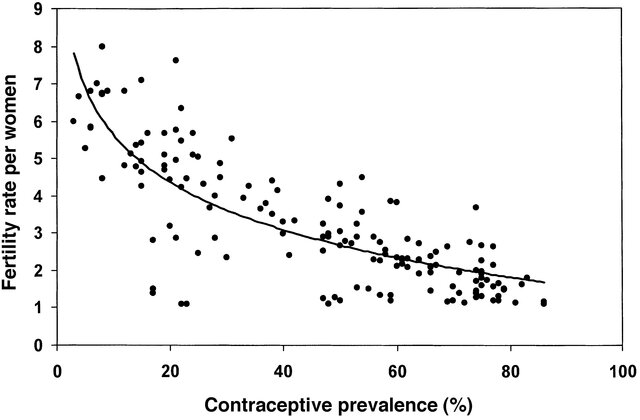
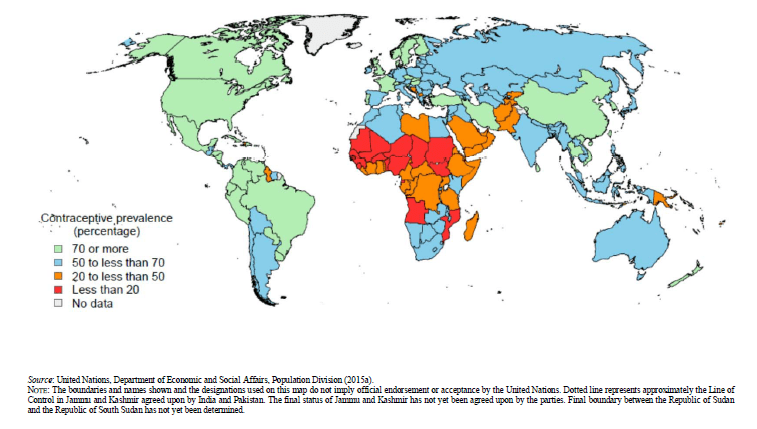
In order to probe in more detail the causes of the accelerating worldwide Baby Bust, we can examine data on correlations of fertility rates with other variables. The dominant factor is revealed in Fig. III.1, which shows U.N. Population Division data for the year 2000 manifesting the correlation among the world’s countries between fertility rate and contraceptive usage. A world map of contraceptive prevalence is shown for 2015 in Fig. III.2. The countries with less than 50% adoption of contraceptive practices in that map align extremely closely with the countries with high fertility rates in Fig. II.4.
Clear evidence that rapid decreases in fertility rate accompany widespread adoption of contraceptive practices is illustrated by data for South Korea in Fig. III.3. In the aftermath of the Korean War of the early 1950s, South Korea’s high fertility led to a doubling of the country’s population over 35 years. The South Korean Baby Boomers drove the country’s “economic miracle,” which raised the standard of living rapidly during the second half of the 20th century. That economic boom was accompanied by a contraception boom and a precipitous decrease in fertility rates, down to the currently unsustainable level below 1.0. As seen in Fig. III.3, the rise in contraceptive usage also lowered the rate of abortions in the country. Ironically, some religious groups claiming to honor protection of fetuses have lobbied governments to ban abortion while also wanting to restrict accessibility of contraceptives. But such a restriction is only likely to increase the number of women seeking abortions, whether they are legal or not.
Female education:
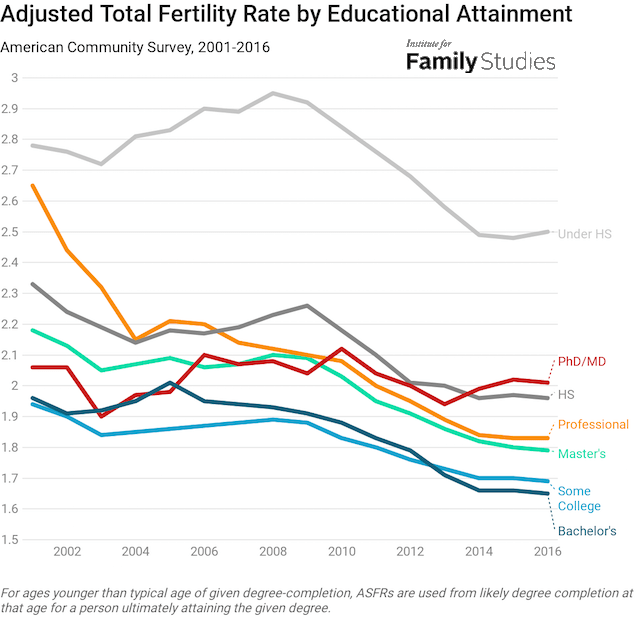
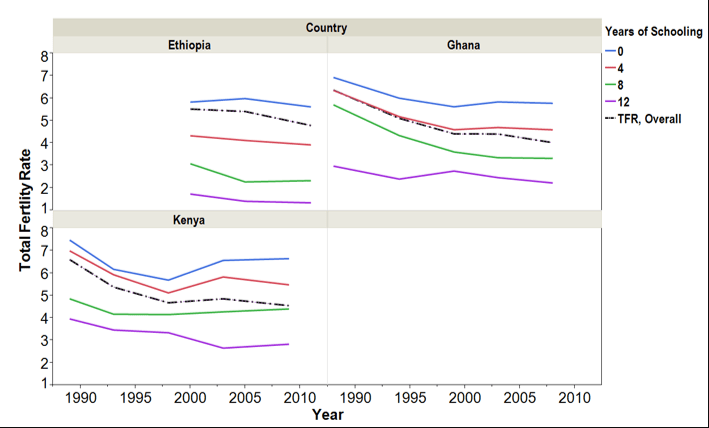
The single greatest determining factor in women’s adoption of contraceptives is the level of their education. Thus, the worldwide correlation of average years of female schooling and average national fertility rate in Fig. III.4 looks very similar to the correlation with contraceptive prevalence in Fig. III.1. The strong dependence on the level of female education appears worldwide, independent of the prevailing culture or form of government in a country. This is illustrated in Figs. III.5, III.6, and III.7 by data for China, for the U.S., and for several African countries, respectively. In particular, the modest fertility rates in Ethiopia, Kenya and Ghana among women who have at least twelve years of schooling suggest that overall African fertility will decline rapidly through the rest of this century as a larger fraction of African women make it through high school. Worldwide groups such as the Taliban in Afghanistan who are trying to limit female schooling are doing so to maintain a patriarchal society and to keep birth rates high.


The major impact of education for teenage girls and access to contraceptives is a dramatic reduction in teen pregnancies. Figure III.8 illustrates that in the U.S. teen births have fallen by nearly a factor of six since the Baby Boom 1950s to the present, while overall fertility in the U.S. has dropped by a factor of two over the same time period. An especially steep drop in teen pregnancies since the 1990s has accompanied a substantial increase in high school completion, especially for minorities. Bricker and Ibbitson point out that “between 1996 and 2016, the Latino high school dropout rate fell from 34% to 10%. The black rate went from 16% to 7%. For whites, it was 8% to 5%.”

Urban vs. rural residence:
The initial decline in birth rates during the 19th and early 20th centuries among a number of Western countries could be attributed, as we described in Section II, in large part to the increasing urbanization in industrialized economies. But what role does urban living play in today’s accelerating Baby Bust? As revealed in Fig. III.9 by U.S. fertility data in rural and urban counties within two size categories, urbanization continues in the 21st century to have influence on fertility rates, although much smaller effects than contraceptive usage and educational level.

Figure III.10 shows that the major impact of urban living today is via delay in women’s childbirth. U.S. women residing in large metropolitan counties are delaying first childbirth by about three years in comparison to women in rural counties and by nearly two years compared to women in smaller metropolitan counties. Presumably, the delay reflects a greater entry into the workforce by urban women, who face a substantially higher cost of living in addition to greater job opportunities. However, as emphasized by Fig. III.11, the ongoing reduction in fertility over time affects rural as well as urban U.S. women, and all ethnicities.

Most countries in Africa are still in Stage 2 of the demographic transition, with high fertility rates and decreasing death rates. But by that token, Africa is the region where fertility may be most strongly affected by ongoing urbanization. And, as reported by the Council on Foreign Relations, “Africa is the fastest urbanizing place on the planet.” The data and projections in Fig. III.12 show that 60% of the African population as a whole is anticipated to reside in urban areas by 2050, and all regions of Africa have seen dramatic increases in the urban fraction of the population during the past half-century. When combined with increasing female education rates and usage of contraceptives, the increased urbanization is expected to produce a rapid decrease in fertility on that continent during this century, following past trends from the developed world. The fertility rate in Kenya, for example, has already decreased from 8 in 1980 to 4.9 in 2003 and 3.9 in 2014. The African population will continue to grow rapidly because there are so many young people there now (the median age is only nineteen), but based on experience from the rest of the world, one can expect African population also to peak within a century or so.

Religion:
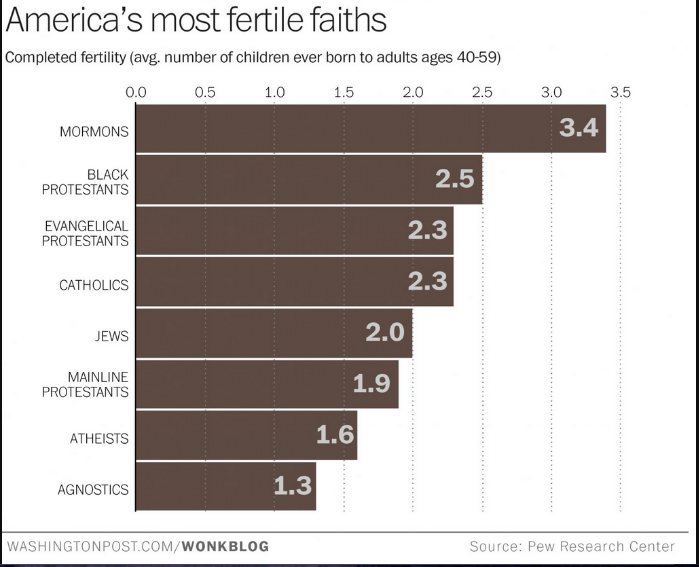
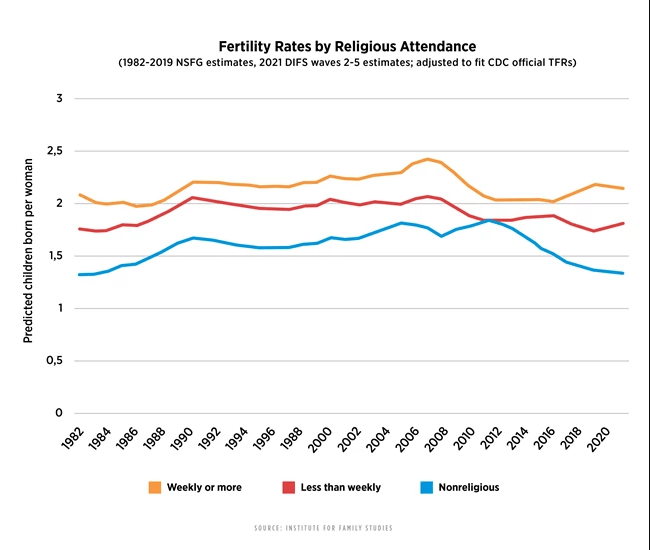
Religious affiliation also has significant influence on fertility. Results from a 2015 Pew Research survey in Fig. III.13 show that among U.S. religious (or irreligious) groups, fertility rates vary from a high of 3.4 for Mormons to a low of 1.3 for agnostics. The leaders of organized religions, charged with overseeing the maintenance and propagation of the faith, have traditionally encouraged procreation and discouraged contraception. This is especially true of the Catholic Church, but as its influence has waned in the 21st century in countries and regions such as Spain, Ireland, the Philippines, and Quebec, fertility rates among Catholics in those locations have dropped markedly. There is also a correlation of fertility with the level of religious attendance, as evidenced in U.S. data in Fig. III.14: the more frequently women attend religious services, the higher their birth rates, on average.
But the influence of religious affiliation also depends on the circumstances within different countries. This is illustrated, for example, by Israeli statistics in Fig. III.15. In contrast to all other religious groups in Israel, Israeli Jews have actually increased their fertility rates during the 21st century, in part to avoid a future in which they are overtaken by Muslims as a fraction of the country’s population.

Women in the workforce:
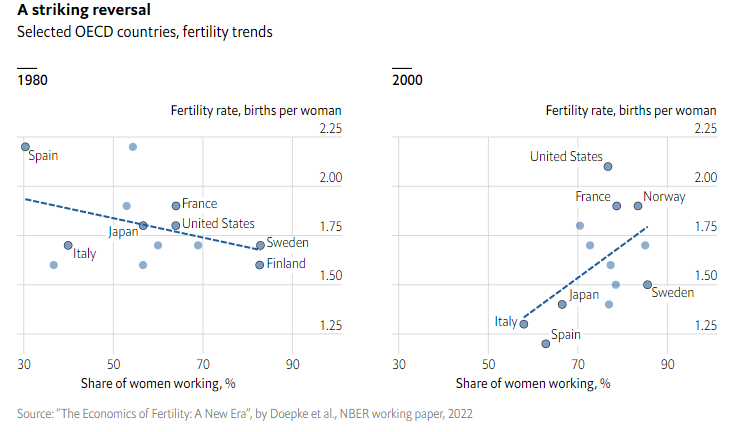
The influence of women entering the workforce on fertility is complex and time-dependent. Working women tend to delay pregnancies in order to establish a career; on the other hand, they enhance household income and make it more economically feasible to raise children. A 2022 study of trends in various developed countries by the National Bureau of Economic Research (NBER) showed (see Fig. III.16) that in 1980 countries with a larger percentage of women in the workforce tended to have lower fertility rates. A likely explanation is that working women found it difficult and often incompatible with their careers to have children, at least during their earlier child-bearing years. But by 2000 the trend appeared to reverse. On the other hand, if one examines the figure in detail, one sees that as females in the workforce increased some countries (e.g., Spain, Italy, Japan, and Sweden) saw a significant decrease in fertility rates between 1980 and 2000, while others (Norway and the U.S.) saw significant increases (that was prior to the sharp fertility decrease in the U.S. after the 2008 Great Recession).
The NBER analysis found that “four main factors lead to higher fertility rates [among working women]: flexible labour markets, co-operative fathers, favourable social norms, and good family policies. In Norway, for example, where childcare is highly subsidised—in 2021 the government spent $29,726 per toddler—both the female employment rate and the fertility rate are among the highest in the OECD, a club of mostly rich countries. No doubt 49 weeks of parental leave helps too.” The significant impact of co-operative fathers is shown in Fig. III.17.

Women’s choices:
Female education and the widespread availability of reliable contraceptives gives women the freedom of choice in deciding how many children to have. The rapid and largely unexplained decline in U.S. fertility rates during the past decade, seen in Fig. II.8, has prompted the New York Times and Morning Consult to carry out a recent survey of 1858 U.S. men and women between the ages of 20 and 45 to probe their reasons for planning smaller families than they consider ideal, or for choosing not to have children at all. As revealed in Fig. III.18, the most common reason for personal choices to limit family size is the growing expense of raising a child, while most U.S. families’ earning power has remained stagnant and a growing number of potential parents are saddled with ballooning college loan debts. But concerns about the future of the economy, domestic and global instability, climate change, and other human-caused problems also play significant roles, along with a generational change in personal priorities.

Government policies:
This brings us to the question of how government policies can impact fertility rates. We have already seen that China’s blunt attempts to do this have mostly failed, either rather drastically overshooting, as in the One Child Policy, or having little effect ever since, once the government had inadvertently made it socially acceptable for families to have only one child.
And China is not the only Asian country to have underpredicted the fertility decline that would naturally accompany economic development, without government intervention. In the aftermath of the Korean War, South Korea had a fertility rate around 6.0, typical of underdeveloped economies, while its economy began to grow rapidly with the help of the U.S. Its population doubled from 20 million to 40 million from 1950 to 1985. The children of this baby boom drove South Korea’s ensuing economic miracle, characterized by state-supported industries such as Samsung, Kia, Hyundai, and LG. Concerned about its own “population bomb,” South Korea’s military government at that time aggressively promoted sex education and birth control. As a result of that campaign, the country’s fertility rate dropped rapidly, passing through replacement level in the 1980s, but overshooting to its present very low and problematic level below 1.0.
What have other countries done? The example of Sweden demonstrates that it is possible for government policies to raise fertility rates in the margins by introducing generous family policies, but also that such policies are expensive and difficult to maintain during economic downturns. Following the advice of a powerful Swedish couple, Gunnar and Alva Myrdal (he shared the Nobel Prize in Economics in 1974 and she shared the Nobel Peace Prize in 1982), in their 1934 book Crisis in the Population Question, the Swedish government was an early adopter in the mid-20th century of family-friendly policies. They offered “free health care for pregnant mothers and generous family allowance payments. It became illegal to fire a woman because she was pregnant or a mother.” Those policies brought the Swedish fertility rate from a low of 1.7 in 1935, during the Great Depression, back up to 2.5 before the widespread availability of the birth control pill.
Beginning in the 1970s Swedish fertility rates started dropping again, as they did throughout the developed world. In response the Swedish government “expanded daycare and launched campaigns that encouraged men to do their share of the housework and child raising. By 1989 maternity leave had been extended to one full year at 90% of income, and the fertility rate had ticked back up to 2.1” (see Fig. III.19). But a major economic recession in Sweden in the 1990s led to cutbacks in maternal support programs, and the fertility rate dropped back down to 1.5 by the turn of the century. In response, the Swedish government made maternal support even more extensive after the recession ended. “Parental leave now stretches to 480 days, most of it at 80 percent of earnings. Each spouse is required – required! – to take two months off, or forfeit part of the benefit. Along with a basic family allowance benefit, each additional child earns you an additional sum, with the per-child amount increasing with each child. In Stockholm, parents pushing prams get to ride public transit for free. Most employers offer paid days off for parents who need to stay home with a sick child.” The net result is that the fertility rate in Sweden returned by 2010 to nearly 2.0, still slightly below “population replacement level,” but higher than in most other European countries. But since 2010 the fertility rate has begun to drop again, following the worldwide trend.

Bricker and Ibbitson conclude: “Extensive support programs aimed at encouraging parents to have children do have an impact. They can move the needle. But they don’t move it a lot, and such programs are very expensive and hard to maintain in an economic downturn.” In addition, the impact of such family policies is often smaller than that of other cultural trends.
In a number of Asian countries, especially Japan and South Korea, the Baby Bust is exacerbated by cultural biases. These countries saw explosive economic growth during the latter decades of the 20th century, but as Bricker and Ibbitson point out, “societies don’t evolve as fast as their economies. Old values clash with new realities. And unintended consequences trip up governments’ best-laid plans.”
South Korea, for example, did not develop a suitable pension plan for retirees during its rapid expansion. It has instead raised the mandatory retirement age so that seniors could remain at work longer. And Korean culture values seniority, so that the glut of elderly workers ends up blocking entry and advancement paths in the workplace for the dwindling younger generations, and delays attainment of sufficient financial stability to raise children. Female workers who do get pregnant are likely to be let go by employers or laid off so that they lose seniority and pay levels.
Furthermore, as seen in Fig. III.17, men in South Korea and Japan are culturally less inclined to help substantially with housework and child rearing – their parents who often live with the younger married couples do not encourage such help — so young women in these countries are even less likely than their Western counterparts to have children. Neither country has developed national child-care policies akin to those in some Western countries. The younger generation in these Asian “economic miracle” countries suffers not only from reduced desire for large families, but also from a malaise resulting from the economic difficulties accompanying the ongoing population inversion. In Japan the mean age for women to have their first child is now 30, compared to 26 in the U.S., while in South Korea 30 is the mean age at which women are now first marrying. And the fertility rate in South Korea has now plummeted below 0.8.
To make matters still worse, these countries value ethnic homogeneity and are unwelcoming to immigrants, cutting off a path that some countries with birth rates below replacement level are encouraging in order to maintain stable populations. The refugee rate per capita in Japan and South Korea is less than 1% of that in Canada. Some of the Asian miracle countries have now begun to adopt modest policies – far short of Sweden’s aggressive family support – to encourage fertility, but with little result to show for them. Singapore, with a fertility rate of 1.2, created a state-sponsored dating agency, the Social Development Unit, and in 2012 “declared the evening of August 12, National Day, to be ‘National Night,’ when couples were encouraged to procreate.” (Ethnic homogeneity is one thing, but birthday homogeneity seems a bridge too far! The Singaporeans, by and large, agreed.) South Korea now has “government grants for couples seeking fertility treatments, paternity leave for fathers, and preferred admission to public child care facilities for parents with three or more children.” The Korean government has also encouraged workers to go home early from work one evening every month (!) to help with increasing fertility, but to little avail. The Asian countries now provide the “canary in the coal mine” to alert the rest of the world to the impending economic and social disasters that will accompany the accelerating Baby Bust.
— Continued in Part II —
