
December 11, 2022
IV. Ranked-Choice Voting:
Ranked-choice voting is a procedure for determining the winner in a contest that involves three or more candidates. In the U.S., ranked-choice voting is a relatively new concept, although this form of voting has been utilized in Australia for over 100 years. There are some good sources of information about ranked-choice voting. Ones that we have used are Ballotpedia.org, FairVote.org and RCV123.com. The latter site has a discussion and examples that allow one to apply the concept of ranked-choice balloting to a number of different cases in which one wants to rank-order a list of preferences. Each of these sites has a list of “pros and cons of ranked-choice voting;” however, since all of these sites are proponents of ranked-choice voting, they spend some effort debunking the “cons” of this method of balloting.
As of July 2020, the states that have towns or counties that adopted and/or implemented ranked-choice voting are shown in Figure IV.1.
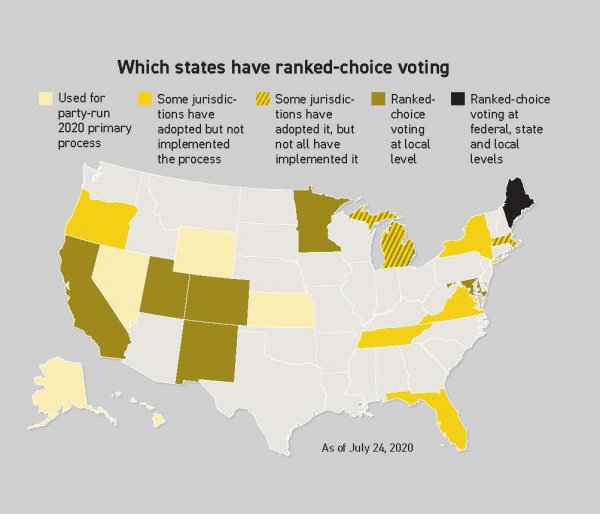
Figure IV.1: States that have regions which have adopted and/or implemented ranked choice voting (RCV), as of July 2020. In yellow are states that have used ranked choice voting for 2020 primaries run by their parties. In orange, states that have adopted but not implemented RCV. In red, states that used RCV at the local level. In black, states that utilized RCV at the local, state and national level.
Here is a summary list of states that have used ranked-choice voting (RCV) in elections at various levels. At the moment (December 2022), no other states utilize RCV.
Alaska: Uses RCV in federal and state elections.
California: Four cities have used RCV with another 3 cities scheduled to adopt it in the 2022 elections.
Colorado: Three cities have used RCV with another two cities scheduled to implement RCV in 2023 elections.
Hawaii: Has adopted legislation to allow RCV in federal special elections and special elections to fill county council seats; scheduled to go into effect Jan. 1, 2023.
Maine: Uses RCV in federal elections, and municipal elections in one city.
Massachusetts: Two cities use RCV and a third has adopted but not implemented RCV.
Michigan: One city uses RCV while a second has adopted but not implemented RCV.
Minnesota: Five cities have adopted RCV.
New Mexico: Two cities have adopted RCV.
New York: New York City has adopted RCV.
Oregon: One county has adopted but not implemented RCV.
Utah: A pilot program has been developed that allows municipalities to adopt RCV between 2019 and 2025, after which time the state will decide whether to continue it. Thus far 23 municipalities have adopted RCV.
Vermont: One city has adopted but not implemented RCV.
Virginia: From 2020 allows cities to adopt RCV beginning in 2021.
Two states (Florida and Tennessee) have passed legislation that bans cities or counties in that state from implementing RCV.
Ranked-choice balloting comes into effect when a given election has more than two candidates. Let us give an example that explains the basic features of RCV. Here, we have three candidates A, B and C contending for an elected office. Every voter is given the option of ranking the three candidates in order of preference. In the first round of ballot counting the first preferences for each candidate are counted, as shown in Table IV.1. After the first ballot A received the most votes, obtaining a plurality but not a majority of the votes. In the traditional “first past the post” (FPTP) system, candidate A would be declared the winner of the election. Another possibility is that the top two candidates in this election (in this example, candidates A and B) would proceed to a runoff election that would be held at a later date.
In the ranked-choice system, if one candidate receives a majority (i.e., more than 50%) of the ballots in any round, the process of elimination stops and that candidate is declared the winner of the election. In this example, candidate A receives the most first-preference votes; however, none of the three candidates receives a majority of the 2,500 votes cast.
| Candidate | First-preference votes | percentage |
| A | 1000 | 40% |
| B | 800 | 32% |
| C | 700 | 28% |
Table IV.1: First preference vote tallies in a hypothetical example of ranked-choice voting among three candidates.
At this point, the candidate with the lowest number of votes (in this example, candidate C) is eliminated. The ballots that listed candidate C as the first preference are then examined. The original first-preference votes for C are then distributed to the candidates who were the second-preference choices for C voters. Let us assume that 300 of these second-choice preferences listed candidate A as their second option and 400 listed candidate B.
In a second round, the “adjusted first-preference votes” are tallied. Here, the second-choice preferences for candidate C are added to the first-preference votes for the remaining candidates A and B.
| Candidate | Adjusted first-preference votes | percentage |
| A | 1300 | 52% |
| B | 1200 | 48% |
Table IV.2: Second round of vote tallies in ranked-choice voting. After candidate C is eliminated, the second-preference votes for C are added to the first-preference votes for candidates A and B.
After the second round of balloting, as shown in Table IV.2, candidate A has more than 50% of the adjusted vote totals, so A is declared the winner of this election.
Advocates of RCV claim that their system is preferable to the FPTP system, since in that system a candidate can win by amassing just a plurality of the votes cast. In the RCV system, the elimination of the lowest remaining candidate proceeds until one candidate emerges with a majority of the adjusted votes, and this process does not require a subsequent runoff election.
In the example we showed, the candidate who initially garnered a plurality of the first-preference ballots was the eventual winner of the election. However, this need not be the case. We show this in another hypothetical example, in this case with four candidates. After the initial round in which first-preference ballots are counted, the four candidates have the following votes:
| Candidate | First-preference votes | percentage |
| A | 1000 | 33.3% |
| B | 800 | 26.7% |
| C | 700 | 23.3% |
| D | 500 | 16.7% |
Table IV.3: A hypothetical example of RCV voting with four candidates. Shown is the result of the initial round of counting, where only first-preference votes are listed.
After the first round, no candidate has a majority of the 3000 votes cast. So candidate D, with the fewest number of votes, is eliminated. Let us assume that the second-place votes that listed candidate D as first were 100 each for candidates A and C, and 300 for candidate B. When these votes are apportioned to the remaining 3 candidates, the second round of vote counting produces the result shown in Table IV.4.
| Candidate | Adjusted first-preference votes | percentage |
| A | 1100 | 36.7% |
| B | 1100 | 36.7% |
| C | 800 | 26.7% |
Table IV.4: The second round of balloting, with second-preference votes from candidate D added to the first-preference votes of the remaining 3 candidates.
After the second round of balloting, no candidate has a majority of the votes cast. So the remaining lowest-place candidate, candidate C, is eliminated. We then examine the second-preference votes for those who ranked candidate C first. We also examine the third-place votes for those who ranked candidate D first and C second. Let us assume that the total of those votes amounted to 500 for candidate B and 300 for candidate A. When these are added to the votes for A and B, the third round of vote counting produces the result shown in Table IV.5.
| Candidate | Adjusted first-preference votes | percentage |
| B | 1600 | 53.3% |
| A | 1400 | 46.7% |
Table IV.5: The third round of balloting, after eliminating candidate C and apportioning her second-preference ballots, plus third-preference ballots from voters who ranked D first and C second, to candidates A and B.
At this point, candidate B has a majority of the votes cast and is declared the winner. This is despite the fact that on the first round of balloting, A received more first-preference votes than B. Because voters whose first preference was candidate C or D ranked candidate B more frequently as their second-choice, candidate B eventually overtook candidate A. In RCV voting in the U.S. to this point, only 4% of elections resulted in a come-from-behind winner. The greatest “comeback” winner to date in an RCV tabulation was ten points (i.e., the ultimate winner trailed the 1st-choice leader by ten percentage points). So it is rare that the leader in the first-preference round of the balloting does not turn out to be the eventual winner. But it can happen in cases where the first-ballot leader is viewed sufficiently negatively by a sizable fraction of the electorate.
In these two examples, all 3000 of the first-preference ballots survived until the final round. Ballots that do not survive all of the rounds of voting are referred to as “inactive” ballots; sometimes they are referred to as “exhausted” ballots. This happens in one of three circumstances. The first occurs when all of a voter’s preferences have been eliminated from contention; thus in a later round, that voter’s preferences are no longer counted. This is described as “inactive by ranking limit.” A second reason is that a voter does not use all the rankings available to them. All their ranked candidates are eliminated at a certain round of the tabulation. This is called “inactive by voluntary abstention.” A third way for a ballot to become inactive is that the voter makes an error on their ballot (a common example would be that they rank one candidate as their first choice, but then name the same candidate as their second choice). This is called “inactive by error.” At each stage of voting, the percentages of the vote are calculated using the number of “continuing ballots” – this is the total number of ballots cast in the election minus the number of “inactive” ballots in that round.
We can illustrate this by returning to our second ballot example and imagining a different set of circumstances. After the second round of ballot counting shown in Table IV.4, candidate C with the smallest number of votes is eliminated. We then examine the second-choice votes for those who ranked candidate C first. We also examine the third-choice ballots for those who ranked candidate D first and C second. Let us assume that 300 first-preference votes for candidate C listed candidate D as their second choice. However, since candidate D has been eliminated, those 300 votes become “inactive.” Let’s say the remaining 500 preferences amount to 300 for candidate B and 200 for candidate A. In that case, instead of Table IV.5 the result of the third round of counting would be given by Table IV.6.
| Candidate | Adjusted first-preference votes | percentage |
| B | 1400 | 51.9% |
| A | 1300 | 48.1% |
Table IV.6: The third and final adjusted votes for an election between four candidates. Candidate B receives a majority of the “continuing ballot total” of 2700, after 300 “inactive” ballots have been removed.
Once again, candidate B ends up with the majority of the “continuing” ballots, after the 300 “inactive” ballots have been removed. A useful non-hypothetical example of RCV in action was provided in the state of Alaska August 2022 special election for the state’s one Congressional seat. This was held after the incumbent Don Young died earlier in 2022. The three candidates were Democrat Mary Peltola and Republicans Sarah Palin and Nick Begich. Table IV.7 shows the ranked-choice first-preference balloting for the three candidates:
| Candidate | First-preference votes | percentage |
| Mary Peltola | 75,799 | 40.19% |
| Sarah Palin | 58,973 | 31.27% |
| Nick Begich | 53,810 | 28.53% |
Table IV.7: Results of first-preference ballots for Congressional representative in Alaska special election in summer 2022. Nick Begich had the smallest number of first-preference votes and was eliminated going into the second round of ballot counting.
Initially, there were 188,582 legitimate ballots. In the first round, none of the three candidates had a majority of the ballots. Nick Begich had the lowest total first-preference votes of the three candidates, so he was eliminated. First-preference ballots for Begich were then transferred to the second choice of those voters. Of ballots listing Nick Begich as their first preference, 15,467 listed Peltola as the second-choice candidate, 27,053 listed Palin as the second choice, and 11,243 did not list a second choice; these 11,243 became “inactive” ballots because they had no lower preference for one of the surviving two candidates. There were an additional 47 “overvotes;” these were cases where the voter had incorrectly listed Begich as both their first and second preference. When the second-preference votes were added to the first-preference totals of Peltola and Palin, the results were
| Candidate | Adjusted first-preference votes | percentage |
| Mary Peltola | 91,266 | 51.48% |
| Sarah Palin | 86,026 | 48.52% |
Table IV.8: The adjusted votes for Peltola and Palin after adding the second-preference ballots from Nick Begich to those two candidates.
Of the 177,292 “continuing ballots,” Peltola received 51.48% and Palin 48.52%. Thus Peltola was declared the winner of the election because she received a majority of the continuing ballots. Here, 6% of the initial total ballots were “inactive” because those voters had Begich as their first preference and listed no legitimate second preference. RCV allowed the equivalent of an instant runoff election, without delay, between the top two candidates.
Pros and Cons of Ranked-Choice Voting:
Here we list the pros and cons of ranked-choice voting. We will initially summarize the arguments made for and against ranked-choice voting. We will then analyze some of these arguments. And we will compare the arguments with results from two of the most recent U.S. elections using ranked-choice voting – the August 2022 special election for the Alaska Congressional seat and the June 2021 Democratic primary for the mayor of New York City.
Here are some arguments made in favor of ranked-choice voting or RCV:
- RCV is a system that is relatively easy to understand, and one that provides more information regarding the preferences of voters than the “typical” voting rules for American elections. It eliminates the possibility of winning an election with a plurality of votes short of a majority, and it does so by offering the equivalent of an “instant runoff.”
- RCV is by now an established system of voting. RCV has been used in Australian elections for over 100 years (in a later section we will review how the Australian system works). In the U.S., the first modern election to use RCV was in San Francisco in 2004. To date, over 13 million Americans live in areas where RCV is available to them.
- The percentage of Americans who identify as “independent” has been steadily increasing over the past 30 years. This trend is shown in Figure IV.2. The percentage of Americans who identify as “independent” has increased steadily from 1988 to 2021, and now represents over 40% of voters. The percentage of Americans who identify as Democrat and Republican is now below 30% for each party. This suggests that more independent candidates, or candidates representing third parties, are likely to run in future elections. It is argued that ranked-choice voting is the best method for showing preferences in a race with three or more candidates. RCV advocates also assert that the existence of ranked-choice voting will provide an incentive for more candidates to enter an election, as well as a greater opportunity for independent candidates to win elections in which voters are generally displeased with the major party candidates. It is also argued that the existence of ranked-choice voting should provide incentives for a more diverse group of candidates to seek representation on the ballot.
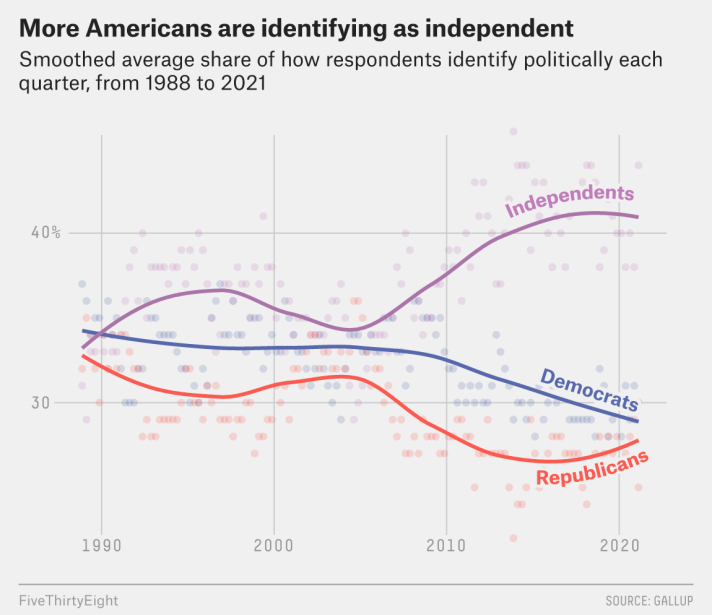
Figure IV.2: The percentage of American voters who identify as Democrat, Republican or Independent as a function of time from 1988 to 2021. Since 2005, the number of Americans who identify as Democrat or Republican has fallen, while those who identify as independents has risen dramatically.
- RCV eliminates the need for runoff elections. As RCV involves a sequence of rounds to evaluate the votes, it is sometimes called “instant runoff voting.” As we have seen, RCV is not identical to a runoff. With a runoff, one starts with a number of candidates. If no single candidate receives a majority of the votes cast, then the top two finishers compete in a separate later election. But a second election is expensive. Studies found that runoff elections in Texas generally cost roughly half of the original primary cost. In addition, runoffs force people to vote on two separate occasions to have their ballot count. The turnout for runoff elections generally was smaller than the turnout for the initial voting. A study by Thirdway.org found that runoff elections in Texas and Louisiana from 2016 to 2020 generally found turnout decreases for the runoff election between 30% and 76% (although one Louisiana gubernatorial primary in 2019 showed a 12% increase in turnout for the runoff).
- RCV eliminates the “spoiler effect” of having two candidates with similar appeal split one set of voters. For example, in the 2000 U.S. presidential race, George W. Bush “beat” Al Gore by about 500 votes in the state of Florida after the Supreme Court stopped the Florida recount. In that election, the candidate who received the Florida electoral votes gained a majority in the Electoral College. However, Green Party candidate Ralph Nader received 97,500 votes in Florida, and exit polls showed that voters for Nader favored Gore over Bush by a substantial margin. RCV would allow voters to choose a third-party or protest candidate as their first preference without having to worry that their vote would be “wasted” on a candidate very unlikely to win the election. They could choose as their second preference a candidate from one of the two traditional parties. With the growth of Libertarian, Green and independent candidates, it makes sense for voters to be able to navigate ballots that have more than two candidates.
- In our current system, people who vote for third-party or independent candidates worry that they are “wasting” their vote. If they vote for a party that currently represents only a small fraction of the electorate, or that represents a special-interest group, then voters who support that individual are taking their vote away from a candidate with a better chance of winning the election. In some cases, as in the case we cited of the 2000 presidential election, votes for Green Party candidate Ralph Nader almost certainly determined the outcome in the decisive state of Florida after a 5-4 Supreme Court ruling stopped the Florida state ballot recount.
- It is argued that the existence of RCV should encourage candidates to run on issues rather than issuing attack ads. Because voters are allowed to rank several candidates in addition to their first preferences, it is argued that this should encourage cooperation rather than competition among candidates. Candidates who run attack ads may be ranked lower by supporters of candidates who are attacked. Candidates who express extreme policy positions may also be ranked lower by those voters who do not share the extreme opinions. It is also argued that ranked-choice voting might provide an incentive for smaller parties to seek coalitions with larger parties. This might promote situations where groups with somewhat different agendas profit by working together. Thus, even though RCV elections generally end up with the same winner as the FPTP or runoff methods, advocates argue that RCV elections might make positive changes in the way that elections are conducted.
Objections to RCV:
Opponents of ranked-choice voting make several arguments against this system. Here is a list of some of those objections. At this point, we will simply state the objections. Later, we will look at data from elections that either supports or refutes the arguments for or against ranked-choice voting methods.
- RCV is an arcane system that is extremely difficult to understand. It will effectively disenfranchise large groups of people, including people for whom English is a second language, poor people who are not well connected to the media, elderly people who can’t comprehend the complicated details of RCV, and people of color.
- RCV puts too much of a burden on the citizen. Now, they need not only to understand the policy platform of their first-choice candidate, they need to research the policy stance of several different candidates. This is too much to ask of the average American voter.
- Our two-party system is working just fine. RCV will promote the proliferation of many different parties and platforms. We should be doing just the opposite – making it very difficult to form third parties. In addition, in the great majority of cases the leader after the first round of RCV voting goes on to win the election. So why bother with the complexity of RCV when you generally get the same outcome from our current system?
- In the multi-round system of RCV balloting, at each stage when one candidate lacks a majority of the active ballots, the lowest-ranking candidate is eliminated and their support is transferred to lower-preference candidates on their ballots. The ballots for those candidates are then “thrown away,” and the citizens who voted for them are effectively disenfranchised.
- At successive rounds in the RCV process, a number of ballots are rendered “inactive” as there are no longer any preferences for candidates still in contention. This means that supporters of those candidates have lost their vote. This violates the principle of “one person, one vote.”
Responses to the Debate on RCV:
Having listed the pros and cons regarding ranked-choice voting, we will first make some general responses to these arguments. Then we will take a deep dive into the 2021 Democratic mayoral primary in New York City, to examine the data that will help us decide the validity of the various arguments about RCV. First, we should say that most of the arguments in favor of RCV need to be thoroughly researched. Although we consider most of those arguments to be reasonable, it is necessary that these claims be interrogated. At the moment, ranked-choice voting is sufficiently rare and local that existing data are not sufficient to establish their credibility. And states such as Maine and Alaska where RCV has gained great popularity are unusual in that they have a reputation for supporting independent candidates and having party affiliations that may be weaker than other states.
However, some of the arguments against RCV strike us as dishonest. First, opponents focus on the fact that a candidate with the smallest number of adjusted votes is eliminated at each round of the process. Opponents thus claim that the supporters of those candidates have had their ballots “thrown out.” They imply that these voters have been shut out of the RCV balloting process. This claim is highly misleading. The first stage of the RCV process is to count the first-preference ballots for each candidate. That is identical to the case for both the FPTP and runoff systems. In the “first past the post” system, the candidate with the largest number of votes is declared the winner, while in the runoff system if no candidate gets a majority of the votes, all candidates except the top two are eliminated from a runoff election, which is held at a later date. A candidate finishing third or lower in the FPTP or runoff system is eliminated from further consideration. However, the preferences of voters for eliminated candidates are still considered in the RCV system. Those voters are not at all “disenfranchised.”
Some critics of RCV point to the fact that the first-place finisher in the election does not necessarily win the election – a second-place or lower candidate has the opportunity to overtake the first-round leader in later rounds of the process. The critics call this unfair. However, this is also the case in the runoff system, where a candidate who initially finished second in the voting could end up beating the original first-place finisher in a runoff election. We know of no one who claims that this process is unfair, although runoff election losers may complain about it.
Advocates of runoff elections claim that they are inherently more fair than the RCV system. In a runoff, voters can directly compare the two leading candidates from the statements that they issue; while in the RCV system, they are asked to compare all candidates without knowing who the top contenders will be. There is something to this claim; if runoff elections garnered the same number of votes as the initial election, this might make a compelling argument. However, a runoff election forces voters to vote on two separate occasions; this will disadvantage those for whom voting is difficult. This includes the elderly, the poor, the disabled, and those who cannot get off work to vote. Recent runoff elections in the ten Southern states that still use them have typically had significantly smaller turnout than in the general election. The runoffs greatly increase the cost of elections. If voting by mail was easy, that might remove some of the barriers to voting in a runoff, as voters would not have to turn up in person but simply mail in a runoff ballot. However, Republicans have recently attempted to greatly decrease the ability to vote by mail, a tactic which makes runoff elections a significant hurdle for large segments of the population. Hence, more voters are disenfranchised by runoff elections than by RCV.
Another tactic used by opponents of ranked-choice systems is to contrast RCV voting with an ideal election system, rather than comparing it with our current system of voting. Let us be clear: ranked-choice voting is not a perfect system of conducting elections. However, instead of analyzing RCV by comparing it with conventional voting systems, some people criticize it for not being perfect. For example, one critic of RCV complains that this method of voting does not divulge a person’s relative rankings of candidates. For example, a voter might rank five candidates A, C, E, D, B in that order from top to bottom. However, it does not tell us whether the voter might consider candidate A much stronger than the other four candidates, who are seen as roughly equal in merit. Well, that is true; however, the traditional method of voting does not reveal those distinctions, either.
Finally, the claim that RCV is too arcane for many voters to understand is based on a hidden assumption that American voters have less reading comprehension ability than Australian voters, who have used RCV successfully for a century.
The 2021 Democratic Mayoral Primary in New York City:
In June 2021, voters for the office of New York City mayor could use ranked-choice voting in the Democratic primary. In principle, Republicans could also have utilized ranked-choice voting. However, there were only two Republicans on the mayoral primary ballot; Curtis Sliwa, founder of the Guardian Angels group, and Fernando Mateo, the Founder of the New York State Federation of Taxi Drivers. So ranked-choice voting was not used in the Republican NYC mayoral primary.
Since Democrats greatly outnumber Republicans in New York City, the winner of the Democratic mayoral primary would have a sizable advantage in the election in November. There were thirteen candidates for mayor on the ballot; these were:
- Eric Adams, the Brooklyn Borough president;
- Maya Wiley, professor at the New School;
- Kathryn Garcia, former Commissioner, NYC Dept of Sanitation;
- Andrew Yang, candidate for US President, 2020;
- Scott Stringer, NYC Comptroller and former Manhattan Borough President;
- Dianne Morales, former CEO, non-profit social services company
- Raymond McGuire, former Citigroup executive;
- Shaun Donovan, former Director, US Office of Management & Budget
- Aaron Feldenauer, attorney;
- Ari Chang, former managing director, JP Morgan Chase;
- Paperboy Love Prince, Brooklyn rapper;
- Jocelyn Taylor, CEO TaylorMade Contracting;
- Isaac Wright, lawyer.
Voters were allowed to rank up to 5 of the candidates. The initial round of balloting produced the following results:
| Candidate | First-preference Votes | percentage |
| Eric Adams | 289,403 | 30.7% |
| Maya Wiley | 201,127 | 21.4% |
| Kathryn Garcia | 184,463 | 19.6% |
| Andrew Yang | 115,130 | 12.2% |
| Scott Stringer | 51,778 | 5.5% |
| Dianne Morales | 26,495 | 2.8% |
| Raymond McGuire | 25,242 | 2.7% |
| Shaun Donovan | 23,167 | 2.5% |
| Aaron Foldenauer | 7,742 | 0.8% |
| Ari Chang | 7,048 | 0.7% |
| Paperboy Prince | 3,964 | 0.4% |
| Jocelyn Taylor | 2,662 | 0.3% |
| Isaac Wright | 2,242 | 0.2% |
| Write-ins | 1,568 | 0.2% |
Table IV.9: First-preference results in the 2021 New York City Democratic mayoral primary. The candidates are listed in the order of their first-preference ballots.
Eric Adams, the strong favorite to win the NYC Democratic mayoral primary, received the most votes, but he did not receive a plurality of the nearly one million votes. Seven further rounds of counting were undertaken; in each round, one or more candidates with the lowest number of votes were eliminated. In the second round, the write-ins were eliminated. The second preferences from those ballots were assigned to the remaining candidates. In the third round Isaac Wright was eliminated and second-choice preferences for his ballots were re-assigned. In the third round, candidates Taylor, Prince, Chang and Foldenauer were eliminated and their second-choice preferences were re-distributed. At this point, 5,314 ballots were inactive or “exhausted” and were eliminated.
On the fourth round, Shaun Donovan was eliminated; his second-choice preferences, and higher preferences from earlier candidates, were distributed among the seven remaining candidates. On the fifth round, candidates McGuire, Morales and Stringer were eliminated. And on the sixth round, candidate Yang was eliminated. Following the sixth round and re-distribution of second-choice ballots, the situation was as shown in Table IV.10.
| Candidate | Adjusted first-preference votes | percentage |
| Eric Adams | 354,657 | 40.5% |
| Kathryn Garcia | 266,932 | 30.5% |
| Maya Wiley | 254,728 | 29.1% |
Table IV.10: The 2021 New York City Democratic mayoral primary at round seven of the ranked-choice voting process.
At this stage, Eric Adams remained in the lead but still did not have a majority of the continuing ballots. In the seventh round of ballot counting, Kathryn Garcia had overtaken Maya Wiley for second place, although Garcia had come in third place in the first round of the ballot process. At this point, 65,714 ballots had become inactive and were no longer counted. After round seven, the lowest place candidate Maya Wiley was eliminated; her second-preference ballots and higher preferences from other candidates were distributed among Adams and Garcia. This left the situation shown in Table IV.11.
| Candidate | Adjusted first-preference votes | percentage |
| Eric Adams | 404,513 | 50.4% |
| Kathryn Garcia | 397,316 | 49.6% |
Table IV.11: The 2021 New York City Democratic mayoral primary after round 8. At this point Eric Adams had more than 50% of the continuing ballots and was declared the winner.
After this round, Eric Adams had a majority of the continuing ballots and was declared the winner of the New York City Democratic mayoral primary. In this round 140,202 ballots had been invalidated. Comparison of Table IV.10 with Table IV.11 shows that a significant shift occurred in the final round of the ballot counting. Until the eighth and final round, Eric Adams had at least an 8-point lead in every round of the ballot counting. However, in the final round he ended up with less than a 1% edge over Kathryn Garcia.
We can examine data from this election to compare them to arguments made for and against ranked-choice voting. First, this particular election was noted for the diversity of its candidates. Nearly 87% of the voters ranked multiple candidates for mayor, and 46% used all five ranking spots. In addition to the mayoral primary, there were primary elections for City Council elections. A majority of City Council candidates were women, and more than two-thirds of the candidates were people of color. The average number of candidates in each race was 6.5; by comparison, in 2017 the average number of candidates was 2.6. This seems to be in agreement with arguments by RCV proponents that ranked-choice voting would increase the number of candidates in an election, and increase the ethnic and policy diversity of the candidates.
The ability to use ranked-choice voting was accompanied by a widespread outreach campaign to educate New York City voters on the process. That campaign was spearheaded by the Board of Elections, the Campaign Finance Board and the group DemocracyNYC. The campaign “conducted research in-person, online, via phone and text, mounted an outdoor and multimedia advertising campaign and created multilingual materials to inform voters how to use the ranking system.” Other groups canvassed voters by “knocking on nearly 55,000 doors over all five boroughs.”
The New York mayoral primaries attracted nearly 1 million voters; this marked a 29% increase in the number of voters compared with the 2013 mayoral primary. In polls conducted just before the election, 78% of the voters surveyed said that they understood ranked-choice voting “extremely well” or “very well.” In post-election polls, more than half of the Democratic voters indicated that they had ranked at least three candidates on their ballot; and 95% of the surveyed voters assessed the ranked-choice ballot as simple to complete. The high percentage of voters who felt that the ballot was straightforward was true across all ethnic groups that were surveyed.
However, it should be noted that the winner and current mayor of New York City, Eric Adams, was an outspoken critic of ranked-choice voting. He was also highly critical of the efforts of election officials to educate the public on RCV voting. “Your New York Times readers, your Wall Street Journal readers, and all of those that had the ability to analyze all this information, it’s fine for them. But that’s not the reality when English is a second language, that’s not the reality for 85-, 90-year-old voters who are trying to navigate the process … I knew that was going to be a problem and it turned out to be a problem.” However, Adams did not provide any data to support his criticisms. In an RCV system, voters always have the option of expressing only a first candidate preference if they haven’t managed to “analyze all this information.”
The New York City Council Black, Latino and Asian Caucus opposed ranked-choice voting, and they filed an unsuccessful suit to prevent using RCV in the primaries. The Caucus has since sponsored a bill that would repeal the option of using ranked-choice voting in city elections. They claimed that the use of RCV was a barrier to certain communities, and that “voter education efforts didn’t reach seniors, non-English speakers and people without internet access.” A spokesperson for that coalition claimed that “It is sophisticated voter suppression, but it is voter suppression.” But if it is voter suppression, these critics should explain why the voter turnout for the primary was so high.
Another way to assess ranked-choice voting is to examine whether it agrees with the Condorcet Criterion. This principle states that, if there is one candidate who would defeat every other candidate in a head-to-head election, that candidate should win the election. Such a candidate is then known as a Condorcet Winner. In the 52 primary races in New York City in June 2021, every candidate who was a Condorcet Winner also finished first using the ranked-choice method (the Condorcet winners were estimated from pre-election polls that used head-to-head comparisons). It is particularly interesting because in the 52 NYC primary elections, three candidates were “come-from-behind” winners – that is, they were not leading when only the first-preference ballots were counted and no candidates were yet eliminated, but they won in the final analysis. All 3 of the “come-from-behind” winners were Condorcet Winners.
Advocates of ranked-choice voting argue that having voters rank candidates would be likely to provide an incentive for different candidates to build coalitions. For example, two candidates might suggest that voters who rank them first might rank their fellow candidate second. There was some evidence of this in the NYC Democratic mayoral primary election. Shortly before the election, candidate Andrew Yang endorsed Kathryn Garcia as a second choice. Polls taken before and after the election suggest that this “coalition strategy” may have been effective. Table IV.12 shows the percentage of active ballots transferred to the remaining finalist candidates when Andrew Yang was eliminated from the competition. It compares this with estimates of ballot transfers to the remaining candidates from pre-election polls.
| Ballot transfer in election | Ballot transfer, pre-election polls | |
| Transfer to Adams | 39% | 47% |
| Transfer to Garcia | 45% | 34% |
| Transfer to Wiley | 16% | 18% |
Table IV.12: The percentage of ballots transferred to the other finalist candidates after Andrew Yang was eliminated from the NYC Democratic mayoral primary. The results show a significant shift towards ranking Garcia second on ballots that listed Yang as the first preference.
The results show a significant shift towards naming Garcia as the second choice on ballots that had Yang as the first preference. The fraction of Yang first-preference ballots that were assigned to Garcia increased by 11% over the results suggested in pre-election polling. Although we need much more data to assess whether RCV incentivizes these coalition-building strategies, the New York City mayoral primary votes appear to support this argument. Anecdotal evidence from the results of the Alaska Congressional special election also seem to support this argument. Democratic candidate Mary Peltola openly suggested that voters for Begich or Palin consider her as their second preference, while Begich and Palin focused their campaigns on a strategy attacking their Republican rival.
Ranked-Choice Voting in Australia:
Ranked-choice voting was first introduced in Australia in 1918, in Australian parliamentary elections. Since Australia has had more experience with ranked-choice voting (RCV) than any other country, we will review the Australian system as a means of probing the validity of claims for and against RCV.
Like the U.S., the Australian parliament has two houses, one for representatives and a second for senators. Representatives are chosen for single districts, and there are 151 districts in Australia. Each district has approximately the same number of voters; the number of house representatives for each state, and the boundaries of the electoral districts, are determined by the Australian Electoral Commission. Each elected house representative serves a three-year term. The process of determining electoral districts and boundaries is performed by public servants or by an independent commission, and thus is relatively free from the gerrymandering so common in the U.S. In addition, any party that garners at least 4% of the vote receives public funding from the government.
The Australian Senate has 76 members. Each of the Australian states (New South Wales, Victoria, South Australia, Western Australia, Queensland and Tasmania) has 12 senators, and the Australian Capital Territory and Northern Territory have two senators each. The fact that states and territories have a fixed number of senators, regardless of the relative populations of the states, is a feature that was inspired by the Senate in the United States. The senators from the states serve six-year terms while the senators from the territories serve three-year terms.

Figure IV.3: A map of Australia showing the six states and the two territories (the Northern Territory and the Australian Capital Territory (ACT)). The Australian parliament has a House populated by 151 single-representative districts; while each state has twelve Senators, and each territory has two Senators.
Australians are required to enrol as voters when they reach 18 years of age; they are also required to renew their enrolment if they move to a new address. Australians are also required to vote in parliamentary elections; they are levied a small fine if they do not vote, although this is subject to appeal. Voting for senators is an extremely complex process (each state elects all of their senators using a single ballot, with many stages involved in the vote-counting process), and we will not review this here. Voting for representatives is done by ranked-choice voting. Australians are also supposed to rank every candidate on the House ballot; however, since their citizens cast a secret ballot, there is no way to enforce this. Blank ballots, where a voter does not check any of the boxes for the candidates, are not counted in the RCV system. Figure IV.4 shows a ballot from the Australian 2016 general election in the New South Wales electoral division of Higgins.
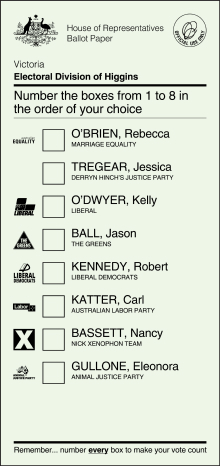
Figure IV.4: A ballot from the 2016 electoral division of Higgins in New South Wales, Australia. There are eight candidates on this ballot, and voters are supposed to number the boxes from 1 to 8 as part of the Australian ranked-choice voting system.
In this electoral district there were 8 candidates representing 8 different parties. The largest political parties in Australia are the Liberals, a party that roughly coincides with the American Republican party, and the Australian Labor Party that is similar to the Democratic party in the U.S.
One form of “protest” in voting is to turn in a blank ballot, which shows no preferences and is not counted. Rather than providing a thoughtful ranking of each candidate, some voters simply number the boxes sequentially from top to bottom; this is a practice called donkey voting. Because of this (and because an Australian senatorial race in 1937 resulted in candidates Amour, Armstrong, Arthur and Ashley winning election), the Australian ballot does not list the candidates in alphabetical order but in a random order.
In the election with ballot shown in Fig. IV.4, the initial vote tally will include the first-preference votes for all eight candidates. If one candidate does not receive a majority of the votes, then the candidate with the lowest number of votes is eliminated, and the second-preference votes for that person are distributed among the remaining candidates. At the end of each round, if one candidate still does not have a majority of the votes, the lowest remaining candidate is eliminated. The process of eliminating candidates and re-apportioning the lower-preference votes continues until it reaches a round where one candidate obtains a majority of the remaining ballots.
Since they have had ranked-choice voting for over a century, Australian voters are quite knowledgeable about this system. One criticism of RCV in the U.S. is that it is a scheme devised by liberals to increase their chances at winning elections. This was certainly not the case in Australia; in fact, the original impetus for ranked-choice voting in Australia came when a third party (a Country Party representing mainly agricultural interests) siphoned votes away from the (conservative) Liberal Party, leaving the opposition party with a plurality (but not a majority) of the vote. So both parties in Australia believe that they can use this system for their own advantage.
American advocates for RCV claim that this system will provide an incentive for smaller parties to run in elections, and that this will provide more opportunities for women and minorities. In the current Australian parliament, 39% are women. This can be compared with 27.9% of the members of the U.S. House of Representatives. The existence of ranked-choice voting has certainly proved a boon for Australian women and also for small parties. Voters in Australia feel free to give a first preference to a candidate who will almost certainly not win the election, but who might represent a cause that they support (e.g., the Animal Justice Party in Fig. IV.4). That voter can be confident that their second preference for a larger established party will play a role in the eventual decision of a winner. In the U.S., think about what impact RCV in the state of Florida might have had on the Presidential election in 2000. Ralph Nader, who was certain not to win the state, nonetheless received over 97,000 votes in an election where a 537-vote lead in Florida swung the Presidency to George W. Bush, rather than to Al Gore. Some of those Nader voters might have greatly appreciated the opportunity to express second preferences that might have been essential in swinging the electoral outcome.
RCV advocates also claim that this system will encourage cooperation between candidates representing different parties. One party can encourage their voters to rank a candidate from an affiliated party as a second preference. In addition, advocates of RCV suggest that the ranked-choice system might decrease the amount of negative campaigning and attack ads. The argument is that by attacking their opponents they risk antagonizing those opponents’ supporters. Those voters might give a very low ranking to a candidate who relies on attack ads in a campaign. One notable feature of the Australian RCV system is the strong cooperation between large and small parties. For example, for many years Australia’s Liberal Party has formed an alliance with the Liberal Democrat party. In fact, in some states those two parties have formally merged. On Australian election days, campaign supporters hand out extremely detailed fliers urging voters to rank their candidate first, but the fliers also make detailed recommendations for how voters should give their second-preference votes to candidates from affiliated parties.
Groups that advocate for ranked-choice voting in the U.S. often refer to RCV in the Australian system to back up their claims. The success of RCV in Australia provides a significant incentive to press for similar voting methods in the U.S. However, it is not entirely clear to what extent Australian outcomes would be replicated in American elections. The two-party system is deeply entrenched in American politics, and up to this point American third parties have found it difficult to secure much lasting support. While Australian political parties can qualify for federal support, American elections rely on massive amounts of dark money to fund their extremely expensive political campaigns. Recently, “attack ads” funded by supposedly independent organizations have become more and more common in American politics. On the other hand, major party candidates in the U.S. have often encouraged third-party candidates whom they guessed would siphon votes away from their major party opponent.
In summary, the results of the Alaska special Congressional Election in August 2022, the New York City Democratic Mayoral primary in June 2021, and a century of parliamentary voting in Australia all appear to support arguments by advocates of ranked-choice voting. In both U.S. cases, the turnout of voters was quite high. A large majority of the electors stated that their understanding of ranked-choice voting was very high and that the ballot was rather easy to negotiate. In New York City, 87% of the Democratic voters (with only two candidates in the mayoral primary, Republicans did not use RCV) ranked more than one candidate and 46% ranked the maximum allowable number of 5 candidates. Most voters who voted for only one candidate stated that they liked only that candidate, rather than stating that they did not understand how the ranked-choice system worked.
The New York City Democratic primaries attracted a large and ethnically diverse field of candidates, and 73% of candidates in both the New York mayoral and City Council primaries were women. In the NYC mayoral race, candidate Andrew Yang suggested that his voters rank Kathryn Garcia as their second preference, and many voters appeared to follow his suggestion. All of this evidence appears to support the arguments of RCV advocates and refute the criticisms of opponents of RCV.
However, this is limited and fragmentary evidence; one needs far more data to determine whether RCV lives up to its promises. The City of New York Campaign Finance Board has published a 178-page report on an analysis of voting and voters during the 2021-2022 period. It is essential that this type of data be available for all municipalities that are participating in RCV voting. There are several potential barriers to expanding the range of ranked-choice voting in the U.S. One of these is political: two states (Florida and Tennessee) have already passed state laws prohibiting the use of ranked-choice voting in elections in that state. Florida governor Ron DeSantis is widely expected to announce his candidacy for president on the 2024 Republican ticket. It is possible that opposition to RCV will become a requirement for Republican office-seekers.
A second possible threat is successful legal challenges to RCV voting. As we mentioned, the Black, Latino and Asian Caucus in the New York City Council sponsored a bill in the New York city legislature that would prohibit the use of RCV in city elections. Another potential legal challenge could be from Americans with disabilities, who could argue that RCV is sufficiently abstruse that elder Americans are unable to understand how this system works. Another challenge for RCV would be that it fails to produce the improvements touted by its proponents, although it might require an RCV system to be in place for at least several elections before those improvements are realized, as voters and candidates learn how to take maximal advantage of the system. A final possibility is that RCV is seen to be a major contributor to a bitterly contested election. For example, if a candidate ranked fourth or lower in the first round of a multi-candidate RCV election ends up being the winner, it may lead to complaints that ranked-choice voting produces “unfair” or “rigged” results. Of course, claims that even the traditional first-past-the-post voting is “rigged” are proliferating in the U.S. in the wake of Donald Trump’s use of this trope to try to stay in office.
For the moment, however, ranked-choice voting appears to have a number of desirable features. Over time, Americans might get used to this system and value its advantages over the traditional system where a winner needs approval from only a plurality of the votes cast, or over an expensive runoff system that disadvantages a large swath of the voting public. When used in a general election, following a non-partisan primary election that passes the top four or five vote-getters to the general, RCV has the potential to disfavor extreme candidates who succeed in the present system by attracting a plurality of votes among the small and unrepresentative minority of eligible voters typically participating in closed, partisan primaries.
States such as Maine and Alaska, which have been the most prominent states that use RCV, have a tradition of independent voters and candidates. It would seem evident that it will require strong independent citizen movements to persuade the Democratic and Republican parties to adopt ranked-choice voting. If RCV is to succeed in the U.S., it is most likely to be first implemented in local and municipal elections, and then gradually to work its way up to state and national elections.
V. Primary Election Systems:
Elections in the United States generally involve at least a two-step process. State and federal general elections are held in November, and are usually preceded by a primary election, where the candidates who run in the general election are selected. The primary election is a relatively recent addition to American democracy. Through the end of the 19th century, party nominations for the general election were generally hand-picked by the leaders of a state’s party. This was a system that was prone to corruption; for example, Boss Tweed, the powerful head of New York’s Tammany Hall political machine (see Figure V.1), is quoted as saying, “I don’t care who does the electing, so long as I get to do the nominating.”
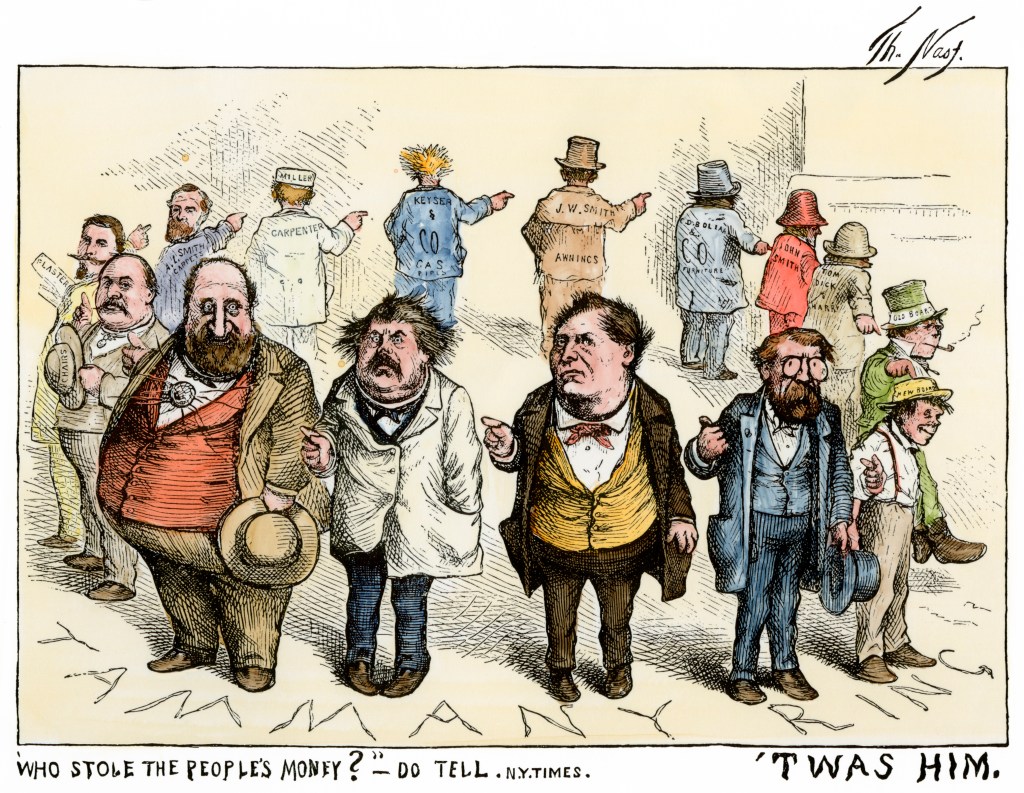
Figure V.1: A caricature by Thomas Nast of New York’s Tammany Hall political machine. The picture is titled “Who Stole the People’s Money? ‘Twas him.” It depicts a circle of Tammany Hall politicians, with their head William “Boss” Tweed, the bearded man in front left. Each politician is pointing his finger at the gentleman to his right.
A major thrust of the Progressive movement in the U.S. was to reform the way elections were conducted, and to remove power from the often corrupt party organizations. Choosing candidates for the general election through a primary where eligible voters were able to cast a ballot for their favorite candidate was seen as a powerful step in minimizing the influence of party machines. The first primary election was held in Wisconsin in 1904, and primaries then spread rapidly throughout the country.
The direct election of representatives by the people was certainly a step forward from nomination by party machines. However, it is clear that problems still exist with our current system of primaries and general elections. A notable feature of American elections is that a lamentably small fraction of eligible voters actually show up to vote. Figure V.2 shows the percentage of eligible voters in various developed countries who participated in national elections in the mid-2010s. The highest percentage of voters was 87.2% in Belgium. The lowest percentage of eligible voters was 38.6% in Switzerland. At 53.6%, the U.S. was ahead of only Japan and Switzerland in voter turnout; furthermore, the U.S. was miles behind the top four countries for voter turnout (Belgium, Turkey, Sweden and South Korea), all of whom recorded voter turnouts greater than 80%.

Figure V.2: The percentage of the eligible voting age population who voted in a national election in the mid-2010s for 15 developed nations. Voter participation rates range from a high of 87.2% to a low of 38.6%. The U.S. percentage of voters in the 2016 election was higher than only two other countries, Japan and Switzerland.
For many years, the percentage of voter turnout has been greatest for the oldest Americans and least for younger Americans. Figure V.3 shows the distribution of the U.S. citizen population in various age groups, and the percentage of voters from that age group. In 2020, 23% of the population was over 65, and that group produced 26% of American voters; 48% of the population was in the 35-64 year age group and they produced 50% of the voters; while 29% of the population was 18-34 years old, and they produced 24% of the voters.

Figure V.3: The age distribution of the American population 18 and over, and the percentage of voters from that age group, in the 2016 and 2020 federal elections. In 2016, 21% of the population was over 65, and that group produced 24% of American voters; 50% of the population was in the 35-64 year age group and they produced 53% of the voters; while 29% of the population was 18-34 years old, and they produced 23% of the voters. The results were qualitatively quite similar in 2020.
The percentage of Americans who vote in elections is substantially higher in years with a Presidential election than in midterm elections. Figure V.4 shows the percentage of Americans who report that they voted in elections from 1964 to 2018. The red curves show voter participation for whites, while the blue curves show the percentage of Black voters. First, one sees a steady increase over time in the fraction of Black voters relative to white voters. In fact, in the 2008 and 2012 Presidential elections with Barack Obama as the Democratic candidate, the fraction of Black voters actually exceeded that of white voters. However, there was a significant drop in Black voters in the 2016 Presidential election; this played a critical role in the victory of Donald Trump over Hillary Clinton. Another striking feature of Fig. V.4 is that voter participation in midterm elections is significantly lower than in Presidential elections. The decrease is as great as 15% in some years.
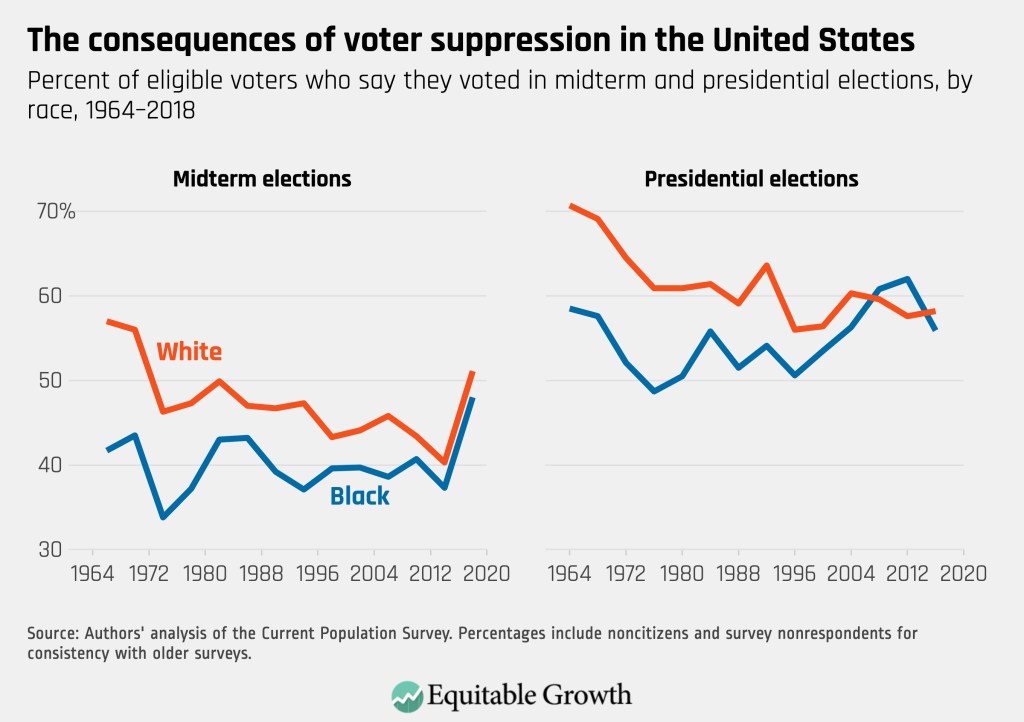
Figure V.4: The percentage of eligible voters who report voting in midterm and Presidential elections, by race, between 1964 and 2018. In the 1960s and 1970s, the percentage of Black voters was far behind that of white voters; the difference in participation by race decreases slowly but steadily until the present. In the 2008 and 2012 Presidential elections, voter participation by Blacks actually exceeds that of whites. A significantly smaller proportion of eligible voters participates in midterm elections.
The fraction of Americans who vote in general elections is depressingly small. However, the fraction of Americans who vote in primary elections is much smaller. Figure V.5 shows the percentage of eligible voters who voted in Democratic and Republican primaries between 1966 and 2010. Over this period, the percentage of Democratic voters in primaries decreased monotonically from over 20% to under 10%. The fraction of Republican voters who participated in primary elections remained relatively constant at under 10%, until 2010 when it jumped to about 11%, and for the first time was greater than the percentage of Democratic voters participating in primaries.
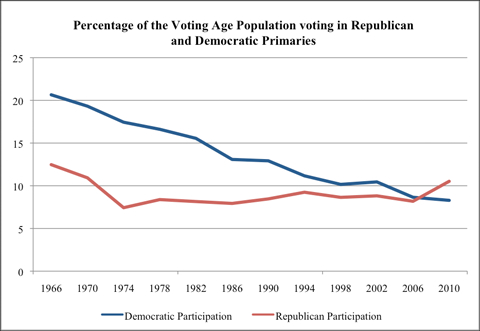
Figure V.5: The fraction of eligible voters who voted in primary elections during the period 1966 – 2010. The blue curve is the fraction of Democratic voters who participated, while the red curve is the fraction of Republican voters. The fraction of Democratic voters participating in primary elections declined monotonically from 1966 where participation was over 20% to 2010 when Democratic participation was less than 10%. The fraction of Republican voters remained relatively constant under 10% from 1974 until 2008. In 2010, the fraction of Republican voters who participated in primary elections jumped to 11%.
The very low voter participation in primary elections leads directly to the election of representatives whose views can diverge widely from those of the average voter in their district. In a primary election where only a few percent of eligible voters cast a ballot, those who vote are likely to have the strongest motivation, and this often correlates with extreme partisan positions held by those voters. If this is true for both parties, then the Republican and Democratic candidates in the general election may represent ideological positions that are well to the right and left, respectively, of the voters in their district. Kousser et al. have conducted research that demonstrates significant differences between the ideological positions of winners of Congressional elections in California in 2010 and 2012, and the ideological spectrum of the voters in California. Figure V.6 shows the ideological spectrum for those who were elected to the U.S. House of Representatives from California in those two elections.
The top two curves in Fig. V.6 show the spectrum of ideological positions of the successful California Congressional candidates, in 2010 and 2012 respectively. The ideological positions were deduced from candidate responses to a set of 46 questions asked of the candidates by the group Vote Smart. For those candidates who did not respond to these questions, their positions were estimated on the basis of information from their campaigns. Negative values (the left side of the graph) roughly correspond to liberal positions while positive values (those on the right side of the graph) correspond to conservative positions. The ideological spectrum of winning Democratic candidates was given by the left distribution, while the spectrum of the Republican lawmakers was the right distribution. Note that there is almost no overlap on issues between the Democratic and Republican winners.
Kousser et al. asked the same policy issue questions of a random sample of 1000 California voters. The ideological spectrum of the voters is shown in the bottom part of Fig. V.6. The spectrum of self-identified Democratic voters is the left distribution, that for independents is the center distribution, and the spectrum for Republican voters is the distribution on the right. Note that there is significant overlap around the zero point (ideologically neutral) for Democratic and Republican voters, and that the ideological spectrum of Democratic voters is considerably more moderate than that of the Democratic members of Congress; the same is true of Republican voters relative to their Congressional representatives. Furthermore, the ideological spectrum of Democratic voters in California is substantially broader than that of Democratic representatives. The spectrum of issues for California Democratic voters contains some elements of conservative positions, and the spectrum of Republican policy preferences overlaps with some liberal positions. However, the spectrum of Democratic (Republican) Congresspersons contains almost zero overlap with conservative (liberal) ideology. The ideological spectrum for independent California voters is centered around the neutral point on issues; although in 2012 29.6% of California voters identified as independent, the ideologies of their Congressional representatives were significantly more polarized than that of independent voters (and no independent Congresspersons were elected from California in 2010 and 2012).

Figure V.6: The ideological spectrum of members of the U.S. House of Representatives from California in 2010 (top) and 2012 (middle). The positions of House representatives were obtained by evaluating the responses to a set of 46 policy questions that were asked of California House candidates. The authors of the study by Kousser et al. asked a random sample of California voters the same questions. The top two figures show the ideological positions of the winners of the U.S. House of Representatives elections in 2010 (top) and 2012 (middle) elections. Negative scores on the left side of the graph represent generally liberal positions (and the left distribution gives the ideological spectrum for the Democratic winners) while positive scores on the right represent conservative positions (and the right distribution shows the ideological spectrum of the Republican winners). The bottom graph shows the ideological spectrum of California voters who identified as Democrats (left), independents (center) and Republicans (right).
There are several different types of primaries that are used in the U.S. Here we will discuss the various types and list the states using that particular type of primary.
The first type is called a “closed primary.” In a closed primary system, in order to vote in a primary (e.g., the Republican primary), you have to be enrolled as a member of the Republican party. When you register to vote, you declare your party affiliation. If you change party affiliation, you must declare this in order to vote in the primary for your new party.
Advocates for closed primaries claim that it contributes to the production of strong parties. However, closed primaries disenfranchise independent and unaffiliated voters by preventing them from voting in any primary in that state. They also prevent voters affiliated with another party from “crossing over” to vote in the primary of a rival party. Indeed, there are occasions in states with open primaries when members of one party will vote in the primary of another party. In some cases this is because they strongly prefer one candidate to another; however, in other cases Democrats may cross over to vote in Republican primaries (or vice versa) with the intent of sabotaging the election by helping a weaker candidate for the opposition party win the primary.
States with closed primaries are Delaware, Florida, Kentucky, Maryland, Nevada, New Mexico, New York, Oregon and Pennsylvania. In some states, one must declare their party affiliation months before the primary date. However, in other states one can declare a party affiliation either days before the primary, or even when appearing to vote at the primary.
A second type of primary is called a “semi-closed” or “partially closed” primary. In this type of system, voters who are registered with one party are forbidden to vote in the primary of a rival party. However, before each election cycle the state allows political parties to choose whether or not they will allow unaffiliated voters to participate in their primaries. This may allow unaffiliated voters to vote in the primary for a particular party. However, note that these systems may be confusing to independent voters, who may find it difficult to ascertain whether they will be allowed to vote in a particular primary. The following states have partially closed primaries: Connecticut; Idaho; North Carolina; Oklahoma; South Dakota; and Utah.
A third type of primary is called a “partially open” primary system. When they show up to vote, individuals are asked for their party affiliation. In this case, unaffiliated voters can choose which party primary to vote in, and voters can also cross over and vote in the primary for a rival party by declaring themselves to be affiliated with that party. States with “partially open” primaries are Illinois, Indiana, Iowa, Ohio, Tennessee and Wyoming.
A variation on the “partially open” primary is a primary that is open to voters who are unaffiliated with a particular party. Those unaffiliated voters are allowed to participate in any primary that they choose. However, voters that are registered with one particular party are forbidden from crossing over to vote in another party’s primary. States with primaries that are open to unaffiliated voters include Arizona, Colorado, Kansas, Maine, Massachusetts, New Hampshire, New Jersey, Rhode Island and West Virginia.
One additional type of primary is the “open” primary. In such states, voters are not asked to choose a party affiliation when they register to vote. When they show up to vote in a primary election, the voter requests a ballot for the party of her choice. Unlike the case in states with “partially open” primaries, a voter’s choice for a particular party ballot is not public information, and the voter is not automatically registered for the party whose ballot they choose. In open primaries, a voter may cross party lines to vote in a primary. Supporters of this system point to the fact that the voter’s party choice is kept private; also, the voter has the ability to vote in whatever (single) primary they choose. Critics of open primaries claim that such a system weakens the power of individual parties to choose their candidates; they also argue that open primaries allow supporters of an opposition party to “sabotage” primary elections, in the hope of nominating weak candidates who will lose to a stronger candidate from their own party. The following states have open primaries: Alabama; Arkansas; Georgia; Hawaii; Michigan; Minnesota; Mississippi; Missouri; Montana; North Dakota; South Carolina; Texas; Vermont; Virginia and Wisconsin.
In the case of elections for members of Congress, all of the above-mentioned primary systems nominate a single winner with the largest vote share as the candidate for that party in the ensuing general election. Interest in reform of the primary system centers around several main points. The first is an effort to dramatically increase the percentage of voters who participate in primary elections. A second effort is to increase the ideological diversity of candidates in primary elections, and to make it easier for candidates from third parties to compete in the primaries. A third goal is to create a primary system that provides incentives for candidates from different parties to collaborate with each other, rather than to focus on “attack ads” that demonize opposition groups. A relatively new mechanism that attempts to achieve at least some of these goals is the “nonpartisan blanket primary.” Next, we will outline how the nonpartisan blanket primary works. We will give some examples of blanket primaries in operation, and we will assess whether this type of primary is achieving the goals outlined by its advocates.
Nonpartisan Blanket Primaries:
A nonpartisan blanket primary is one where a single primary election includes all candidates from every party, including third parties. Such a primary is also called an “open primary” (although this term invites confusion with the “open primary” that we discussed earlier in this section), or the pejorative term “jungle primary.” In the nonpartisan blanket primary, all candidates for a given office enter into a single primary. All voters can participate in this primary without having to reveal their party affiliation. Advocates for blanket primaries claim that having a single primary will invite independent voters who might otherwise be barred from voting in a closed primary, or who might not want to declare a party affiliation in order to vote in a partially open primary.
With a potentially large number of candidates in a blanket primary, opponents of such primaries argue that voters could be confused by a slate containing many candidates. Initially, candidates in blanket primaries were allowed to self-identify their party affiliation. However, the Republican and Democratic parties argued that this was potentially misleading, since voters might mistakenly assume that a candidate who identified as a “Republican” would be endorsed by that party. In 2000, the U.S. Supreme Court ruled in California Democratic Party vs. Jones that blanket primaries “were unconstitutional as they forced political parties to associate with candidates they did not endorse.” However, in 2008 the Supreme Court ruled in Washington State Grange vs. Washington State Republican Party that the Washington state nonpartisan blanket primary system was constitutional. In the Washington blanket primaries, candidates are allowed to state their “party preference.” The ballots “feature disclaimers that a candidate’s preference does not imply that the candidate is nominated or endorsed by the party or that the party approves of or associates with the candidate.”
An important element of blanket primaries is the number of candidates who advance to the general election. Some states have adopted a “top two” system. In this instance, the two candidates who receive the most votes in the primary advance to the general election. This raises the possibility that both candidates will be members of the same party. For this reason, a “top two” blanket primary is viewed with apprehension by both Republican and Democratic parties. We will give some examples of top-two systems in action.
The states of California and Washington have adopted top-two nonpartisan blanket primaries for all offices except U.S. President (in theory, voters for President are casting ballots for a slate of electors, and not an individual candidate). More recently some jurisdictions, particularly in Alaska and Maine, are adopting nonpartisan blanket primaries that combine with ranked-choice voting. In those cases, more than two candidates may be advanced to the general election. And in the general election, the winner is determined by ranked-choice voting, offering the potential advantages discussed in the preceding section. A non-partisan group called Unite America advocates for a combined series of electoral reforms. This group points to the disconnect between the fact that only 20% of Americans have a highly favorable opinion about the U.S. Congress, while 90% of Congressional incumbents win re-election every two years. Unite America advocates for electoral reform through the adoption of four correlated measures:
- The setting of electoral district lines by a nonpartisan commission;
- Nonpartisan blanket primaries;
- Candidates with the top four number of votes in the blanket primary advance to the general election with ranked-choice voting; and
- All voters are allowed the opportunity to cast their ballot by mail.
What has been the experience to date of states which have recently adopted nonpartisan blanket primaries? In California, which has a “top two” blanket primary, there have been several instances where both of the top two candidates in the primary were from the same party. In 2012, the first year that California used the nonpartisan blanket primary system, there were eight Congressional districts with two final candidates from the same party in the general election {six with two Democrats and two with two Republicans). In 2014, there were also six Congressional races with two Democratic candidates and two with both Republicans (although these were not the same districts as in 2012). And in 2016, the U.S. Senate race in California had two Democrats running against each other, and seven Congressional districts with two Democrats in the general election. It had been suggested that turnout in the general election might be greatly diminished if two candidates from the same party were running against one another, but so far this seems not to be the case.
We note that “top two” nonpartisan primary systems have a potential weakness. Consider a state that has a nonpartisan primary system where the top two candidates advance to the general election. Now consider a situation with five primary candidates each of whom has roughly equal support. For the sake of argument we assume that candidates A and B identify as Republicans and candidates C, D and E as Democrats. We can then imagine a situation as shown in Table V.1
| Candidate | Party Preference | Vote % | Rank |
| A | Republican | 21.1% | 1 |
| B | Republican | 20.9% | 2 |
| C | Democratic | 20% | 3 |
| D | Democratic | 19.1% | 4 |
| E | Democratic | 18.9% | 5 |
Table V.1: A hypothetical situation involving a nonpartisan blanket primary using a “top two” system, where the top two candidates advance to the general election. This primary has five candidates with roughly equal support, where two identify as Republican and three as Democrats. Although the Democrats receive 58% of the vote, because they split the Democratic votes the top two who advance to the general election are both Republicans.
The candidates essentially divide up the vote equally. However, because there are fewer candidates who identify as Republicans, they both advance to the general election despite the fact that the Democrats collectively received 58% of the votes. It is easy to see that a similar advantage could go to whichever party has fewer candidates in the primary. To see that Table V.1 is realistic, in Table V.2 we show the results of the 2016 nonpartisan primary for state treasurer in Washington state.
| Candidate | Party Pref. | Vote (%) | Rank |
| D. Davidson | Republican | 322,374 (25.09%) | 1 |
| M. Waite | Republican | 299,766 (23.33%) | 2 |
| M. Liias | Democratic | 261,633 (20.36%) | 3 |
| J.P. Comerford | Democratic | 230,904 (17.97%) | 4 |
| A. Fisken | Democratic | 170,117 (13.24%) | 5 |
Table V.2: Results from the 2016 primary for state treasurer in Washington. The top two candidates advanced to the general election. Despite the fact that the three Democratic candidates cumulatively received 51.6% of the vote, because the votes were split among them, the two Republicans advanced to face each other in the general election.
There were two Republicans and three Democrats entered in the state treasurer primary. Although the Democratic candidates together received a majority 51.6% of the vote, the two Republicans ended up garnering the top two slots. As a general rule, in a top-two primary a minority party can end up with the top two individual vote tallies if the minority party has fewer candidates than the majority party. This can become a reality if the majority party candidates split the votes roughly equally.
There are also examples where candidates can scheme to game the system in a top-two primary situation. One example is the so-called “Moxie Media scandal” in the 2010 Washington state Senatorial primary in the 38th district. The three candidates were Democrat and incumbent Jean Berkey, Democrat Nick Harper and Conservative Rod Rieger. The district was heavily Democratic, and Berkey had a reputation as a moderate. However, a little-known political consulting firm called Moxie Media obtained $300,000 in undeclared funds from supporters of Nick Harper. Moxie Media used these funds to create a series of shell PACs with names like “Cut Taxes PAC” and “Conservative PAC.” These “organizations” launched direct-mail attacks on Jean Berkey, claiming that she was a radical leftist and urging the public to vote for candidate Rieger. The primary results are shown in Table V.3.
| Candidate | Party Preference | Vote (%) | Rank |
| Nick Harper | Democratic | 7,193 (35.09%) | 1 |
| Rod Rieger | Conservative | 6,713 (32.75%) | 2 |
| Jean Berkey | Democratic | 6,591 (32.16%) | 3 |
Table V.3: Results in the 2010 blanket primary for Washington state Senate in the 38th District. Moderate Democrat and incumbent Jean Berkey finished third to Democrat Nick Harper and Conservative Rod Rieger. Ms. Berkey trailed Rieger by only 122 votes, and it was revealed that the political consulting firm Moxie Media had created shell PACs that smeared Berkey as a radical leftist and urged voters to support Rieger.
It was revealed that Moxie Media, with financial backing from supporters of Harper, had launched these attacks on Berkey through fake PACs. Although both Berkey and the state Attorney General recommended that the vote be invalidated, Harper swore that he had no knowledge of the work of Moxie Media. Harper easily defeated Rieger in the general election.
Advocates for nonpartisan blanket primaries claim that primaries open to all candidates from all parties will increase the rate of voter participation in primary elections. Unite America claims that the states of California and Washington, that have adopted top-two blanket primaries, had voter participation rates in primaries of 34% and 45%, respectively. These rates were claimed to be much higher than the average turnout rates of 25% or lower in partisan primaries in other states. However, Hill and Kousser studied California’s top-two primary system. They concluded that the turnout of voters who were registered with third parties or who expressed no party preference actually declined in the primaries.
Another claim by advocates of blanket primaries was that these open primaries would attract many independent and centrist voters who generally did not participate in closed partisan primaries. This would generate pressure on candidates to moderate their position on issues in order to attract these voters. Political scientist Christian Grose examined the voting records of California Congresspersons from 2003 to 2018. Grose found that newly-elected members of Congress “elected in top-two primaries are more than 18 percentage points less extreme than those elected in closed primaries.” On the other hand, Kousser et al. found essentially no difference in the ideological spectrum of California Congresspersons elected in 2010 (the last year before California adopted the top-two primary system) and 2012. This is shown by comparing the ideological spectrum of Congresspersons in 2010 (top graph in Fig. V.6) with the spectrum of Congresspersons in 2012.
It is quite possible that top-4 or top-5 nonpartisan blanket primaries with ranked-choice general election voting will come closer to achieving the objectives hoped for, with higher voter turnout and elected candidates better representing the broad ideological spectrum of the entire voting population in a state. So far in the U.S. we have only the recent experience from Maine and Alaska. Both the House of Representatives and Senate elections in Alaska in 2022 have indeed chosen moderate over more extreme candidates, a Democrat for the sole House seat and a Republican for the Senate. In Maine’s 2nd Congressional swing district, ranked-choice voting has reelected Democratic Congressman Jared Golden, who was first chosen over three challengers in a close ranked-choice election in 2018 and has been scored as “one of the most centrist members of the House of Representatives.” A 2022 ballot referendum in Nevada won majority support for amending the state constitution to establish top-5 nonpartisan primaries with ranked-choice general elections for all state and federal elections other than for U.S. President. The same referendum will have to again win majority support in the 2024 election in order to amend the constitution in time to affect the 2026 elections in Nevada. The results to date are thus encouraging, though clearly more extensive experience with these types of elections will be needed for a more informed judgement on their ability to meet the proponents’ objectives.
Since nonpartisan blanket primaries have only been instituted in a few states for a few years, we clearly need more time and more research studies to see if the benefits touted by advocates for these primaries actually materialize. This is the conclusion of a 2014 review of blanket primaries by Podkul and Kamarck. In the meantime, proposals for blanket primaries are appearing in more states. As these primaries are often opposed by both Republican and Democratic party organizations, they will generally be adopted by local governments and then work their way up the ladder to higher offices, or they will be adopted through ballot proposals approved by the citizens of the state.
VI. Summary
U.S. history illustrates a conundrum for long-lasting democracies. It is to be expected that those seeking power in a democracy will gradually find ways to exploit flaws, loopholes, and quirks in electoral systems in order to guarantee their own success. When they do succeed and take charge of law-making, they have little incentive to repair those flaws, loopholes, and quirks. It is thus left to citizens in a democracy to instigate and adopt changes to electoral policies that can restore the responsiveness of elections to the prevailing preferences among all voters. In this post we have considered three aspects of U.S. electoral systems that can, in principle, be reformed in state after state without the need for amendments to the U.S. Constitution: the redistricting process after decennial censuses; the nature of primary elections to select nominees; and the method of counting votes in elections. One goal of such reforms should be to counteract the ongoing trend toward increasing partisan polarization and dysfunction in the U.S. Congress, whose actions are no longer necessarily representative of the citizenry at large.
Partisan redistricting has allowed politicians to effectively choose their own voters, has steadily decreased the fraction of Congressional districts that can be considered competitive between the two major parties, and has reduced the selection of winners in the vast majority of districts to the preferences of a small and unrepresentative percentage of eligible voters who choose to participate in primary elections. A number of states have by now adopted allegedly independent, bipartisan redistricting commissions to create new district maps after each census. But since these commissions typically involve significant representation from each of the two major parties, and neither party has a strong incentive to change the status quo, bipartisan commissions are unlikely to undo gerrymandering without more explicit citizen-adopted guidelines for district maps based on nonpartisan, algorithmic considerations of fairness and responsiveness to voters. We have considered several such algorithmic approaches to redistricting, and we have suggested a guideline that can limit the “cracking and packing” of voters into districts that is responsible for today’s most extreme gerrymandering.
Extreme candidates who may be chosen by a slim majority of strongly partisan voters in a low-turnout primary election may still be disfavored in general elections, even in safely Republican or Democratic districts or states, with reforms to the nature of primaries and the counting of votes. The single-party, plurality-winner-take-all primary elections currently in use in most states are highly susceptible to the selection of extreme candidates who are not invested in representing the entire population of their districts or states. Such primary elections also often disenfranchise large fractions of the voting public. In this post we have considered the alternative of nonpartisan blanket primaries, where candidates of both major parties and independent parties as well can compete for votes among all segments of the eligible voting public. When several top vote-getters from such primaries are passed along to the general election, where voters can rank their choices among the several candidates, it seems likely that extreme candidates unable to appeal to a wide spectrum of voters will be disfavored. Furthermore, such ranked-choice voting leads naturally to elected candidates with more than 50% of cast votes (though not necessarily of first preferences), without the need to ask voters to participate in yet a third, runoff election.
In keeping with our emphasis on science and quantitative research on this blog site, we have presented available data to evaluate the several electoral reforms we have considered. In the case of nonpartisan blanket primary elections and ranked-choice voting in subsequent general elections, the data are so far sparse, but encouraging. A number of U.S. localities have so far adopted such approaches, but only two states have to date used them in federal elections: Alaska and Maine. Voters in Nevada have recently chosen by state referendum to amend their state constitution to adopt nonpartisan blanket primaries and ranked-choice voting, but they will have to vote again for this amendment in 2024, before the changes could take effect in the 2026 election. The states thus adopting or considering such reforms include one considered safely Republican in Presidential elections (Alaska, though where ranked-choice 2022 voting has selected a Democratic U.S. Representative), one considered primarily Democratic (Maine, though with one Republican Senator and a strong independent streak), and one considered a Presidential swing state (Nevada). The efforts in these states thus demonstrate that voters of all partisan preferences can successfully push for serious statewide electoral reforms when they become convinced that such reforms can make American democracy more responsive to the broad spectrum of citizen’s preferences.
The reforms we have evaluated hold considerable promise for making American democracy more representative. But to realize that promise citizens must turn out to vote, and to do so in larger numbers than have traditionally characterized U.S. elections. Other reforms we have not considered here, such as Election Day holidays and more widely adopted mail-in balloting, can help to increase voter turnout. The past six years have demonstrated vividly that maintaining democratic institutions in this country is quite vulnerable. We hope that citizens have gotten the message that it is time for them to determine priorities among their elected representatives, rather than the reverse flow of priorities characteristic of ultimately self-destructive political tribalism.
Source Material for Electoral Reform Posts:
A.I. Abramowitz, Redistricting and Competition in Congressional Elections, Sabato’s Crystal Ball, Feb. 24, 2022, https://centerforpolitics.org/crystalball/articles/redistricting-and-competition-in-congressional-elections/
Partisan Primaries Disenfranchise Voters, https://www.uniteamerica.org/sections/partisan-primaries-disenfranchise-voters
Partisan Primaries Distort Representation and Fuel Dysfunction, https://www.uniteamerica.org/sections/partisan-primaries-distort-representation-and-fuel-dysfunction
J. Martin, Liz Cheney is Defeated by Trump-Backed Harriet Hageman in Wyoming, New York Times, Aug. 16, 2022, https://www.nytimes.com/2022/08/16/us/politics/harriet-hageman-liz-cheney-wyoming.html
M. Lillis, Poll: 92 Percent of Gun Owners Support Universal Background Checks, The Hill, July 3, 2014, https://thehill.com/blogs/blog-briefing-room/news/211321-poll-most-gun-owners-support-universal-background-checks/
S. Singhi, PORES Survey Finds Broad Bipartisan Support for Abortion Exemptions in the U.S., The Daily Pennsylvanian, Oct. 24, 2022, https://www.thedp.com/article/2022/10/bipartisan-pores-survey-abortion-support
E. Pilkington, ‘US Democracy Will Not Survive for Long’: How January 6 Hearings Plot a Roadmap to Autocracy, The Guardian, July 24, 2022, https://www.theguardian.com/us-news/2022/jul/23/january-6-hearings-us-democracy-roadmap-autocracy
Redistricting Reform Act of 2021, https://www.congress.gov/bill/117th-congress/senate-bill/2670
L. Drutman, What We Lose When We Lose Competitive Congressional Districts, FiveThirtyEight, June 23, 2022, https://fivethirtyeight.com/features/what-we-lose-when-we-lose-competitive-congressional-districts/
D. Wasserman and A. Flinn, Introducing the 2021 Cook Political Report Partisan Voter Index, The Cook Political Report, April 15, 2021, https://www.cookpolitical.com/cook-pvi/introducing-2021-cook-political-report-partisan-voter-index
https://en.wikipedia.org/wiki/Three-fifths_Compromise
https://en.wikipedia.org/wiki/Proportional_representation
History of Creating Congressional Districts, http://archive.fairvote.org/?page=1724
https://en.wikipedia.org/wiki/Voting_Rights_Act_of_1965
Redistricting and the Supreme Court: The Most Significant Cases, https://www.ncsl.org/research/redistricting/redistricting-and-the-supreme-court-the-most-significant-cases.aspx
https://en.wikipedia.org/wiki/Shelby_County_v._Holder
M. Li and Y. Rudensky, How the Supreme Court’s New Gerrymandering Case Threatens the Voting Rights Act, Brennan Center for Justice, Sept. 29, 2022, https://www.brennancenter.org/our-work/research-reports/how-supreme-courts-new-gerrymandering-case-threatens-voting-rights-act
Redistricting in the Courts, https://www.brennancenter.org/issues/gerrymandering-fair-representation/redistricting/redistricting-courts
E. Sweren-Becker and E. Herenstein, Moore v. Harper, Explained, Brennan Center for Justice, Aug. 4, 2022, https://www.brennancenter.org/our-work/research-reports/moore-v-harper-explained
https://en.wikipedia.org/wiki/Gerrymandering
C. Cillizza, Here Are the Most Obscenely Gerrymandered Congressional Districts in America, CNN, Oct. 4, 2017, https://edition.cnn.com/2017/10/03/politics/redistricting-supreme-court-gerrymandered/index.html
Gerrymandering: Rigging Elections by Stacking the Map, https://reclaimtheamericandream.org/brief-gerrymander/
A. Tausanovitch, Voter-Determined Districts, Center for American Progress, May 9, 2019, https://www.americanprogress.org/article/voter-determined-districts/
National Democratic Redistricting Committee, https://democraticredistricting.com/
J.C. Mattingly, Can You Hear the Will of the People in the Vote? Assessing Fairness in Redistricting via Monte Carlo Sampling, https://www.youtube.com/watch?v=aMFJZ7RF0cU
E. Rosenbaum, Redistricting Reform’s Dead End, Washington Post, Oct. 29, 2005, https://www.rangevoting.org/RosenbEd.html
M. Li and C. Leaverton, Gerrymandering Competitive Districts to Near Extinction, Brennan Center for Justice, Aug. 11, 2022, https://www.brennancenter.org/our-work/analysis-opinion/gerrymandering-competitive-districts-near-extinction
Princeton Gerrymandering Project, https://gerrymander.princeton.edu/about/
Y. Rudensky and A. Lo, A Better Way to Draw Districts, Brennan Center for Justice, Dec. 12, 2019, https://www.brennancenter.org/our-work/policy-solutions/better-way-draw-districts
Shortest Splitline Algorithm, https://www.rangevoting.org/GerryExamples.html
https://sites.duke.edu/quantifyinggerrymandering/
Metric Geometry and Gerrymandering Group, Tufts University, https://mggg.org/
https://imai.fas.harvard.edu/projects/index.html
Algorithmic Redistricting: Elections Made-to-Order, https://www.youtube.com/watch?v=Lq-Y7crQo44
https://en.wikipedia.org/wiki/Rucho_v._Common_Cause
https://en.wikipedia.org/wiki/Benisek_v._Lamone#Lamone_v_Benisek
Wikipedia, Ranked Voting
FairVote.org https://fairvote.org/
RCV123.com https://www.rcv123.org/
Ballotpedia.org Ranked-Choice Voting (RCV)
FairVote: Results and Analysis From Alaska’s First RCV Election
RCV123.org, Ranked-choice voting pros and cons
David de la Fuente and Deb Otis, High Costs and Low Turnout for U.S. Runoff Elections, Thirdway.org
Wikipedia, 2000 United States presidential election
Great Brook.com, Ranked-Choice Voting: The Good, The Opaque, The End Game
FairVote: RCV in New York City: Cast Vote Record Analysis https://fairvote.org/rcv_in_new_york_city/
Did Ranked-Choice Voting Work in New York City? It Depends Whom You Ask … Samantha Maldonado, The City, July 19 2021
FairVote: Condorcet Criterion
Wikipedia Electoral System of Australia
New York City 2021-2022 Voter Analysis Report
Wikipedia, William M. Tweed
T. Kousser, J. Phillips and B. Shor, Reform and Representation: A New method Applied to Recent Electoral Changes, Political Science Research and Methods 6, 809 (2018).
Vote Smart.org https://justfacts.votesmart.org/
National Center for State Legislatures Elections and Campaigns, Primary Types
Fairvote.org Open and Closed Primaries
Wikipedia Nonpartisan Blanket Primary
Unite America.org https://www.uniteamerica.org/
S. Hill and T. Kousser “Turning Out Unlikely Voters? A Field Experiment in the Top-Two Primary”. Political Behavior. 38 (2): 413–432. doi:10.1007/s11109-015-9319-3.
Christian R. Grose, Reducing Legislative Polarization: Top-Two and Open Primaries are Associated With More Moderate Legislators, Journal of Political Institutions and Political Economy 1, 1 (2020).
Alexander Podkul and Elaine Kamarck, The Primaries Project: Blanket Primaries Have Yet to Deliver, The Brookings Institute, Oct. 2014
D. Otis, Alaska’s Ranked-Choice Voting Winners Earn Strong Mandates and Reflect the State’s Political Diversity, Fair Vote, Nov. 23, 2022, https://fairvote.org/alaskas-ranked-choice-voting-winners-earn-strong-mandates-and-reflect-the-states-political-diversity/
D. Otis, Results and Analysis from Maine‘s 2nd District, Fair Vote, Nov. 16, 2022, https://fairvote.org/results-and-analysis-from-maines-2nd-district/
https://voteview.com/congress/house
D. Clyde, Nevada Voters Back Big Changes to Their Election System, NPR, Nov. 13, 2022, https://www.npr.org/2022/11/13/1136342255/nevada-election-open-primary-ranked-choice-voting
