
July 16, 2026
I: Bjorn Lomborg
Bjorn Lomborg is a Danish political scientist. He is shown in Figure I.1. Lomborg attended the University of Georgia, obtained a master’s degree in political science in 1991 and a Ph.D. degree in political science at the University of Copenhagen in 1994. He is currently the President of the Copenhagen Consensus Center, a Danish think tank, and a visiting fellow at the Hoover Institution at Stanford University. Lomborg and his center espouse views that are sharply contrary to the scientific consensus on global climate change. Lomborg has promulgated his views through books, YouTube videos, op-ed columns in the media, and lectures. There is an extensive collection of quotes from Dr. Lomborg at the DeSmog.com blog site. We have made use of that material in this blog post.

Figure I.1: Bjorn Lomborg is a Danish political scientist and president of the Copenhagen Consensus Center think tank. Lomborg contradicts most of the scientific consensus on global climate change.
Lomborg considers himself a “climate realist.” He agrees that global climate change is occurring and that it is caused by human activity. However, he makes a number of questionable claims about climate change. These include:
- At present, the effects of climate change are trivial. Climate change will not become a serious issue until roughly a century from now.
- Because climate change effects are so small at present, countries will have plenty of time to adapt to future climate scenarios.
- Climate scientists urge countries to replace fossil fuels with renewables, such as solar and wind energy, as soon as possible. Lomborg claims that renewables are a terrible idea, as they are vastly more expensive than fossil fuels. Countries that adopt renewables have far higher energy costs than those that continue with fossil fuels. Furthermore, renewables are intermittent, as they don’t produce energy “when the Sun doesn’t shine and the wind isn’t blowing.”
- Renewables require backup power. Generally, this comes from natural gas or coal, as there is no way that batteries can provide sufficient backup energy. This reliance on fossil fuels for backup means that renewables provide far less energy that is free of greenhouse gases (GHGs) than is claimed by climate scientists.
- On Dec. 20, 2024 Lomborg claimed that at the rate renewables are being installed, the world will need to rely on fossil fuels for the next 400 to 900 years.
- Mainstream scientists assert that global climate change is already causing very costly damages. This is false: far fewer people are dying from natural disasters such as hurricanes and wildfires than they did a century ago.
Climate scientists maintain that Lomborg cherry-picks data that seems to buttress his arguments, that he misrepresents the overwhelming scientific consensus on global climate change, that he minimizes the damage that is currently caused by climate change, and that he dishonestly claims that renewable energy sources such as solar and wind energy are far too expensive and achieve far too little.
Lomborg also has his share of economists who criticize his views. Nobel Laureate Joseph E. Stiglitz, reviewing Lomborg’s 2020 book False Alarm: How Climate Change Panic Costs Us Trillions, Hurts the Poor, and Fails to Fix the Planet, notes that, “Somehow, missing in his list of good policy measures are easy things like good regulations — preventing coal-burning electric generators, for example.” Stiglitz adds that Lomborg, “exhibits a naïve belief that markets work well — ignoring a half-century of research into market failures that says otherwise.” Stiglitz also accuses Lomborg of not taking due account of risk. “As the atmospheric concentration of carbon increases, we are entering uncharted territory. Not since the dawn of humanity has there been anything like this. The models use the ‘best estimate’ of impacts, but as we learn more about climate change these best estimates keep getting revised, and, typically, in only one direction — more damage and sooner than had been expected.” Stiglitz concluded by saying, “This book proves the aphorism that a little knowledge is dangerous. It’s nominally about air pollution. It’s really about mind pollution.”
In this post we will review Bjorn Lomborg’s statements about climate change. In Section II we will show that the current effects of global climate change are much more serious than claimed by Lomborg. In Section III we demonstrate that Lomborg’s claims that the costs of adapting to climate change will be relatively trivial, rely on models developed by William Nordhaus. It is known that the Nordhaus models significantly underestimate the costs of global climate change. In Section IV we show that carbon dioxide and other GHGs are the dominant causes of recent global temperature increases, in contradiction to Lomborg’s claim that CO2 contributions to our ecosystem are mainly positive. In Section V we examine Lomborg’s claim that environmentalists greatly exaggerate the threat from climate change to animal populations. However, recently both polar bears and Emperor penguins, used by Lomborg to ridicule claims that their ecosystems are threatened, have been declared as Threatened or Endangered species. In Section VI we review the cost and efficiency of renewables; we will show that solar and wind energy are efficient, and it is now generally cheaper to install and operate renewables than fossil fuel alternatives. Finally, in Section VII we review the current installation of renewables in China. This recent development shows that Lomborg’s predictions about the prospects for renewables have been completely overtaken by events that Lomborg has not acknowledged.
II: Are Current Effects of Global Climate Change Trivial?
Ever since the release of his book The Skeptical Environmentalist in 2001, Bjorn Lomborg has argued that current effects of global climate change are far less serious than claimed by climate scientists. He particularly attacked statements from the UN that climate change was a major threat to humans due to pollution from fossil fuels. Lomborg wrote, “In misstating the threat to life, the UN ignores the fact that deaths from climate-related catastrophes have declined 97.5% over the past century — or that far more people die from cold than heat.” Although it is true that more people in the past died from extreme cold than from heat, heat deaths are increasing rapidly in many mid-latitude and tropical climates. For example, Europe has seen well over 100,000 heat-related deaths during the 21st century, a rate that has more than tripled from previous quarter-centuries due to climate change.
At this time (July 2026), Europe is experiencing a major heat wave. Particularly in France, it is estimated that more than 2,700 heat-related deaths occurred over a two-week period in June 2026. In fact, the number of heat-related deaths was greater than predicted by climate models. Research shows that a significant number of these heat deaths were a result of the excess heat being returned to Earth from greenhouse gases in the atmosphere, as a result of the burning of fossil fuels. The average high temperature in France in June was 36.9° C (98° F); this broke the previous record set in June 2022 by 2.4° C. Figure II.1 shows the relation between the daily high temperature and all-cause mortality in France. This relation demonstrates that extreme heat is now becoming more deadly than extreme cold, as the globe continues to warm.
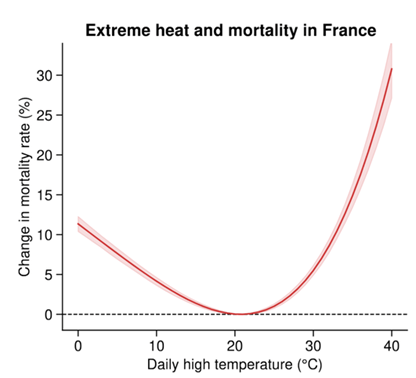
Figure II.1: Relationship between the daily high temperature in °C, and all-cause mortality rates in France. This curve was constructed using data in France from 2004 to 2019. From this one can calculate the percent change in the mortality rate as a function of the daily high temperature.
Humans weren’t the only casualties of this heat wave. Millions of chickens in France died from the excess heat (chickens are quite sensitive to heat). Figure II.2 shows a headline from the July 7, 2026 New York Times reporting the mass deaths of chickens during the June 2026 French heatwave.

Figure II.2: Headline in the New York Times July 6, 2026. In recent months in France, millions of chickens died because of the unprecedented high temperatures in a French heatwave.
From Lomborg’s claims, it might appear that the only effect of global climate change was an increase in deaths due to increased temperatures. But since Lomborg insists that deaths from extreme cold are much greater than those from extreme heat, he has actually claimed that to date, global climate change produces net positive effects.
But the effects of global climate change are much greater than simply more heat deaths. Many changes in the climate system become larger in direct relation to increasing global warming. The 6th Assessment Report (AR6) of the Intergovernmental Panel on Climate Change (IPCC) summarizes some of these effects. They include increases in the frequency and intensity of hot extremes; marine heatwaves; heavy precipitation; agricultural and ecological droughts in some regions; an increase in the proportion of intense tropical cyclones; and reductions in Arctic sea ice, snow cover and permafrost.
Are we seeing an increase in extreme weather events as a result of global warming? Lomborg denies this. He claims that “If you measure the impact of floods, droughts, storms and wildfires in terms of lives lost, far fewer people die today than they did a century ago.” Indeed, over the past century we have gotten much better at predicting disasters and in preparation and evacuation for disasters. However, the number of climate-related catastrophes is increasing rapidly. Figure II.3 is a plot by Munich Re, the world’s largest re-insurance company. It shows the number of natural disasters (counted as ones that cause some loss of life and/or major financial losses) in several different categories for each year from 1980 to 2018. Geophysical events, which are not influenced by global climate change, are shown in red. These are constant during this period. The other three categories are Meteorological events (green), Hydrological events (blue), and Climatological events (orange). In these three categories, which are influenced by climate change, the frequency of disasters has increased by more than a factor of three during this period! This clearly demonstrates that climate-related disasters have shown a very strong increase.
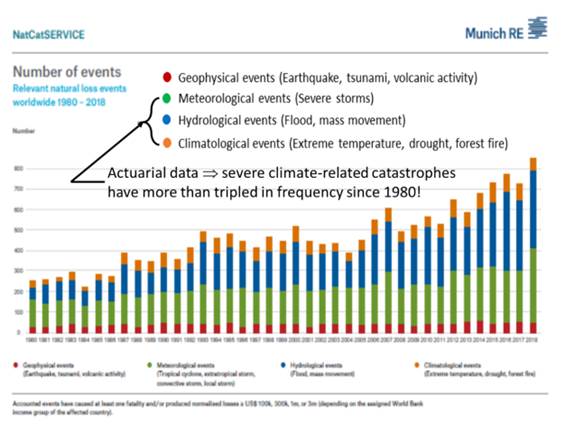
Figure II.3: Large natural loss events around the world from 1980 to 2018, compiled by Munich Re, the world’s largest re-insurance firm. These events, which incurred at least one fatality and whose large financial costs are normalized to 1980 U.S. dollars, are broken into four categories. Geophysical events, which are not related to climate change, are shown in red. Meteorological events are shown in green; Hydrological events in blue; and Climatological events in orange. While the Geophysical events are constant over this period, the three categories influenced by climate change, increase in annual number by more than a factor of 3 during this period.
Over 90% of the excess heat returned to Earth by greenhouse gases in the atmosphere is stored in the Earth’s oceans. The result is that ocean temperatures have increased by a great deal due to global warming. Figure II.4 summarizes some of the many changes in our oceans as a result of global climate change. One change is that the warming oceans expand and thus increase the sea level. Rising sea levels can erode shorelines, bringing pollutants like fertilizer and human waste into ocean waters, where they degrade the water quality. Greater evaporation from warmer oceans increases rainfall near shore areas and can also increase the intensity of tropical cyclones. In polar areas, increased water temperatures will cause sea ice and ice shelves to melt. And increased water temperatures can also cause a decrease in biodiversity and can negatively affect fishing and aquaculture systems. The IPCC Assessments document all of these effects and show how they are steadily becoming more severe.
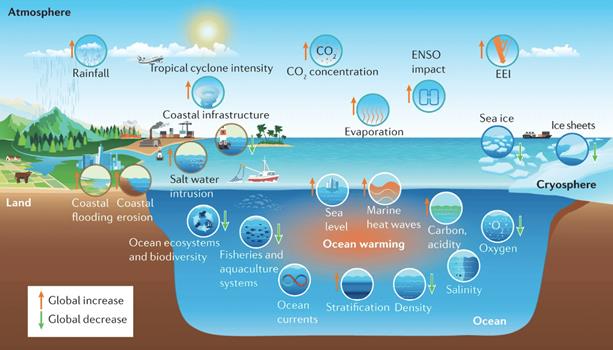
Figure II.4: Some changes in ocean systems that arise as a result of global climate change. Warming causes the sea to expand, producing rising sea levels that leads to coastal erosion and coastal flooding. The warmer water causes more evaporation that leads to more rainfall near the seas and increases the intensity of tropical cyclones. Hotter water temperatures causes a loss of biodiversity and negative effects on fisheries. In polar areas, warmer oceans cause greater melting of sea ice and ice sheets.
Global climate change has made ocean temperatures so high that they threaten warm-water coral reefs. Figure II.5 shows measurements of the status of coral reefs around the world from January 2023 to April 2024. These results were obtained by the National Oceanic and Atmospheric Administration (NOAA). The results range from no stress (light blue) to five “Alert Levels,” ranging from bright red to dark purple. Figure II.5 shows that the only corals experiencing “no stress” are located in a small band south of the Hawaiian islands. Several of the world’s coral reefs are experiencing Alert Levels of stress. There are many climate scientists who predict that if global temperatures reach a level of 2° C above the average level from 1951 to 1980, nearly all warm-water coral reefs will die off or suffer severe damage. Since over 25% of all marine life spends some time in coral reef areas, and 500 million people around the world depend on coral reefs for their livelihood, this level of damage would have very serious negative impact on commercial fisheries.
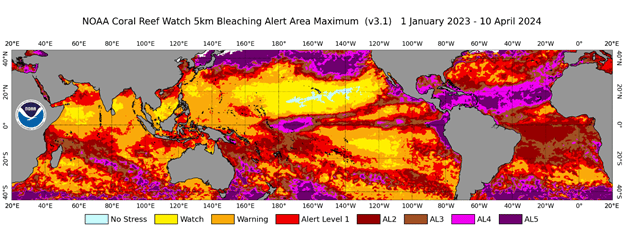
Figure II.5: The stress on warm-water coral reef systems around the globe from January 2023 to April 2024. Compiled by the U.S. National Oceanic and Atmospheric Administration (NOAA). Land masses are colored in gray. Coral reef stress levels are color-coded, from no stress (light blue) up through various Alert Levels labeled bright red to dark purple. Note that the only reef system experiencing “no stress” is a small area just south of the Hawaiian islands. Much of the world’s coral reefs are experiencing stress at Alert Levels.
Another feature of climate change is that sea levels around the world are rising. Lomborg acknowledges this fact but dismisses it. “There certainly are studies showing that low-lying Bangladesh will be threatened by sea level rises by the end of the century. But similarly, the UN also assumes that by then Bangladesh will be richer than the Netherlands is now, and able to afford flood defences.” Lomborg does not attach a price tag to building a massive series of dikes in Bangladesh. But surely he knows that not only are sea levels rising around the globe, but that at present the rise is accelerating. Figure II.6 shows how the rate of sea level rise is increasing. Sea levels are measured using buoys anchored in the sea, and since 1993 sea levels have also been measured using dedicated satellites. The buoy and satellite measurements are in excellent agreement.
There are essentially three things driving sea level increase: expansion of the oceans as they absorb heat radiated back to Earth from greenhouse gases in the atmosphere; melting from ice shelves and ice sheets; and subsidence of land. Since the start of satellite measurements in 1993 the cumulative rise in sea level has reached 10-11 cm, or about 4.3 inches, by 2026. If the seas continued to rise at the present rate of 4.5 mm/yr, sea level would rise by more than one foot during this century. But since the rate of rise is steadily increasing, the likely toll by the end of the century would be 3 feet or more.
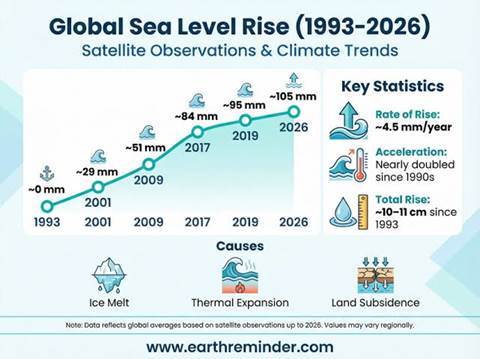
Figure II.6: Graph of global sea level rise from 1993 to 2026, as measured by satellites. The rate of sea level rise has nearly doubled since the mid-1990s, and since 1993 the total rise has been 10 – 11 centimeters. Currently, sea levels are rising by 4.5 mm/yr but that rate continues to increase.
Bjorn Lomborg intimates that the current rate of sea level rise is essentially trivial, and that countries should easily and relatively cheaply be able to adapt to sea level rise. But Figure II.7 shows that Lomborg could be very wrong about this. Figure II.7 shows sea levels in the U.S. in 2100 as predicted by a climate model. Shown in blue are coastal counties where the seas would rise by at least 6 feet in 2100. This includes large stretches of Washington, Oregon and coastal California, significant areas on the Gulf Coast, and large segments of coastal counties on the Eastern Seaboard and New England. Note that Florida, Louisiana, and much of New Jersey and the New York city area would be particularly impacted. People affected by these large flooded areas would have to migrate inland. The figure also shows in red areas that will likely receive large numbers of climate migrants; in this scenario nearly 10 million Americans would have to move inland by 2100. This would lead to enormous costs of adaptation.
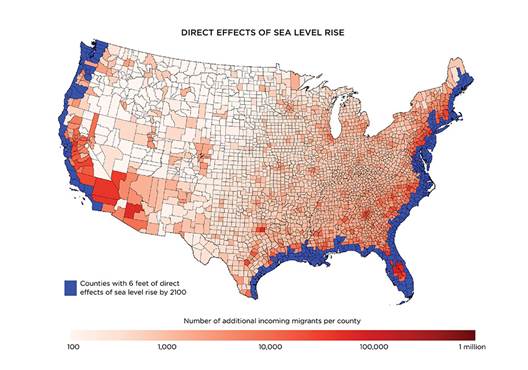
Figure II.7: Results of a simulation of flooding in the U.S. by 2100 if sea levels continue to rise at current levels. Blue areas are U.S. counties that would experience at least 6 feet of sea level rise. This includes large stretches of Washington, Oregon and coastal California, significant areas on the Gulf Coast, and large segments of coastal counties on the Eastern Seaboard and New England. Note that Florida, Louisiana, and much of New Jersey and the New York city area would be particularly impacted. The figure also shows in red areas that will likely receive large numbers of climate migrants; in this scenario nearly 10 million Americans would have to move inland by 2100.
Now, the particular scenario of Figure II.7 predicts larger amounts of flooding than other climate simulations; however, this figure should demonstrate the potentially dire consequences of doing nothing now, assuming that it will be easy to adapt in the future. Furthermore, rising seas, when combined with more severe storms, lead to stronger storm surges and coastal flooding, which will increase the costs of future meteorological disasters.
Bjorn Lomborg dismisses claims that climate events are becoming more severe. As ‘proof’ that climate events aren’t becoming worse, he states that the number of hurricanes in the Atlantic are not increasing, and that wildfires have been decreasing for the past 20 years. Well, climate change doesn’t predict that the number of hurricanes will increase; but it does predict that the severity of hurricanes will increase. As ocean temperatures rise, evaporation will increase, as will the transfer of heat from the ocean to the air. Storms that form will pick up more water vapor and heat. Also, because sea levels are rising, storm surges should become more severe. Figure II.8 shows that the percentage of Atlantic storms classified as major hurricanes (Category 3 or greater) has steadily increased over the past 40 years.
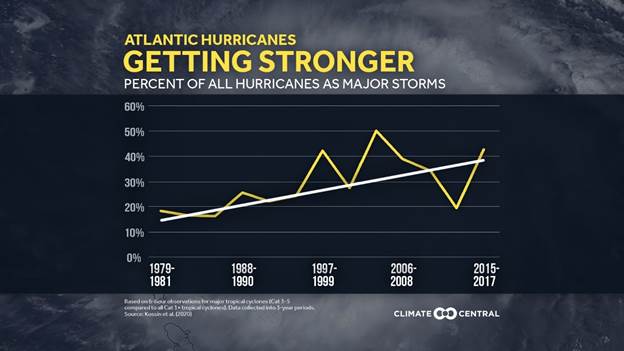
Figure II.8: The fraction of Atlantic hurricanes that are classified as major storms (Categories 3 or higher, on a scale of 1 to 5) has steadily increased from 1980 to 2016.
What about the number of wildfires over the past 20 years? The total global area burned over the past 20 years has decreased, but this is primarily because of a decline in agricultural burning and savanna fires. However, over this time period severe destructive wild forest fires have doubled in frequency globally. In the U.S., the number of wildfires has decreased slightly, but the acreage burned and the costs of these fires have increased markedly. For example, over this period high-severity fires in California have increased by a factor of 30. The three most costly wildfires in California history were the Paradise fire in 2018, and the Eaton and Palisades fires in 2025. This is in large part because drying of forests due to climate change leads to much larger blazes.
So, we see that global climate change is causing large and costly climate events. These are described in great detail in the IPCC Assessment reports. For example, the IPCC 6th Assessment report, issued in 2023, ran to nearly 4,000 pages. It was compiled by a group of 234 climate scientists from 66 countries and contained 14,000 references to scientific papers. If one looks at all six of the IPCC reports, over the years they document the increasingly strong evidence for global climate change. Either Bjorn Lomborg has never looked at these reports, or he chooses to ignore them in favor of highly misleading anecdotes (e.g., climate change effects are negligible because number of hurricanes is not increasing, and the number of wildfires is decreasing). From our information in this section, the evidence is simply overwhelming that current effects are severe and that they are caused by human-induced climate change. As the globe continues to warm the frequency of severe climate change impacts will grow rapidly.
III: William Nordhaus and Bjorn Lomborg: Underestimating Climate Change Costs
William Nordhaus is a Yale economist who was one of the first economists to study climate change. He developed a model for the economic costs of climate change as a percentage of global Gross Domestic Product (GDP). Nordhaus was a genuine environmentalist who anticipated many of the effects of global climate change. He developed a systematic approach to climate based on an Integrated Assessment Model (IAM). Nordhaus’ work was extremely influential in the economics of global climate change, and he shared the 2018 Nobel Prize in Economics for his work in this field. His Dynamic Integrated Climate Economy (DICE) model represented an important first step in understanding the effects of climate change on world economy. Bjorn Lomborg frequently refers to Nordhaus’ predictions to buttress his claims that the economic effects of climate change are currently trivial, and that they will remain trivial for a century or more.
Nordhaus’s DICE models estimate that climate damages will be very low. For example, his models estimate GDP loss at about 8.5% for 6°C of warming and 10.5% for 10°C. However, if we look at the predictions of climate scientists, 6°C of warming is associated with catastrophically large negative effects, and 10°C of warming is roughly equivalent to a climate Armageddon. If he extrapolates these predictions down to warming of 2°C or 3°C, Lomborg can claim that the economic effects of global warming expected by the year 2100 are extremely small. So why do climate scientists and many economists say that Nordhaus’ predictions are underestimated, and perhaps catastrophically so?
There are many papers pointing out serious flaws in Nordhaus’ reasoning. We will refer to three here. The first is New Report Finds Costs of Climate Change Impacts Often Underestimated, by Dana Nuticelli in the Nov. 2019 Yale Climate Connections. The second is The appallingly bad neoclassical economics of climate change by Steve Keen. And the third is The Economics of Immense Risk, Urgent Action and Radical Change, by Stern, Stiglitz and Taylor in the Journal of Economic Methodology in 2022. Steve Keen criticizes several assumptions in the work by Nordhaus and other economists. First, these economists used what they called an “enumerative method.” That assumed that any activities that took place indoors would be unaffected by climate change. This assumes that the following industries would be unaffected by climate change: “all manufacturing, underground mining, transportation, communication, finance, insurance and non-coastal real estate, retail and wholesale trade, and government services.” These make up nearly 90% of all economic activity, and it makes little sense to assume that none of these would be affected by climate change. For example, all industrial sectors will be affected by the necessary conversion from fossil fuels to clean energy sources and the need to improve energy usage efficiencies. Most sectors will be impacted by loss of worker productivity as more individuals are affected by more frequent climate-related disasters, reduced agricultural yields, forced migration from sea level rise, climate-impacted disease carriers, and increasingly frequent and lengthy heat waves. And these effects still ignore the possible impacts of social upheaval and government instability that may be caused by all the above.
Next, the DICE model assumed that the damage from climate change would be a quadratic function of the global temperature increase. And the Nordhaus model explicitly assumed that the economic damage “did not include sharp thresholds or tipping points.” But as we see from the IPCC Climate Assessments, climate change effects are highly non-linear. In particular, there can be “tipping points” that occur when global temperatures reach certain points. While there is considerable uncertainty as to exactly when such “tipping points” will be reached, there is no denying that these events might occur. See our blog post on “Climate Tipping Points” for a more detailed summary of this field. According to Keen, correcting for these errors makes it feasible that the economic damages from climate change are at least an order of magnitude worse than forecast by economists, and may be so great as to threaten the survival of human civilization. And Stern et al. argue that the optimization framework embodied in IAMs is inadequate to capture deep uncertainty and extreme risk, which in this case involves potential loss of lives and livelihoods on an immense scale, and a fundamental transformation and destruction of our natural environment.
Figure III.1 shows the economic damages vs. increase in global temperatures from the Nordhaus model (red curve). This is compared with the results of a model by Keen that includes a tipping point at a temperature increase of 4° C (blue curve). (It is quite likely that by the time global mean temperatures have reached 4°C above pre-industrial levels, more than one serious tipping point will have been passed, with possibly catastrophic impacts.) At 3°C, Keen’s damage model is 8 times greater than the Nordhaus prediction, while at 4°C the Keen model is about 25 times that of Nordhaus. Keen’s model is not a realistic climate simulation but was designed to demonstrate how Nordhaus could drastically under-estimate damages from climate change that has strongly non-linear effects, and could lead to climate tipping points.
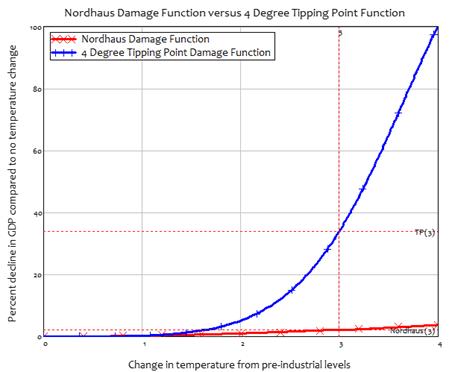
Figure III.1: The economic “damage function” from Nordhaus (red curve), vs. the change in average global temperature from pre-industrial levels. This is compared with a model by Keen (blue curve) that simulated a damage function from a model that had a climate tipping point at a temperature increase of 4°C. At 3°C, Keen’s damage model is 8 times greater than the Nordhaus prediction, while at 4°C the Keen model damages are about 25 times that of Nordhaus.
Therefore, the assurances by Lomborg that global warming effects by 2100 will be negligible are based on estimates by Nordhaus and other economists, that we know are much too small. This is because of the highly non-linear effects of climate change and the dire financial consequences of passing “climate tipping points.” Furthermore, we note that GDP alone does not adequately account for the impacts of lost lives, livelihoods, and property that are likely to result from continuing global warming.
IV: Are Greenhouse Gas Emissions (Particularly Carbon Dioxide) Major Contributors to Climate Change?
Bjorn Lomborg makes light of the dangers posed by the contribution of greenhouse gases, particularly carbon dioxide (CO2), to global climate change. Lomborg says that “We keep emitting more CO2, and remember, we do this because fossil fuels, which is the main reason we emit CO2, deliver a lot of good for humanity.” That statement is not entirely false; CO2 is an essential contributor to plants, which absorb carbon dioxide in order to grow. However, it is also true that when too many GHGs are released into the atmosphere, they will absorb and re-radiate IR heat that has been released by the Earth, sending much of that heat back to Earth and causing the temperature increases and consequent climate impacts that we see. Fossil fuels have indeed facilitated enormous gains in the quality of human lives over the past couple of centuries. But less expensive and more climate-friendly alternative energy sources already exist, so the quality of lives does not rely on the continued dominance of fossil fuels.
Thus, in moderate quantities CO2 has great positive benefits for life on Earth. However, when CO2 released into the atmosphere by the burning of fossil fuels becomes too large, carbon dioxide and other GHGs can cause climate change that brings very negative results. We are all familiar with substances that are beneficial in small doses but toxic in large amounts. If we take a Xanax (alprazolam) pill, it can relieve anxiety. However, if we take an entire bottle of Xanax at once, it is likely to kill us. Figure IV.1 shows the levels of CO2 in the atmosphere as a function of time. Because we are able to measure atmospheric CO2 levels in very deep ice core samples, this curve goes back 800,000 years. We see that CO2 levels have shown considerable variation over the years. However, until now atmospheric CO2 levels have never been below about 180 parts per million (ppm), and never greater than 300 ppm. During the full extent of human civilization up until the 20th century the atmospheric concentration of CO2 has only varied between 260 and 280 ppm. But the curve at the right-hand edge of the graph shows that CO2 levels have very recently increased by 50% until today when they are 428 ppm. Furthermore, the rise in CO2 levels has occurred on a time scale of about 50 years, which is much shorter than the typical time scales of 1,000 years to 100,000 years for oscillating natural events. This is one indication that the rise in CO2 comes from human-induced causes; similar recent increases are shown for methane and other GHGs.
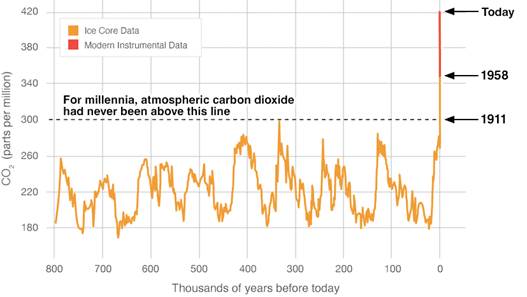
Figure IV.1: The level of CO2 in the atmosphere, in parts per million (ppm), as a function of time. Over the 800,000 years that CO2 levels can be measured using ice core samples, atmospheric CO2 levels have never been less than 180 ppm, and never greater than 300 ppm. But recently, CO2 levels have increased by 50% until they are currently 428 ppm. The rise in CO2 levels has occurred on a time scale of about 50 years.
In recent years, the group Berkeley Earth has measured global mean land temperatures and has calculated the rise in these temperatures over time. Furthermore, they can estimate the contributions from CO2 to global land temperature rise. Figure IV.2 shows yearly global mean temperatures from 1750 to 2020. The black spiky curves show these annual temperatures. From 1850, these are taken from direct measurements, while before 1850 temperatures are estimated from proxy measurements. The solid black curve represents the independently measured CO2 concentration, scaled upward, plus contributions from major volcanoes. The volcanoes release vast amounts of aerosols into the atmosphere. The aerosols reflect Sunlight and thus cool the Earth. However, aerosols in the atmosphere dissipate after just a few years, so volcanic contributions appear as temporary sharp downward spikes in Earth temperatures.
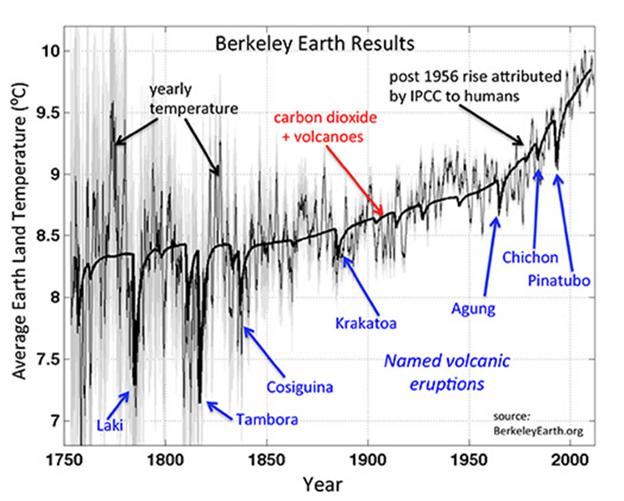
Figure IV.2: Yearly global mean land temperatures from 1750 to 2020 (black spiky curves). From 1850, these are taken from direct measurements while before 1850 temperatures are estimated from proxy measurements. The solid black curve represents the independently measured atmospheric CO2 concentration, scaled upward, plus contributions from major volcanoes, which produce a temporary cooling effect. Volcanic contributions produce sharp downward spikes in Earth temperatures.
It is remarkable that the contribution from CO2 only, scaled upward, gives a very good qualitative fit to global temperature increase. This demonstrates that GHG contributions dominate the increase in global land temperatures. Berkeley Earth has also shown a very strong correlation between the increase in global mean temperatures and atmospheric levels of CO2. Figure IV.3 shows global mean temperatures in Celsius vs. the CO2 concentration in the atmosphere in parts per million. The data points are those measured by Berkeley Earth, and CO2 atmospheric concentrations are from satellite measurements. The solid curves are from an extrapolation of CO2 atmospheric concentrations vs. global mean temperature in oC by the IPCC in their 6th Climate Assessment. The SSP2 “intermediate range” extrapolation, shows that if CO2 continues to be pumped into the atmosphere at current rates, by 2100 global mean Earth temperatures will have increased by about 3.8°C from pre-industrial levels. And by 2100 the atmospheric CO2 concentration will be 790 ppm. These are conditions to which human societies have never been previously exposed.
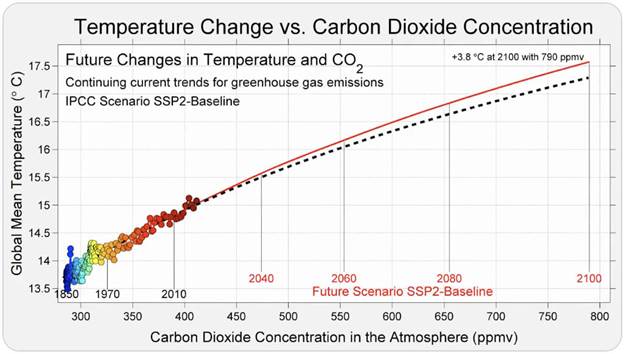
Figure IV.3: Global mean temperature in °C vs. CO2 concentrations in the atmosphere, in ppm. The dots represent data from 1850 through 2020 collected by Berkeley Earth, while the solid curve shows the IPCC extrapolation between the CO2 concentration in the atmosphere and global mean surface temperature. If atmospheric CO2 continues to be released at current rates, then by 2100 CO2 concentrations will have reached about 790 ppm, and global mean temperature will have increased by about 3.8 °C over pre-industrial levels.
The IPCC Assessment Reports detail the many serious effects that global climate change will bring at these GHG levels. In particular, Figure IV.3 shows that every tonne of CO2 that is not released into the atmosphere will help minimize the dire effects of future global climate change. The graphs in this Section contradict Bjorn Lomborg’s claim that carbon dioxide contributes “mainly positive effects” to our ecosystem. This is a claim we have also debunked in detail in our earlier post about Will Happer.
V: What Effect is Climate Change Having on Global Biodiversity?
A 2023 global assessment of species found that 43% of all the world’s species were experiencing rapid population declines. Since 1970, nearly three billion breeding birds have vanished. This has led many scientists to speculate that the Earth might be facing a sixth major extinction event. Current extinction rates seem to be running 100 to 1,000 times natural background extinction rates. And global climate change appears to be playing a major role in this development.
At present, this hypothesis is still the subject of much speculation. However, surveys have shown that roughly three-quarters of biologists agree that a major extinction event is underway. Bjorn Lomborg has focused on the status of two polar creatures, the polar bear and the Emperor penguin. The Al Gore film An Inconvenient Truth focused particularly on the claim that polar bears were threatened. Sea ice plays an especially important role in the culture of polar bears. Because sea ice is melting rapidly due to climate change, it was stated that polar bear numbers were in decline. Figure V.1 shows a polar bear standing on a melting ice floe. Some commentators suggested that polar bears were in danger of extinction.

Figure V.1: A polar bear standing on a melting ice floe. Such an image was an impactful aspect of the Al Gore film An Inconvenient Truth. Photo by Michal Bednarek.
Because polar bears had become a symbol of animals imperiled by global climate change, Bjorn Lomborg was particularly scathing on this issue. It is true that polar bears are not going extinct any time in the near future. However, Lomborg insisted that polar bears were thriving, and that this was due to a reduction in hunting. So, let’s look at the current status of polar bears. Globally, polar bears are classified as Vulnerable on the International Union for Conservation of Nature (IUCN) Red List; and they are protected as Threatened under the U.S. Endangered Species Act. One major reason is the reduction of sea ice, which is caused by global climate change. There is considerable uncertainty in current numbers of polar bears; however, a 2008 study on polar bear populations suggested that only one of the current 19 worldwide polar bear populations may survive until 2050. So, it appears that concerns about polar bear populations based on climate-change trends were well-founded.
The other animal that Lomborg focused on was the Emperor penguin. A family of Emperor penguins is shown in Figure V.2. This is the tallest and heaviest of all penguins and it exists exclusively in Antarctica. Scientists claimed that Emperor penguins were in danger because sea ice was melting and disappearing in Antarctica. Once again, Lomborg has challenged statements that Emperor penguin populations were affected by decreases in sea ice. Lomborg’s claims were seconded by Susan Crockford, who wrote a 2024 report for the Heritage Foundation. She stated that emperor penguin populations “provide ample evidence that so far, reduced sea ice habitats since 1979 have not been harmful and these examples challenge the assumptions in modeled predictions that future sea ice changes are likely to cause quasi-extinctions by the end of the 21st century.”

Figure V.2: An Emperor penguin family.
How well have the Lomborg – Heritage Foundation claims held up? Well, in April 2026 the IUCN declared the Emperor penguin an endangered species. The driver of the Emperor penguin decline is the breakup and loss of sea ice, a result of rapid climate change caused by increased GHG emissions. Now, it should be noted that there are still large numbers of Emperor penguins. A 2009 study estimated that there were about 595,000 adult birds. However, between 2009 and 2018, satellite images suggested a 10% decline in Emperor penguin populations, and it has been estimated with 45% probability that the population will have declined by more than 50% by 2073. Thus, the concerns raised by climate scientists and biologists have been validated; and the claims of climate-change deniers have been refuted.
More generally, animal species are affected by climate change because their habitats may become inhospitable. If the animals are forced to shift their ranges they may come into contact with humans or new predators who threaten their existence. Climate change is only one among several serious threats to biodiversity, but it is by no means a negligible threat.
VI: Are Renewable Energy Sources Such as Solar and Wind Making a Positive Contribution to Reducing Global Climate Change?
Bjorn Lomborg has been particularly dismissive of any positive effects from nations that switch from fossil fuels to renewable energy sources such as solar and wind. In 2024, he claimed that “Despite much hype, the much-vaunted green energy transition away from fossil fuels isn’t happening, Achieving a meaningful shift with current policies turns out to be unaffordable.”
Are we making progress in replacing fossil fuel energy with renewables? In 2021, Lomborg stated “The reality is that even after two decades of climate talks, we get a meagre 0.5% of our total global energy consumption from solar and wind energy … And 25 years from now, even with a very optimistic scenario … the IEA expects that we will get just 2.4 per cent from solar and wind.” Lomborg even denies that renewables are replacing fossil fuels as energy sources. He maintained “Countless studies show that when societies add more renewable energy, most of it never replaces coal, gas or oil. It simply adds to energy consumption.”
Lomborg emphasized that countries adopting renewables have far higher costs than those that continue with fossil fuels. Furthermore, renewables are intermittent, as they don’t produce energy “when the Sun doesn’t shine and the wind isn’t blowing.” But can’t we use batteries to store wind and solar energy for later use? According to Lomborg, “all the batteries in Europe can store power for just one minute and 21 seconds of the continent’s average electricity demand”. Thus, solar and wind energy “can only work with massive amounts of backup power, mostly fossil fuels”. We show below that Lomborg’s claims about renewables and battery storage are now completely false.
If Bjorn Lomborg’s statements were true 25 years ago, they are certainly false today (and he continues to make these claims). Figure VI.1 shows the cost of installing and operating various renewable energy sources as a function of time, in one decade from 2014 to 2023. The cost of concentrated solar power (where a bank of mirrors reflects sunlight onto a tower containing a liquid) decreased by 54%; the cost of solar cells decreased by 75%; the cost of offshore wind decreased by 60%; and the cost of onshore wind decreased by 63%. And 81% of renewable energy capacity added in 2023 delivered electricity at a lower cost than from fossil fuels, directly contradicting Lomborg’s claim that renewables are much costlier than fossil fuel sources. The costs of renewable energy sources have continued to decrease rapidly since 2023. Lomborg simply ignored the impact of extensive R&D in a rapidly developing energy sector.
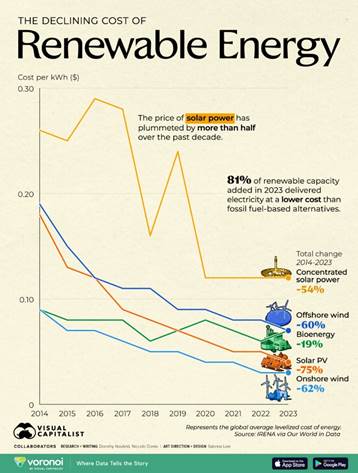
Figure VI.1: The cost of installing and operating renewable energy sources (in $ per kilowatt-hr) as a function of time from 2014 to 2023. The cost of concentrated solar power decreased by 54%, solar cells decreased by 75%, offshore wind decreased by 60% and onshore wind decreased by 63%. And 81% of renewable energy capacity added in 2023 delivered electricity at a lower cost than from fossil fuels.
Is it true that renewables are not replacing fossil fuels as an energy source, but just adding to total electricity generated? Figure VI.2 shows the change in global electricity generation capacity, in TeraWatts (TW), from 2024 to 2025. Solar and wind generation increased roughly 10 to 60 times as much as natural gas, while energy generated from coal decreased during that period. New solar and wind installations are now greatly outstripping new fossil fuel plants. In fact, by April 2026 solar and wind power combined to provide 22% of worldwide electricity demand, more than that supplied by natural gas.
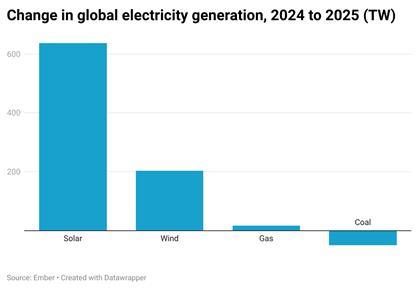
Figure VI.2: The change in global electricity generation capacity, in TeraWatts (TW), from 2024 to 2025. Solar installations increased by more than 600 TW, with wind about 200 TW, compared with gas about 10 TW while coal decreased.
What about the price of batteries? Figure VI.3 shows the cost per kilowatt-hr (kWh) of lithium-ion batteries, adjusted for inflation, from 1991 to 2023. The cost has decreased by 99% during that period (from $9,200/kWh in 1991 to $111/kWh in 2023). And researchers believe that by 2030 the cost may decrease to $32 – $54 per kWh. This is clearly a tremendous decrease in battery prices; it accompanies the dramatic price decreases in solar and wind power during a similar period. Furthermore, the production of lithium-ion and sodium-ion batteries is projected to meet the demand for short- and medium-term energy storage from increasing renewables installations throughout this decade. And solid state batteries are becoming an attractive alternative technology. Long-duration energy storage is likely to rely on pumping water to higher levels for later use or performing electrolysis on water to store hydrogen (or methane with the addition of CO2) for later use.
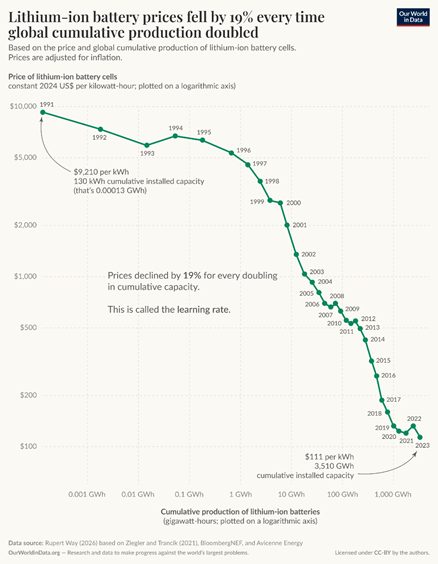
Figure VI.3: The cost per kilowatt-hr (kWh) of lithium-ion batteries, adjusted for inflation, from 1991 to 2023. The cost decreased by 99% during that period (from $9,200/kWh in 1991 to $111/kWh in 2023). Researchers suggest that by 2030 the cost may decrease to $32 – $54 per kWh.
A few years ago, Bjorn Lomborg claimed that, at the rate renewable energy sources were replacing fossil fuels, it would take between 400 and 900 years to phase out fossil fuel energy production. Figure VI.4 shows that in 2023, the combination of solar, wind and hydropower accounted for 30% of global electricity generation. And solar and wind are growing rapidly, as shown in Figure VI.2, so that by 2026 that fraction is approaching 40%. Compare that fraction to the 2.4% Lomborg projected for 2046! In the following Section we will show that solar and wind installations in China in the past three years will produce a major increase in the fraction of global electricity from renewable sources.
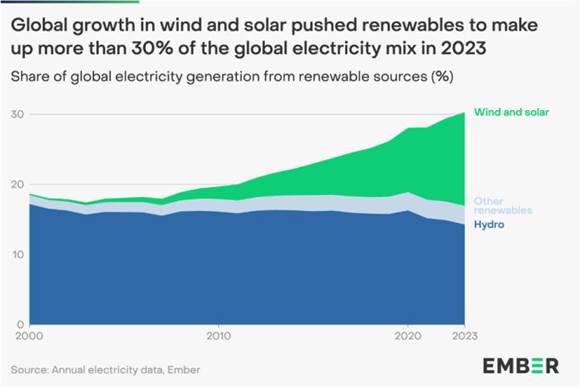
Figure VI.4: The fraction of global electricity production provided by renewables from 2000 to 2023. The combination of hydropower, solar and wind, and other renewable sources amounted to over 30% of global electricity in 2023 and that fraction is approaching 40% by 2026.
Figure VI.5 shows the contribution of various sources to total global electricity, in PWh/yr (PetaWatt hours/yr), from 1990 extrapolated to 2050. If the estimates from this figure are correct, from this year forward renewables are expected to provide a steadily greater fraction of global electricity. Future energy from fossil fuels is expected to decrease steadily, which would invalidate Lomborg’s claim that renewables are simply increasing the total electricity generated, rather than replacing fossil fuels. Global energy demand is increasing but so is the fraction provided by clean energy sources.
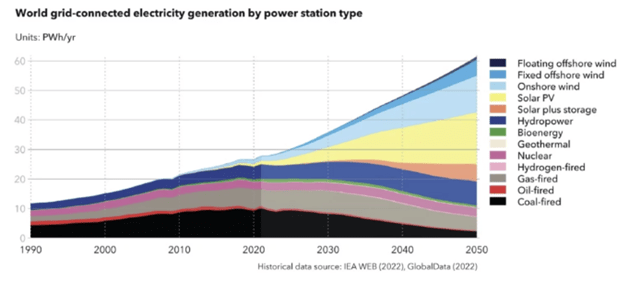
Figure VI.5: Global electricity generated by various sources, from 1990 extrapolated to 2050. From this year, renewables are projected to provide a steadily greater fraction of global electricity. Energy from fossil fuels is expected to decrease steadily.
VII: What is China Doing With Renewable Energy Sources?
In the past several years,China has initiated a gigantic project to install renewable energy. Their initial goal was to install 1,200 GigaWatts (GW) of power by 2030. However, it surpassed this goal in 2024. By the end of 2025, China had installed more than 1,100 GW of solar power capacity and 600 GW of wind power capacity. It now aims to install 2,800 GW of renewable power by 2030. To give some indication of the magnitude of this project, a large conventional nuclear fission reactor typically produces 1 GW of power. Thus, by 2030 China will have installed the equivalent of 2,800 new nuclear power plants, obtaining power from renewable energy. Even if one allows for the shortfalls from times the Sun is not shining and the wind is not blowing, the renewable capacity will still be conservatively equivalent to about 700 large nuclear power plants. Figure VII.1 shows that by 2023, China had already installed enough solar and wind power to completely provide all of the residential electricity to the entire country (residential electricity accounts for only 17% of China’s electricity needs).
Anyone listening to Bjorn Lomborg would assume that this project was impossible – solar and wind energy was completely uneconomical, and it was foolish to think that renewables would overtake fossil fuels in the foreseeable future – perhaps not for hundreds of years. Note that Lomborg was still making these remarks in 2024 and 2025, after China had already completed a significant fraction of these installations.
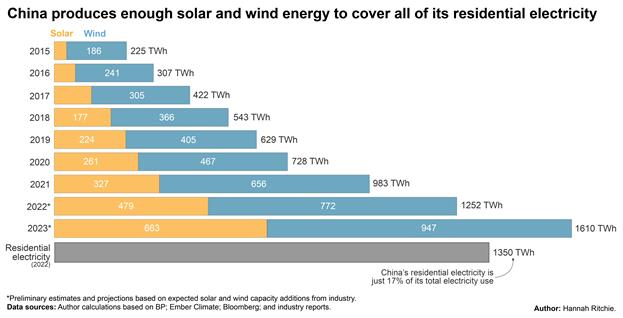
Figure VII.1: Solar and wind energy installations in China from 2015 to 2023. By 2023, China had already installed enough solar and wind power to completely provide all the residential electricity to the entire country (residential electricity accounts for only 17% of China’s electricity needs).
Figure VII.2 shows the remarkable increase in installed solar power. In 2022, China had installed 37 GW of solar power capacity, compared to 53 GW in the rest of the world (the U.S., India, Germany and Brazil were the major countries with significant installed solar power). However, by the first half of 2025, China had installed 256 GW of solar power, which was more than twice the solar capacity of the rest of the world combined. And the installations accelerated in the second half of 2025, so that the cumulative solar power capacity in China exceeded 1100 GW. In 2024, China had already installed more solar power than any other country. But in August of that year, Bjorn Lomborg stated “Despite much hype, the much-vaunted green energy transition away from fossil fuels isn’t happening. Achieving a meaningful shift with current policies turns out to be unaffordable.” So, either Lomborg remained ignorant of China’s accomplishments, or he has deliberately avoided noting this tremendous accomplishment.
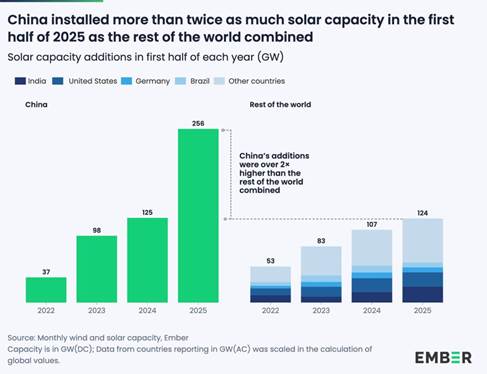
Figure VII.2: The increase in installed solar power. In 2022, China had installed 37 GW of solar power, compared to 53 GW in the rest of the world. However, by the first half of 2025, China had installed 256 GW of solar power, more than twice the solar capacity of the rest of the world combined.
Here is a video showing how China has been installing grids of solar cells. Chinese projects involved solar cell installations along bodies of water, on farms, in deserts, and even in mountainous areas. The process involves heavy-duty drones that help to install (as well as periodically clean) banks of solar cells. This allows the cells to be placed in regions where locating solar cells might have previously seemed impossible.
The Chinese project is immense. It is expensive – some have compared the price and scope to the Manhattan Project, the American development of the atomic bomb in World War II. Nevertheless, it definitively shows the world that with the right motivation, a nation can rapidly switch from fossil fuels to renewables. Figure VII.3 shows the breakdown of Chinese energy sources from 2015, projected forward to 2050. The projected power will be 8,000 GW in 2050. Of that, only about 1% will come from coal, gas and oil, with more than 50% from solar and another 25% from wind power. China has been installing new coal power plants recently, in part to fill in gaps in renewable production, but their plan is to rapidly reduce their coal utilization by 2050.
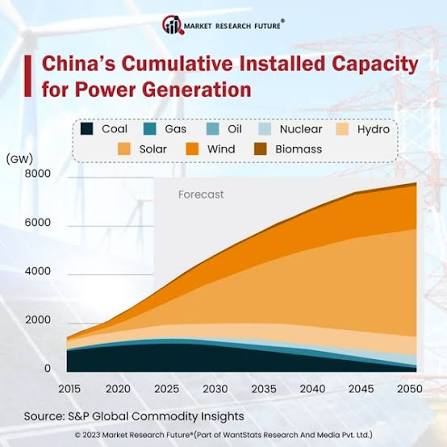
Figure VII.3: The breakdown of Chinese power sources from 2015, projected forward to 2050. Power sources are coal, gas, oil, nuclear, hydropower, solar, wind and biomass. The projected total power will be 8,000 GW in 2050. Of that, only about 1% will come from coal, oil and gas, with approximately 4,200 GW from solar and another 2,000 from wind power.
Figure VII.3 shows that by the year 2050, China is projected to produce 99% of its energy from non fossil-fuel sources: primarily from hydropower, nuclear, solar and wind. This completely contradicts Bjorn Lomborg’s claims that such a transformation could never be accomplished in the next 25 years.
Since solar and wind renewables only generate power when the Sun is shining and the wind is blowing, what forms of backup power are China using to store energy? Bjorn Lomborg has intimated that batteries would be totally inadequate to store that much energy. But batteries are the main form of backup power being installed in China. They are deploying massive containerized lithium-ion batteries for backup power. They are also the world’s largest supplier of electric vehicle batteries. They have also built large pumped hydro storage for longer-term energy storage. They have even been experimenting with “gravity batteries” that use surplus power to lift large blocks, and then re-capture the power when the blocks are lowered to provide backup energy. Once again, Lomborg is completely wrong that backup power for renewables will have to come primarily from fossil fuel sources.
The Chinese program that is replacing the need for fossil fuels demonstrates that Bjorn Lomborg’s claims about renewable energy sources are disastrously wrong and completely outdated.
VIII: Summary
In this post, we have examined Bjorn Lomborg’s assessment of the global climate and his attacks on renewable energy sources such as solar and wind. Our findings agree with Lomborg’s scientific critics. He maintains that the current climate situation is relatively trivial. He does this by ignoring the exceptionally detailed Assessment reports by the IPCC, and instead dismissing the problems with a few glib and misleading statements. Lomborg uses a climate damage model developed by William Nordhaus to predict the economic costs of global climate change. However, we showed in Section III that assumptions made by Nordhaus result in serious underestimates of the costs of climate change. And as global temperatures continue to increase, the Nordhaus model then predicts climate change damages that are vastly below what will be actual costs.
Bjorn Lomborg also minimizes the loss of biodiversity in the world today, and the major role played by climate change. He focused on two species in polar regions – polar bears and the Emperor penguin — where it appeared that climate change effects would be highly adverse to their living conditions. Lomborg claimed that, in fact, the numbers of both species were increasing. We pointed out that, at present, both species are listed as Threatened or Endangered; and the cause of these threats is largely a direct consequence of global climate change.
Bjorn Lomborg continues to assert that renewable energy sources such as solar and wind are much more expensive to install than fossil fuels. He insists that prices for renewable installation are unaffordable, even as the price of renewables is now definitely lower than fossil fuels. He has estimated that it would take hundreds of years to replace fossil fuels with renewables. However, he ignores the very rapid drop in prices recently for renewable installation and operation. Lomborg also claims that backup systems needed because of the intermittent power from renewables almost always come from fossil fuels. Once again, he disregards the dramatic drop in the price of batteries and their increasing performance.
Perhaps the most devastating blow to Lomborg’s assertions is the remarkable installation of solar and wind power in China. China now produces more solar power energy than the rest of the world combined. By 2050 it is projected that 99% of China’s electricity will be produced by renewable energy sources. And the backup energy systems will not be supplied by fossil fuels. So, Bjorn Lomborg’s putdowns of renewable energy sources have been completely negated by China’s progress.
Unfortunately, it is reported that Lomborg has a significant influence on Chris Wright, the head of the U.S. Department of Energy, and climate change deniers in the current Trump Administration. Indeed, Lomborg’s continuing claims come across as political talking points rather than as a result of serious analysis. So, while China proceeds ahead with its revolutionary developments in renewable energy, not only is the U.S. instituting backward-looking energy policies, it is at the same time trying to cut back on solar and wind installations. The U.S. is even paying billions of dollars to companies with contracts to install wind energy projects, to abandon their projects.
One final note: Fareed Zakaria has pointed out that the recent US-Israeli war with Iran has shown the world that supplies of oil and gas can be disrupted in very short order by instability in the Middle East. As a result, developing countries are rapidly pivoting towards renewable energy sources. The Philippines has imported more than $400 million worth of solar panels since February 2026. Pakistan has begun expanding its solar energy sector and projects that it will save $6.3 billion in fossil fuel imports. In Africa, countries such as South Africa, Kenya and the Congo may accelerate purchases of solar technology, batteries and electric vehicles that will protect their countries from the uncertainty associated with fossil fuels. Even Gulf states that receive a large amount of their revenue from fossil fuels are shifting investments to overseas renewable projects in order to diversify their revenue sources.
Since the current U.S. administration has abdicated its investment in green technology, the major beneficiary of recent investments in renewables will be China. And Bjorn Lomborg is a major advisor to the Trump 2.0 administration in its retrograde energy policy. It is almost as though Donald Trump is determined to “Make China Great Again.”
Source Material:
Wikipedia, Bjorn Lomborg https://en.wikipedia.org/wiki/Bj%C3%B8rn_Lomborg
DeSmog.com Bjorn Lomborg https://www.desmog.com/bjorn-lomborg/
Bjorn Lomborg, Green Electricity Costs a Bundle, Wall Street Journal, Jan. 1, 2025 https://www.wsj.com/opinion/green-electricity-costs-a-bundle-wind-solar-data-analysis-power-prices-259344f4
Joseph Stiglitz, Are We Overreacting on Climate Change? New York Times, July 16, 2020 https://www.nytimes.com/2020/07/16/books/review/bjorn-lomborg-false-alarm-joseph-stiglitz.html
Bjorn Lomborg, The Skeptical Environmentalist: Measuring the Real State of the World, Cambridge University Press, 2001 https://www.amazon.com/Skeptical-Environmentalist-Measuring-State-World/dp/0521010683
C. Barnes et al., Summer Heat Deaths in 854 European Cities More Than Tripled Due to Climate Change, Environement, Sept. 17, 2025 https://www.actu-environnement.com/media/pdf/depeches/477.pdf
C. Callahan and A. Dressler, France’s June Heatwave Caused More Than 2,700 Heat-Related Deaths, Carbon Brief, July 7, 2026 https://www.carbonbrief.org/guest-post-frances-june-heatwave-caused-more-than-2700-heat-related-deaths/
Chico Harlan and Leontine Gallois, The Chickens Were Doing Just Fine. Then the Heatwave Killed Millions, New York Times July 6, 2026 https://www.seattletimes.com/nation-world/the-chickens-were-doing-just-fine-then-the-heat-wave-killed-millions/
Intergovernmental Panel on Climate Change (IPCC), 6th Assessment Report, August 2021 https://www.ipcc.ch/synthesis-report/
IPCC, AR6 Synthesis Report: Climate Change 2023 https://www.ipcc.ch/report/sixth-assessment-report-cycle/
Munich RE, Natural Catastrophe Service, https://www.munichre.com/en/solutions/for-industry-clients/natcatservice.html
National Oceanic and Atmospheric Administration (NOAA), Coral Reef Watch 2024, https://coralreefwatch.noaa.gov/satellite/research/coral_bleaching_report.php
C. Robinson, B. Dilkina, and J. Moreno-Cruz, Modeling Migration Patterns in the USA Under Sea Level Rise, PLoS ONE 15, e0227436 (2020), https://journals.plos.org/plosone/article?id=10.1371/journal.pone.0227436
Environmental Defense Fund, How Climate Change Makes Hurricanes More Destructive, https://www.edf.org/climate/how-climate-change-makes-hurricanes-more-destructive
Climate Central, Stronger Hurricanes, https://www.climatecentral.org/climate-matters/2020-stronger-hurricanes
NASA, Wildfires and Climate Change, https://science.nasa.gov/earth/explore/wildfires-and-climate-change/
Pinkerton, Wildfires in the American West: A Growing Threat to Lives and Property https://pinkerton.com/our-insights/blog/wildfires-in-the-american-west-a-growing-threat-to-lives-and-property
2018 Nobel Prize in Economics https://www.nobelprize.org/prizes/economic-sciences/2018/summary/
Bob Ward, A Nobel Prize For The Creator of an Economic Model That Underestimates the Risks of Climate Change, Grantham Institute, Jan. 2, 2019 https://www.lse.ac.uk/granthaminstitute/news/a-nobel-prize-for-the-creator-of-an-economic-model-that-underestimates-the-risks-of-climate-change/
Dana Nuticelli, New Report Finds Costs of Climate Change Impacts Often Underestimated, Yale Climate Connections, Nov 19. 2019 https://yaleclimateconnections.org/2019/11/new-report-finds-costs-of-climate-change-impacts-often-underestimated/
Steve Keen, The appallingly bad neoclassical economics of climate change,” Globalizations, Vol. 18, 2021 https://www.tandfonline.com/doi/full/10.1080/14747731.2020.1807856?scroll=top&needAccess=true
N. Stern, J. Stiglitz and C. Taylor, The Economics of Immense Risk, Urgent Action and Radical Change, Journal of Economic Methodology, Vol. 29, 2022. https://www.tandfonline.com/doi/full/10.1080/1350178X.2022.2040740
S. Vigdor and J.T. Londergan, Climate Tipping Points: Coming Soon to a Planet Near You?, Debunking Denial, April 18, 2024 https://debunkingdenial.com/climate-tipping-points-coming-soon-to-a-planet-near-you/
Steve Keen, Playing DICE With Life on Earth: Nordhaus’ Damage Function, Patreon May 11, 2019 https://www.patreon.com/ProfSteveKeen/posts/playing-dice-on-26781733
Rebecca Lindsey, Climate Change: Atmospheric Carbon Dioxide, NOAA Climate.gov May 2025 https://www.climate.gov/news-features/understanding-climate/climate-change-atmospheric-carbon-dioxide
About Berkeley Earth https://berkeleyearth.org/about/
S. Vigdor and J.T. Londergan, Will Happer, Climate Change Denier, DebunkingDenial, July 12, 2019, https://debunkingdenial.com/will-happer-climate-change-denier/
Elizabeth Pennisi, Three Billion North American Birds Have Vanished Since 1970, Surveys Show, Science Sept. 19, 2019 https://www.science.org/content/article/three-billion-north-american-birds-have-vanished-1970-surveys-show
Wikipedia, Holocene Extinction https://en.wikipedia.org/wiki/Holocene_extinction
Wikipedia, An Inconvenient Truth https://en.wikipedia.org/wiki/An_Inconvenient_Truth
Polar Bear International, Polar Bear Facts: Status and Population https://polarbearsinternational.org/polar-bears/polar-bear-facts/status/
U.S. Fish and Wildlife Service Finds Polar Bear Status Remains Threatened https://www.fws.gov/press-release/2023-09/us-fish-and-wildlife-service-finds-polar-bear-status-remains-threatened
S. Amstrup et al., A Bayesian Network Modeling Approach to Forecasting the 21st Century Worldwide Status of Polar Bears, AGU Geophysical Monograph Series https://agupubs.onlinelibrary.wiley.com/doi/10.1029/180GM14
Wikipedia, Emperor Penguin https://en.wikipedia.org/wiki/Emperor_penguin
Susan Crockford, Resilient Wilds: Unmasking the Surprising Adaptability of U.S. Ecosystems to Climate Change https://www.heritage.org/sites/default/files/2024-10/SR294.pdf
International Union for Conservation of Nature (IUCN), Emperor Penguin and Red Seal Now Endangered Due to Climate Change, April 9, 2026 https://iucn.org/press-release/202604/emperor-penguin-and-antarctic-fur-seal-now-endangered-due-climate-change-iucn
U.N. Climate Action: Renewable Energy – Powering a Safer and Prosperous Future https://www.un.org/en/climatechange/raising-ambition/renewable-energy
Visual Capitalist, The Plummeting Cost of Renewable Energy, https://licensing.visualcapitalist.com/product/chart-the-plummeting-cost-of-renewable-energy/
Wikipedia World Energy Supply and Consumption https://en.wikipedia.org/wiki/World_energy_supply_and_consumption
Michelle Lewis, In a First, Wind and Solar Generated More Power Than Gas Globally in April 2026, Elektrek https://electrek.co/2026/05/20/in-a-first-wind-solar-generated-more-power-than-gas-globally-april-2026/
Ember Energy, Global Electricity Review 2023 https://ember-energy.org/latest-insights/global-electricity-review-2023/
UABIO, 83% of Global Electricity Will be Generated by RES in 2050 https://uabio.org/en/materials/13819/
Bloomberg, Huge Chinese Desert Projects Will Power Next Wave of Wind, Solar https://www.bloomberg.com/news/articles/2022-02-26/huge-chinese-desert-projects-will-power-next-wave-of-wind-solar
EnergyNow.com China’s Wind and Solar Are Now Almost Enough to Power Every Home, Feb. 14 2023 https://energynow.com/2023/02/chinas-wind-and-solar-are-now-almost-enough-to-power-every-home/
Michelle Lewis, H1 2025: China Installs More Solar Than Rest of the World Combined, Elektrek Sept 2 2025 https://electrek.co/2025/09/02/h1-2025-china-installs-more-solar-than-rest-of-the-world-combined/
Anshula Mandaokar, China to Achieve its Target in the Wind and Solar Energy by 2025, Market Research Future https://www.marketresearchfuture.com/news/china-to-achieve-its-target-in-the-wind-and-solar-energy-by-2025
Millions of Solar Panels: How China is Covering Mountains and Seas with Solar Energy, https://www.youtube.com/shorts/rri5KZlA_q8
D. Walter, et al., X-Change: Batteries, RMI Report, Dec. 2023, https://rmi.org/app/uploads/dlm_uploads/2023/12/xchange_batteries_the_battery_domino_effect.pdf
Jennifer L, China’s One Month Lithium Battery Energy Storage Installations Beat America’s One Whole Year, Carbon Credit.com April 22, 2026 https://carboncredits.com/china-outpaces-u-s-in-lithium-battery-storage-bess-installations-65-gwh-in-a-month-vs-47-gwh-in-a-year__trashed/
Lili Pike, China Climate Plan Pushes Renewables in Factories, Data Centers, Los Angeles Times July 11, 2026 https://www.latimes.com/environment/story/2026-07-11/china-climate-plan-pushes-renewables-in-factories-data-centers
Fareed Zakaria, Facebook https://www.facebook.com/reel/1327376912109945
Julia Simon, The Iran War has Pushed Some Countries Away From Oil and Toward Clean Energy, NPR July 9, 2026 https://www.npr.org/2026/07/09/nx-s1-5872786/iran-war-evs-solar-energy-transition
Q&A: What Does the Iran War Mean for the Energy Transition and Climate Action? Carbon Brief, March 10, 2026 https://www.carbonbrief.org/qa-what-does-the-iran-war-mean-for-the-energy-transition-and-climate-action/
E. Mehlum and D. Rabley, The Energy Transition’s Foundations are Weakening: the US – Iran Crisis Shows Why That Matters Now, World Economic Forum, June 18, 2026 https://www.weforum.org/stories/energy-transition/energy-transitions-us-iran-crisis/
B. Plumer, Trump Administration to Pay $765 Million to Cancel 4 More Wind Projects, New York Times, June 17, 2026, https://www.nytimes.com/2026/06/17/climate/trump-wind-farms-cancel-millions.html

